Abstract— The study aimed at determining the
techno-economic viability of renewable energy mix for sustained power supply in 3 sites of Northern Nigeria. It investigated the viability of grid connected renewable power sources of PV standalone, Wind standalone and PV-Wind Hybrid systems. Three sites were selected to ascertain the feasibility of producing energy from renewable sources, while considering the prevailing regulations and feed-in tariff for renewable electricity in Nigeria as stipulated by the Nigerian Electricity Regulatory Commission (NERC). NERC used the Weighted Average Cost of Capital (WACC) to determine the Feed-in-Tariff for power generation. The 24 years daily global solar radiations, maximum and minimum daily temperature data and wind speed data that were employed for this study were provided by the Nigeria Meteorological agency (NIMET), Oshodi, Lagos, Nigeria. Optimised designs were developed for each location. The results showed that with the current real WACC stipulated in NERCs Regulations on Feed-in Tariff for Renewable Energy Sourced Electricity in Nigeria, the Wind standalone system was found to be most suitable for Katsina (North-west) and Ilorin (North-central), while the PV-Wind hybrid system only slightly improved the viability of harnessing the RE resources of solar PV and wind energy at a debt to equity ratio of 70 to 30%. However, if the WACC is improved such that the real WACC is reduced by 5%, all the three PV standalone power plants become viable, alongside all of the Wind standalone power plants in terms of Net Present Value and annual profits. Hence, this study reveals that with proper economic incentives, RE for grid generation can be profitable in Nigeria.
Index Terms— Wind power, wind turbine, solar power,
hybrid energy system, energy systems, electric power systems, renewable energy
Manuscript received March 6, 2018. This work was supported in part by Covenant University, Ota, Nigeria
Adekojo Waheed is with the Department of Mechanical Engineering, Federal University of Agriculture, Abeokuta, Nigeria
(e-mail: [email protected]).
Oluseyi. O Ajayi is with Department of Mechanical Engineering, Covenant University, Ota, Nigeria
(+234-8036208899; e-mail: [email protected]). O. David Ohijeagbon is with the Department of Mechanical Engineering,
Federal University of Agriculture, Abeokuta, Nigeria (e-mail: [email protected]).
I. INTRODUCTION
LECTRICITY is fundamental to development. It is a means to improved social and economic well-being just as it is vital to industrialization and wealth creation. It is also the gateway to employment opportunities. The nation’s pursuit of becoming one of the 20 most developed countries in the world by 2020 requires adequate supply and access to modern power. The energy policy document of the federal government’s vision 20:2020 stipulates the desire of the government to use energy as one of the tools to drive the developmental stride of making Nigeria become one of the top 20 economies in the world by the year 2020 [1-2]. This therefore makes access to modern energy pivotal to the development agenda of Nigeria. However, present situation suggests more efforts are required to resolve the imbalance between demand and supply of electricity in the country. A moderate estimation of power generated by households and industrial sectors from petrol and diesel generators falls at about 2500 MW [3]. This unsustainable means of power generation is both environmentally unfriendly and costly. It usually brings about upsurge in the cost of doing business and also costly products. The consequence may be attributed to underperforming manufacturing sector. Recent statistics in 2013 showed that the manufacturing sector contributed 4% toward the Gross Domestic Product (GDP). This is poor and need improvement when compared to other national figures such as 35% in Thailand, 34% in China, 30% in Malaysia, 28% in Indonesia, and 19% in India[4-13]. Aside this, the small and medium scale enterprise will be the most underdeveloped sector in a situation of lack of access to modern power supply. This sector has been known to provide several employment opportunities [3], and can contribute to national well-being of the populace. One major way out of the energy situation of Nigeria, according the policy document of vision 20:2020 is for Nigeria to have a robust energy mix which will include the conventional generation as well as renewable energy generation as standalone and grid connected facilities.
II. REVIEW OF PREVIOUS STUDIES
Based on the aforementioned, several assessment studies have been carried out at both national level and by individual researchers at determining the viability of
Techno-Economic Analysis of NERC’s
Feed-in-Tariff for Sustained Grid-Connected Renewable
Power Supply: Case of 3 Selected Sites of
Northern Nigeria
Adekojo Waheed, Oluseyi. O Ajayi, O. David Ohijeagbon
renewable energy adoption for power generation [14-21]. For instance, in Nigeria many research studies exist that have appraised the potential of hybrid Renewable Energy (RE) system for power generation [22-25]. However, most of the existing study reports considered small scale generation for remote telecom applications and for buildings. Others that focused on grid connected systems only served to verify the possibility of scaling up the designed renewable energy generation sources to the MW range, to benefit from the allowance provided through embedded generation [26]. Moreover, studies on design and econometrics analysis of hybrid systems that provide sustainable power as grid-alone systems in the form of power plants are rare. Also, the impact of the national feed-in-tariff system as developed by the Nigerian Electricity Regulatory Commission (NERC) has never been analysed to determine its economic viability and investor friendliness. This study is therefore focused on the techno-economic assessment of hybrid RE for sustainable power supply in Northern Nigeria. The selection of this region for an evaluation of the feasibility of sustained power supply via RE is predicated on the fact that a lot of studies have proven that Northern Nigeria is endowed with vast RE resources [27-29]. Also, at present the large sized power plants installed in Northern Nigeria are predominantly the Hydroelectric Power Plants. Three sites, one each, of the three geo-political zones in this region of the country were considered in this study.
III. PRESENT WORK
This present work aims at determining the techno-economic viability of the national feed-in-tariff system for grid connected PV standalone, Wind Standalone and PV-Wind Hybrid systems in selected sites from the three geo-political zones of Northern Nigeria. Three sites were selected to ascertain the feasibility of producing energy from renewable sources, while considering the prevailing regulations and feed-in tariff for renewable electricity in Nigeria as stipulated by NERC [30]. The result of this research will aid the decision-making process by potential investors, as regions and locations where a specific renewable standalone system is viable are highlighted.
IV. MATERIALS AND METHODS
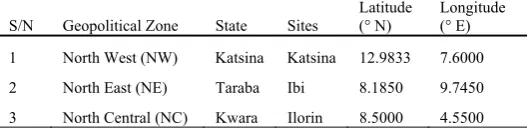
The geographical description of the location of the selected sites are as displayed in Table 1.
A. Data Collection
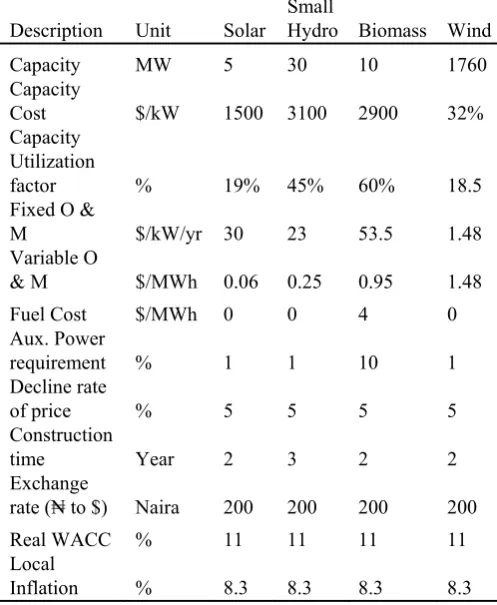
The 24 years’ daily global solar radiations, maximum and minimum daily temperature data and wind speed data that were employed for this study were provided by the Nigeria Meteorological agency (NIMET), Oshodi, Lagos, Nigeria Tables 2 to 5 present the basis of calculating NERC’s feed-in tariff feed-in $/MWh for Renewable Electricity feed-in Nigeria [30]. NERC utilized the Weighted Average Cost of Capital (WACC) in arriving at the Feed-in Tariff for power generation. WACC is a calculation of a business entity’s cost of capital in which each classification of capital is
proportionally rated. All sources of capital, which include common stock, preferred stock, bonds, and other long-term debt can be included in WACC calculation. The ratio of equity to debt was used in weighting the equity and debt returns in the WACC calculation.
The WACC was estimated by NERC with the following assumptions [30]:
Risk free rate 18% Nominal cost of debt 24% Nominal return on equity 29% Gearing level (debt/equity) 70% / 30% Corporate tax rate 32%
The assumptions provide the basis for the following estimates:
Nominal before tax WACC 25% Nominal after tax WACC 17% Real pre-tax WACC 11% Real after tax WACC 7%
The minimum permissible amount of power generated that can be fed into the national grid at any given instance is 1 MW. Therefore, the renewable energy systems designed in this study worked with capacities of Solar PV array sizes and Wind Turbine models that will optimally take advantage of the Feed-in tariff as captured in Table 5. Table 6 displays the cost for each constituent of the hybrid system [31].
B. Modelling the Photovoltaic (PV) and Wind Power
System
Design equations and formulas utilized for both PV and wind analyses were those of: Duffie and Beckman, [32], and Erbs et al. [33] used in the design of solar PV systems, and Weibull probability density function [34], Hiester and Pennell [35], and Le Gouriérès [36] used in the design for wind energy systems.
To accurately determine the feasibility and sustainability of these systems, the HOMER® software optimizing tool [37] was used in carrying out the sensitivity analysis and optimisation.
C. Modelling the Photovoltaic (PV) and Wind Power
System
[image:2.595.305.569.715.780.2]For each component according to Ohijeagbon and Ajayi [26], the salvage value, maintenance, capital and fuel costs, together with other sundry costs or revenues for all the components sum up to the system’s annualized cost. The total net present cost (NPC) and other cost components were determined based on equations and derivations profiled in Ohijeagbon and Ajayi [26].
TABLE 1
LOCATION PARAMETER OF THE STUDIED SITES
S/N Geopolitical Zone State Sites
Latitude (° N)
Longitude (° E)
1 North West (NW) Katsina Katsina 12.9833 7.6000
2 North East (NE) Taraba Ibi 8.1850 9.7450
TABLE 2
BENCHMARK CAPACITIES FOR QUALIFYING TECHNOLOGY
Technology
Minimum Capacity (MW)
Maximum Capacity (MW)
Wind 1 10
Small Hydro 1 30
Biomass (including
municipal solid waste) 1 10 Solar Photovoltaic 1 5
TABLE 3
TARGET GRID-CONNECTED RENEWABLE GENERATION CAPACITY BY THE YEAR 2018
Technology
Capacity Limit (MW)
Wind 100
SHP 370
Biomass 150 Solar
[image:3.595.307.537.81.191.2]Photovoltaic 380
TABLE 4
ASSUMPTIONS FOR RENEWABLE ENERGY FEED-IN TARIFF COMPUTATION
Description Unit Solar
Small
Hydro Biomass Wind
Capacity MW 5 30 10 1760
Capacity
Cost $/kW 1500 3100 2900 32%
Capacity Utilization
factor % 19% 45% 60% 18.5
Fixed O &
M $/kW/yr 30 23 53.5 1.48
Variable O
& M $/MWh 0.06 0.25 0.95 1.48
Fuel Cost $/MWh 0 0 4 0
Aux. Power
requirement % 1 1 10 1
Decline rate
of price % 5 5 5 5
Construction
time Year 2 3 2 2
Exchange
rate (₦ to $) Naira 200 200 200 200
Real WACC % 11 11 11 11
Local
Inflation % 8.3 8.3 8.3 8.3
TABLE 5
FEED-IN TARIFF FOR 2016 BASE YEAR
Year Description Units Solar Wind
FIT2016 (Naira)
Capacity
Cost ₦/MWh 35,370.05 24,791.55 O & M ₦/MWh 29.49 302.73 Total ₦/MWh 35,399.54 25,094.28
FIT2016 (US$)
Capacity
Cost $/MWh 176.85 123.96 O & M $/MWh 0.15 1.51 Total $/MWh 177.00 125.47
TABLE 6
COST OF COMPONENTS USED IN THE DESIGN OF HYBRID ENERGY SYSTEM [31]
Component
Annual Real Interest Rate (%)
Project Life time (years)
Cost ($/kW)
O & M ($)
Replacement Cost ($/kW) Wind
turbine 11 & 6 15 1800 500/yr. 1500 Solar panel 11 & 6 25 1500 0/yr. 1000
Battery 11 & 6 10 100 20/yr. 100
Converter 11 & 6 12 500 80/yr. 500
E. Solar and wind turbine systems specification
The Enercon wind turbines were cumulatively employed for wind standalone and wind-PV hybrid applications. The turbine specification is indicated in Table 7. A 1 kW SUNPOWER mono-crystalline silicon cell was used [26, 32, 38]. The cell parameters are:
Collection area 5.1 m2
Efficiency, η 19.6% Nominal operating temperature 45 oC
Temperature coefficient 0.4% Miscellaneous losses 10%
Array slope site’s latitude angle V. RESULTS AND DISCUSSION
Viability of standalone PV in the selected sites
Fig. 1 presents the monthly average solar radiation profiles of the selected sites. The figure shows that the 24 years’ monthly average ranged between 3.913 (kWh/m²/d) in August for Ilorin and 6.356 (kWh/m²/d) in April for Katsina.
Fig 1: 24- Year Monthly Average Radiation (kWh/m²-day) for selected sites in Northern Nigeria
[image:3.595.42.291.314.617.2] [image:3.595.304.544.459.561.2]LCOE and NPC refers to the Value of Energy per kW and the Net Present Value of the project respectively. Upon comparison of Table 8 and 9, it is apparent that the optimal techno-economic design for each location increased. Hence, more energy was produced and more grid sales were made. The total annualized costs represent the actual annual profit or loss incurred yearly. A negative annual cost implies the value of annual profits made at the respective location.
TABLE 7
WIND TURBINE SPECIFICATION Wind
Machin e
Vc
(m/s) VFi
(m/s )
VFo
(m/s )
VR
(m/s )
PeR
(kW )
Hub Heigh t (m)
Rotor Diamete r (m)
Enercon 3 2 25 12 3000 135 101 Vc = cut-in speed, VFi = cut-out speed (low wind), VFo = cut-out speed (high
wind), VR = rated speed, PeR = rated power
Viability of wind turbine standalone system (WSS)
Fig. 2 shows the average monthly wind speed profiles of the sites. It depicts that the 24 years’ wind speed ranged between 2.95 m/s in June for Ibi and 9.89 m/s in June for Katsina.
Fig. 2: Plot of 24 Years’ Monthly Average Wind Speeds for selected locations in Northern Nigeria
From Table 10, WSS is not economically feasible at Ibi, while Katsina is the most viable, with a Net Present Value of US$28,215,764.00 and an LVOE of $0.072/kWh. Also, based on the NERC’s feed-in-Tariff regime of 11%, 2 of the three sites are economically viable for wind power generation. Moreover, Ibi’s result shows that with slightly improved wind speed profile, WSS will be a viable power resource.
However, if the debt to equity ratio is improved or special funding was realized, such that the real interest rate is remodelled to 6%, remarkable changes are observed for all 3 sites in terms of energy production and profits. Tables 10 & 11 both reflect a ranking of the degree of viability of Wind standalone systems amongst the selected locations.
TABLE 8
OPTIMIZED ASSESSMENT OF THE PV STANDALONE POWER PLANT IN TERMS OF 11% REAL INTEREST RATE.
Location PV Size (kW)
Converter (kW)
Initial Capital ($)
Total Annual Cost ($/yr)
Mean Power Output (kW)
Total NPC ($)
LCOE ($/kWh)
PV Production
(kWh/yr) Katsina 8000 5000 14,502,000.00 -39,859.00 1,593 - 335,685.00 -0.003 13,995,402
Ilorin 5750 3500 10,377,000.00 137,169.00 1,020 1,155,202.00 0.018 8,936,367 Ibi 6000 3500 10,752,000.00 146,337.00 1,060 1,232,409.00 0.019 9,289,647
TABLE 9
OPTIMIZED ASSESSMENT OF THE PV STANDALONE POWER PLANT IN TERMS OF 6% REAL INTEREST RATE
Location PV Size
(kW) Converter (kW) Capital ($) Initial
Total Annual Cost ($/yr)
Mean Power Output
(kW) Total NPC ($) ($/kWh) LCOE
PV Production
(kWh/yr) Katsina 10000 5000 17,502,000,00 -676,933.00 1,991 -8,653,476.00 -0.049 17,444,232
[image:4.595.310.549.54.156.2]Ibi 10500 5000 18,252,000.00 -445,138.00 1,856 -5,690,361.00 -0.035 16,256,893 Ilorin 10500 5000 18,252,000.00 -450,117.00 1,863 -5,754,006.00 -0.035 16,318,597
TABLE 10
OPTIMIZED ASSESSMENT OF THE WIND STANDALONE POWER PLANT IN TERMS OF 11% REAL INTEREST RATE
Location
Wind Turbine
(kW) Initial Capital ($) Total Annual Cost ($/yr) Mean Power Output (kW) Total NPC ($) ($/kWh) LCOE Wind Production (kWh/yr)
Katsina 12000 21,020,500.00 -3,923,832.00 7,078 -28,215,764.00 -0.072 62,001,108 Ilorin 12000 21,020,500.00 -848,607.00 3,675 -6,102,224.00 -0.028 32,189,926 Ibi 9000 15,770,500.00 38,936.00 1,961 279,982.00 0.002 17,181,262
TABLE 11
OPTIMIZED ASSESSMENT OF THE WIND STANDALONE POWER PLANT IN TERMS OF 6% REAL INTEREST RATE
Location
Wind Turbine
Size
(kW) Initial Capital ($) Total Annual Cost ($/yr)
Mean Power Output
(kW) Total NPC ($) ($/kWh) LCOE Wind Production (kWh/yr)
Katsina 12000 21,020,500.00 -4,682,724.00 7,078 -45,479,776.00 -0.086 62,001,108 Ilorin 12000 21,020,500.00 -1,607,500.00 3,675 -15,612,436.00 -0.053 32,189,926 Ibi 12000 21,020,500.00 -563,663.00 2,615 -5,474,433.00 -0.026 22,908,292
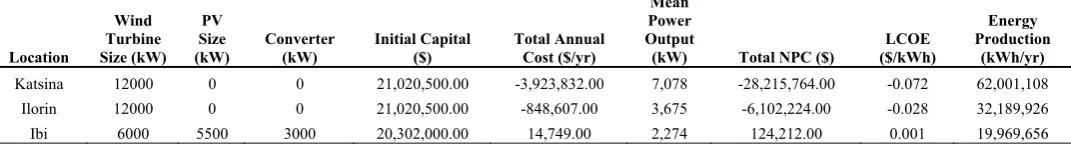
[image:4.595.36.551.616.683.2]Table 12 presents the feasibility assessment for the optimal PV-Wind hybrid design for the three selected sites. It was discovered that the hybrid system improved the NPC of Ibi over the PSS and WSS projects at 11% real WACC. The LCOE value for Ibi, for PSS and WSS was $0.019/kWh and $0.002/kWh respectively. However, with the Wind-PV hybrid set-up, the LCOE becomes $0.001/kWh. For Katsina, in North West Nigeria, and Ilorin, in North Central Nigeria, the same WSS design setup was the optimized value for the hybrid system, as zero kilowatt for wind and PV were included in the sensitivity analysis during optimization. Hence, the Wind-PV hybrid is proven to be less viable than an equivalent WSS at these locations.
Table 13 reveals that at a 6% real interest rate, hybrid installation at Ibi becomes viable over the respective PSS and WSS installed at this same location.
Tables 14 – 16 highlight the significance of an improved government intervention on the promotion of RE for grid-generation. The Results indicate that investment at NERC’s regulation of 11% Real Interest Rate (RIT) will bring about:
- Losses in solar PV investment of between $137,169 and $146,337 per year in two of the three sites.
- Losses in wind power investment of just $38,926 per year at Ibi alone.
- Losses in hybrid systems investment of about $14,729 for Ibi, which is an improvement on the losses incurred on both the PSS and WSS at the same location.
A remodeling to 6% RIT brings about profits at all sites for both the PSS and WSS:
- Profit of between $450,117 and $676,933 from solar PV per year.
- Profit of between $563,663 and $4,682,724 from wind power per year.
Table 16 demonstrates that hybrid system for grid generation of RE is the only preferred for better returns on investment at Ibi (North-East) with NERC’s regulation of 11% Real Interest Rate. For all other regions, the WSS fared better than their respective PSS and hybrid configurations. Moreover, the results demonstrate that with proper feed-in-Tariff regime systems, the power generation from renewable
[image:5.595.298.532.160.231.2]energy resources, especially from wind and solar can be very profitable and attractive to investors. Hence, suggesting that the Federal government of Nigeria need to reconsider the tariff regime in a bid to remodel it for the economic benefit of investors and thereby promote the adoption of renewable power systems.
TABLE 14
PV STANDALONE POWER PLANT IN TERMS OF 11% AND 6% REAL INTEREST RATES (RIT)
Location
PV Sales (kWh/yr.) at 11% RIT
Profit ($/yr.) at 11% RIT
PV Sales (kWh/yr.) at 6% RIT
Profit ($/yr.) at 6% RIT
Katsina 12,039,241 39,859.00 13,727,783 676,933.00 Ilorin 7,697,124 (137,169.00) 12,749,677 445,138.00 Ibi 7,896,896 (146,337.00) 12,777,895 450,117.00
TABLE 15
WIND STANDALONE POWER PLANT IN TERMS OF 11% AND 6% REAL INTEREST RATES (RIT)
Location Wind Production (kWh/yr.) at 11% RIT
Profit ($/yr.) at 11% RIT
Wind Production (kWh/yr.) at 6% RIT
Profit ($/yr.) at 6% RIT
Katsina 54,587,468 3,923,832 54,587,468 4,682,724 Ilorin 30,077,842 848,607 21,758,430 1,607,500 Ibi 17,181,250 (38,936) 30,077,842 563,66
TABLE 16
WIND-PV HYBRID IN TERMS OF 11% AND 6% REAL INTEREST RATES (RIT)
Location
Wind-PV Production (kWh/yr.) at 11% RIT
Loss ($/yr.) at 11% RIT
Wind-PV Production (kWh/yr.) at 6% RIT
Profit ($/yr.) at 6% RIT
Ibi 18,526,718 (14,749) 20,393,856 780,547.00
VI. CONCLUSION
[image:5.595.32.568.602.675.2]The study investigated the economic viability of the NERC’s feed-in-tariff system for grid connected renewable power of PV standalone, Wind Standalone and PV-Wind Hybrid systems. It employed data for three selected sites from northern Nigeria to ascertain the plausibility of producing energy from renewable resources, while
TABLE 12
OPTIMIZED ASSESSMENT OF THE WIND-PV HYBRID STANDALONE POWER PLANT IN TERMS OF 11% REAL INTEREST RATE
Location
Wind Turbine Size (kW)
PV Size (kW)
Converter (kW)
Initial Capital ($)
Total Annual Cost ($/yr)
Mean Power Output
(kW) Total NPC ($)
LCOE ($/kWh)
Energy Production
(kWh/yr) Katsina 12000 0 0 21,020,500.00 -3,923,832.00 7,078 -28,215,764.00 -0.072 62,001,108
Ilorin 12000 0 0 21,020,500.00 -848,607.00 3,675 -6,102,224.00 -0.028 32,189,926 Ibi 6000 5500 3000 20,302,000.00 14,749.00 2,274 124,212.00 0.001 19,969,656
TABLE 13
OPTIMIZED ASSESSMENT OF THE WIND-PV HYBRID STANDALONE POWER PLANT IN TERMS OF 6% REAL INTEREST RATE
Location
Wind Turbine
Size (kW)
PV Size (kW)
Converter (kW)
Initial Capital ($)
Total Annual Cost ($/yr)
Mean Power Output
(kW) Total NPC ($) ($/kWh) LCOE
Energy Production
(kWh/yr) Katsina 12000 0 0 21,020,500.00 -4,682,724.00 7,078 -45,479,776.00 -0.086 62,001,108
considering the prevailing regulations and feed-in tariff for renewable energy sourced electricity in Nigeria as stipulated by the NERC. Optimised designs were developed for each location. The results showed that with the current NERCs
Regulations on Feed-in Tariff for Renewable Energy Sourced Electricity of 11% Real Interest Rate, the drive towards attraction of investors will be greatly hindered. However, if the WACC is improved such that the real WACC is remodelled to 6%, renewable electricity will be economically viable across the three sites. Hence, the impact of the NERC’s economic model on returns on investment as it relates to wind and solar power technologies for grid generation was demonstrated. The outcome further showed that with proper economic incentives, RE for grid generation can be profitable in Nigeria.
REFERENCES
[1] Ajayi, Oluseyi O. Ajayi, Oluwatoyin O. 2013. Nigeria’s energy policy: inferences, analysis and legal ethics towards RE development, Energy Policy 60, 61 – 67
[2] Ajayi, O.O. 2010. Nigeria’s energy policy and vision 20:2020: Issues of wind and other renewable energy technologies, In: Daramola, A., Adeoye, A., Akinola, R., Alagbe, W. and Ajayi, S (ed.). Sustainable Development and Environmental Protection (Strategies and Procedures for Developing Nations), Institute of Environmental Research and Development, 117-120
[3] Sulaimon O. “52 years after independence: It is 4,203MW for 160 million people.” Available online [http://tribune.com.ng/index.php/features/48086-52-years-after-independence-it-is-4203mw-for-160million-people, written by Tuesday, 25 September 2012 Accessed 12th February 2013] [4] Ramkishen S. Rejan: IPS Working Papers No. 1 The Currency and
Financial Crisis in South-East Asia: A Case of `SUDDEN DEATH’ OR `DEATH FORETOLD’. The Institute of Policy Studies pp.5-7 (1998)
[5] Impact of WTO on Women in Agriculture by Research Foundation Science & Technology New Delhi National Commission for Women, New Delhi p.3, (2005)
[6] Reshaping TOMORROW, Is South Asia Ready for the Big Leap? Edited by EJAZ GHANI Published in India by Oxford University Press copyright World Bank 2011 Available online [http://www-wds.worldbank.org/external/default/WDSContentServer/IW3P/IB/20 11/11/07/000386194_20111107000241/Rendered/INDEX/654200PU B00PUB0ing0Tomorrow0English.txt accessed 2nd March 2, 2013] [7] Structural Changes, Industry and Employment in the Indian
Economy- Macro‐economic Implications of Emerging Pattern Sponsored by Indian Council of Social Science Research (ICSSR) New Delhi: Economic Survey, Government of India, pp21-25 (2011) [8] Editors: Sadiq Ahmed, Ejaz Ghani: South Asia- Growth and Regional
Integration: The World Bank; World Bank, 2005a, page 30-35. First published, 2007 Macmillan India Limited
[9] Power Generation (Status and Outlook) Presidential Task Force on Power- Electric Power Investors Forum- Bureau of Public Enterprises, pp.15, (2011)
[10] Boulton, William; Pecht, Michael; Tucker, William; Wennberg, Sam (May 1997)."Electronics Manufacturing in the Pacific Rim, World Technology Evaluation Center, Chapter 4: Malaysia". [http://wtec.org. Retrieved March 2, 2013]
[11] Lu, F., G. Song, J. Tang, H. Zhao, & L. Liu, “Profitability of China’s Industrial Firms (1978-2006)”. China Economic Journal, 1, No. 1, pp. 1–31, (2008)
[12] Rawski, T., “Will Investment Behavior Constrain China's Growth?” China Economic Review, No. 13, pp. 361–72, (2002)
[13] Tham Siew-Yean: Can Malaysian Manufacturing Compete With China in The WTO? Asia-Pacific Development Journal Vol. 8, No. 2, December 2001 The World Bank, World Bank Development Indicators, page 2 (2000)
[14] Adekoya, L.O. Adewale, A.A., 1992. Wind energy potential of Nigeria, Renewable Energy, 2(1): 35-39
[15] Ahmed Shata, A.S. Hanitsch, R., 2006. Evaluation of wind energy potential and electricity generation on the coast of Mediterranean Sea in Egypt, Renewable Energy, 31: 1183-1202
[16] Fadare, D.A. A., 2008. Statistical analysis of wind energy potential in Ibadan, Nigeria, based on weibull distribution function, The pacific journal of science and technology, 9(1): 110-119
[17] Ahmed, S.A., 2010. Wind energy as a potential generation source at Ras Benas, Egypt, Renewable and Sustainable Energy Reviews, 14: 2167-2173
[18] Ajayi, O.O., Fagbenle, R.O. and Katende, J. 2011. Assessment of wind power potential and wind electricity generation using WECS of two sites in South West, Nigeria, International Journal of Energy Science, 1 (2), 78-92
[19] Oluseyi O. Ajayi, Richard O. Fagbenle, James Katende, Julius M. Ndambuki , David O. Omole , and Adekunle A. Badejo. 2014. Wind energy study and energy cost of wind electricity generation in Nigeria: past and recent results and a case study for South West Nigeria, Energies, 7 (12), 8508 – 8534
[20] Ajayi, O.O. Ohijeagbon O.D. Nwadialo, C.E. Olasope, Olumide. 2014. New model to estimate daily global solar radiation over Nigeria, Sustainable Energy Technologies and Assessments 5, 28 – 36 [21] Ohijeagbon O.D. Ajayi, Oluseyi. O. 2014. Potential and Economic viability of stand-alone hybrid systems for a rural community of Sokoto, North-West Nigeria, Frontiers in Energy, 8 (2), 145 – 159 [22] Ajayi, O.O., Ohiose, D.O., Ogbonnaya, M and Attabo, A. (2016).
Wind power mapping and NPV of embedded generation systems in Nigeria, International Journal of Environmental, Chemical, Ecological, Geological and Geophysical Engineering, 10 (5), 394 – 405
[23] Abatcha H. G, Ahmad M.Y.Jumba, Ladan Maijama’ (2011) Design and Simulation of a Hybrid PV/FUEL Cell Energy System. Continental Journal of Engineering Sciences, Vol. 6 (1): pp.37-45. [24] Agajelu, B. O.; Ekwueme, O. G.; Obuka, N. S. P. (2013) Life Cycle
Cost Analysis of a Diesel/Photovoltaic Hybrid Power Generating System. Industrial Engineering Letters ISSN 2224-6096 (Paper) ISSN 2225-0581 (online), Vol.3, No.1, Reprinted pp.1-13
[25] Mbakwe, S. N; Iqbal M. T.; (2011) Amy Hsiao: Design of a 1.5kW Hybrid Wind / Photovoltaic Power System for a Telecoms Base Station in Remote Location of Benin City, Nigeria. Pg 1-7
[26] Nwosu C.; Uchenna U. C., Madueme T. (2012) Wind-Solar Hybrid Power System for Rural Applications in the South-Eastern States of Nigeria, Journal of Electronics, Communication and Instrumentation Engineering Research: 2(2), 304-316
[27] Ohijeagbon, O.D. Ajayi, O.O, 2015. Solar regime and LVOE of PV embedded generation systems in Nigeria, Renewable Energy, 78, 226 – 235
[28] Oluseyi O. Ajayi, Ohiozua D. Ohijeagbon, Michael C. Agarana, Ameh Attabo, Mercy Ogbonaya, (2017). Feasibility and Econometrics Assessment of Standalone and Hybrid RE Facilities for Rural Community Utilization and Embedded Generation in North-West, Nigeria, Lecture Notes in Engineering and Computer Science: Proceedings of the World Congress on Engineering 2017, Vol II WCE 2017, July 5-7, 2017, London, U.K., 952-957
[29] Oluseyi O. Ajayi, O.D. Ohijeagbon, Ogbonnaya Mary, Attabo Ameh: Potential and econometrics of standalone RE facility for rural community utilization and embedded generation in North-East, Nigeria, Sustainable Cities and Society 21 (2016) 66 - 77
[30] Regulations on Feed-in Tariff for Renewable Energy Sourced Electricity in Nigeria, [Available online at www.nercng.org/index.php/library/documents/Regulations/Feed-in-Tariff-for-Renewable-Energy-Sourced-Electricity-in-Nigeria.pdf] accessed on 23rd July 2017
[31] Ajayi, Oluseyi O, Ohijeagbon O.D., 2017. Feasibility and techno-economic assessment of standalone and hybrid RE for rural electrification in selected sites of south eastern Nigeria, International Journal of Ambient Energy, 38(1), 55-68. DOI: 10.1080/01430750.2015.1035799
[32] Duffie, J. A. and Beckman, W. A. (1991) Solar Engineering of Thermal Processes 2nd ed., Wiley, New York
[33] Erbs D. G., Klein, S. A., Duffie, J. A. (1982). Estimation of the diffuse radiation fraction for hourly, daily and monthly- average global radiation. Solar Energy 28: 293-302
[34] Weibull, W. (1951) “A Statistical Distribution Function of Wide Applicability”, Journal of Applied Mechanics ASME 18 (3): 293–297 [35] Hiester, T. R., Pennell, W. T. (1981). The Siting Handbook for Large
Wind Energy Systems, WindBooks, New York, NY, USA.
[36] Le Gouriérès, D. (1982). Wind power plants: theory and design. Oxford: Pergamon Press.
[37] HOMER Software (Available online at http://homerenergy.com/, downloaded July 2017)