Automated Processing of the Single-Lead
Electrocardiogram for the Detection of
Obstructive Sleep Apnoea
Philip de Chazal*, Member, IEEE, Conor Heneghan, Member, IEEE, Elaine Sheridan, Richard Reilly, Member, IEEE,
Philip Nolan, and Mark O’Malley, Senior Member, IEEE
Abstract—A method for the automatic processing of the electrocardiogram (ECG) for the detection of obstructive apnoea is presented. The method screens nighttime single-lead ECG recordings for the presence of major sleep apnoea and provides a minute-by-minute analysis of disordered breathing. A large independently validated database of 70 ECG recordings acquired from normal subjects and subjects with obstructive and mixed sleep apnoea, each of approximately eight hours in duration, was used throughout the study. Thirty-five of these recordings were used for training and 35 retained for independent testing. A wide variety of features based on heartbeat intervals and an ECG-derived respiratory signal were considered. Classifiers based on linear and quadratic discriminants were compared. Feature selection and regularization of classifier parameters were used to optimize classifier performance. Results show that the normal recordings could be separated from the apnoea recordings with a 100% success rate and a minute-by-minute classification accuracy of over 90% is achievable.
Index Terms—Electrocardiogram, estimated respiration, heart rate variability, pattern recognition, sleep apnoea.
I. INTRODUCTION
S
LEEP apnoea [1] is commonly defined as the cessation of breathing during sleep. If breathing does not stop but the volume of air entering the lungs with each breath is signifi-cantly reduced, then the respiratory event is called a hypop-noea. Clinicians usually divide sleep apnoea into three major categories—obstructive, central, and mixed apnoea. Obstructive sleep apnoea (OSA) is characterized by intermittent pauses in breathing during sleep caused by the obstruction of the upper airway. The airway is blocked at the level of the tongue or soft palate, so that air cannot enter the lungs in spite of continued efforts to breathe. This is typically accompanied by a reduction in blood oxygen saturation and leads to wakening from sleep in order to breathe. Central sleep apnoea (CSA) is a neurologicalManuscript received January 8, 2002; revised November 5, 2002. This work was supported by the Conway Institute UCD and by the UCD President’s Re-search Award. Asterisk indicates corresponding author.
*P. de Chazal is with the Department of Electronic and Electrical En-gineering, University College Dublin, Belfield Dublin 4, Ireland (e-mail: [email protected]).
C. Heneghan, R. Reilly, and M. O’Malley are with the Department of Elec-tronic and Electrical Engineering, University College Dublin, Belfield Dublin 4, Ireland.
E. Sheridan is with the Motorola, Cork, Ireland.
P. Nolan is with the Physiology Department, University College Dublin, Earlsfort Terrace Dublin 2, Ireland.
Digital Object Identifier 10.1109/TBME.2003.812203
condition which causes the loss of all respiratory effort during sleep and is also usually marked by decreases in blood oxygen saturation. With CSA the airway is not necessarily obstructed. Mixed sleep apnoea combines components of both CSA and OSA, where an initial failure in breathing efforts allows the upper airway to collapse.
Currently, a definitive diagnosis of sleep apnoea is made by counting the number of apnoea and hypopnoea events over a given period of time (e.g., a night’s sleep). Averaging these counts on a per-hour basis leads to commonly used standards such as the apnoea/hypopnoea index (AHI) or the respiratory disturbance index (RDI) [1]. Standard criteria have been developed to categorize the severity of the apnoea. Accurate identification of an apnoea or hypopnoea event requires direct measurement of upper airway airflow and of respiratory effort. Definitive measurements of these quantities require a subject to use an esophageal balloon and wear a full-faced mask which, being invasive, disturbs sleep. Consequently, this method is not often used and instead the less invasive polysomnogram [1] is used.
The polysomnogram requires the recording of electroen-cephalogram, electrooculogram, and electromyogram to determine sleep stages, oronasal airflow, and chest wall ab-dominal wall movements for respiratory effort, and oxygen saturation to monitor the effect of respiration and the electro-cardiogram (ECG) for heart rate monitoring and arrhythmia screening. Typically, a full night’s sleep is observed before a diagnosis is reached and in some subjects a second night’s recording is required. The polysomnogram provides indirect evidence of apnoea and hypopnoea events and studies have shown there is a significant intraobserver and interobserver variability when used to identify these events [2].
Sleep studies are expensive because they require overnight evaluation in sleep laboratories with dedicated systems and at-tending personnel. Due to the cost and relative scarcity of di-agnostic sleep laboratories, it is estimated that sleep apnoea is widely under diagnosed [3]. Hence, techniques which provide a reliable diagnosis of sleep apnoea with fewer and simpler mea-surements and without the need for a specialized sleep labora-tory may be of benefit.
This paper outlines a scheme for providing a reliable diag-nostic measure of OSA based solely on measurement of the ECG. The motivation for this study arose from a joint initia-tive of Physionet and the organizers of the 2000 Computers in Cardiology Conference, in which they conducted a competition
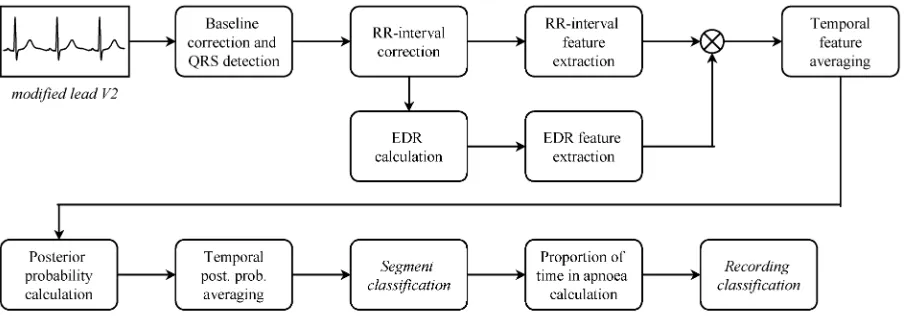
Fig. 1. Schematic representation of an automated system for the detection of OSA using single-lead ECG measurements. The processing steps include detection of QRS complexes leading to an RR-interval data set and the calculation of an ECG-derived respiratory (EDR) signal. Using these RR-intervals and the EDR signal, features were constructed for each 1-min segment of recording. Using a variety of classifier techniques, each minute can then be assigned a probability of representing apnea or normal breathing, to produce a “Segment classification.” Combining these classifications over a longer period of time, results in a “Recording classification,” which can be used by a physician as a diagnostic measure.
[4], [5] to determine the efficacy of ECG-based methods for ap-noea detection using a large, well-characterized and representa-tive database. Computers in Cardiology is an annual IEEE-spon-sored conference. PhysioNet is a web-based library of physio-logic data and analytic software sponsored by the US National Institutes of Health’s National Center for Research Resources [6] and it provided free access to the database of ECGs.
Our group participated in the competition and arising from this work we have developed an automated system for detection of OSA using ECG measurements (Fig. 1). The system pro-vides two outputs. The first output is a minute-by-minute se-quence of classifications of “normal” or “apnoea.” The second output provides an overall summary of the presence of clini-cally significant apnoea and it is derived on the basis of the minute-by-minute annotation sequence.
This paper is organized as follows. Section II describes the database. Section III details the methodology of the paper in-cluding preprocessing of QRS data, derivation of an ECG-de-rived respiratory signal, choice of ECG feature sets, choice of classifier model and methods for improving classifier perfor-mance. In Section IV, we detail the results of our automated system. In Section V, a discussion of our results is presented and we draw some conclusions regarding the potential useful-ness of this system in Section VI.
II. DATABASE
The database was provided by the competition organizers [4], [7]. It contains 70 nighttime recordings of a single contin-uous ECG signal of approximately 8 hours duration. The ECG recordings were extracted from a larger database of simulta-neously recorded polysomnogram measurements provided by Philipps-University, Marburg, Germany. The ECG signal was sampled at 100 Hz, with 16-bit resolution, with one sample bit representing 5 V. The standard sleep laboratory ECG electrode positions were used (modified lead V2).
The database does not contain episodes of pure central apnoea or of Cheyne–Stokes respiration; all apnoeas in these
recordings are either obstructive or mixed. The subjects of these recordings were men and women between 27 and 63 years of age (mean: 43.8 10.8 years) with weights between 53 and 135 kg (mean: 86.3 22.2 kg). The sleep recordings originated from 32 subjects (25 men, 7 female) that were recruited for previous studies on healthy volunteers and patients with OSA. Four subjects contributed a single recording each, 22 subjects contributed two recordings each, two subjects contributed three recordings each and four subjects contributed four recordings each. The duration of the recordings varied between 401 and 578 min (mean: 492 32 min). The AHI ranges from 0 to 93.5 in these recordings. The initial scoring of apnoeas and hypopnoeas in the recordings was done according to standard criteria [1]. One expert rescored the database as follows: The polysomnogram recordings were divided into a set of 1-min segments. Each segment was annotated on the basis of respi-ration and oxygen saturespi-ration signals using amplitude criteria for airflow and desaturation and if at any time during that minute there was evidence of sleep apnoea the segment was classified as “apnoea;” otherwise it was classified as “normal.” The total number of recorded minutes classified in this manner was 34 313. This provided a minute-by-minute sequence of gold-standard annotations for the ECG recordings. Segments containing hypopnoeas (defined as intermittent drops in the volume of air entering the lungs on each breath below 50% of normal, accompanied by drops in oxygen saturation of at least 4% and followed by compensating hyperventilation) were also classed as apnoea.
In addition, each recording was screened for the presence of clinically significant apnoea and classified as “apnoea,” “bor-derline,” or “normal.” The assessment was made on the basis of the number of apnoeas and the apnoea index. The following criteria were used in classifying the recordings:
• Recordings classed as apnoea contained at least 60 min with an apnoea index of ten or more and at least 100 min with apnoea during the recording. There were 40 record-ings in this class.
99 min with apnoea during the recording. There were ten recordings in this class.
• Recordings classed as normal (or control) contained fewer than 5 min with apnoea during the recording. There were 20 recordings in this class.
The database was divided into two sets each containing 35 recordings. The first set (released-set) was used to develop our classification algorithms and the second set (withheld-set) was used by the competition organizers to provide an independent performance assessment. The recordings were split so each set had 20 apnoea, 5 borderline, and 10 normal recordings. The 1-min segments were almost equally balanced between the re-leased-set ( 17 045) and the withheld-set ( 17 268). Sev-enteen subjects contributed recordings to both the released and withheld-set. Eight subjects’ recordings were only in the with-held-set, while the recordings of the remaining seven subjects were in the released-set only.
III. METHODS
A. Classification Philosophy
Rather than trying to use our knowledge of the physiological underpinnings of OSA, we adopted a standard “black-box” pat-tern recognition approach using supervised learning. We con-sidered various representations of the ECG using different fea-tures. Previous studies had shown that features based on the timing of QRS complexes [8]–[11] and the amplitude of the ECG [12]–[14] might be useful for apnoea identification. Both types of features were considered for classification. Two dif-ferent classifier methods were explored and the classifier per-formance was optimized using the available ECG data and our selected features. The classifier methods used in this study were linear and quadratic discriminants [15].
B. QRS Detection
All the features used in this study required QRS detection times. A “QRS detection time” is loosely defined as the time of occurrence of the QRS complex in an ECG signal. QRS detec-tion times were generated automatically for all recordings using an algorithm described in [16]. This algorithm provides detec-tion times, which occur close to the onset of the QRS complex. A second set of QRS detections was formed after manual ver-ification and correction of the first set. The two sets were used separately to generate features to determine the importance of QRS detection on classification accuracy.
C. RR-Interval Correction
RR-intervals were defined as the interval between successive QRS detection points. Due to poor signal quality and errors in the automatically generated QRS detections, the RR-interval se-quences generated from both sets of QRS detection times con-tained physiologically unreasonable times. A first preprocessing step prior to calculating the ECG features was to calculate a corrected RR-interval sequence where all intervals were phys-iologically reasonable. The following automatic algorithm was developed for this purpose.
Suspect RR-intervals were found by applying a median filter of width five to the sequence of RR-intervals. This provided a robust estimate of the expected value for each RR-interval. Significant variations from this expected value led to it being flagged as a suspect RR-interval. Suspect RR-intervals could be due to either spurious QRS detections, or missed QRS complexes.
Spurious QRS detections were found by comparing the sum of adjacent RR-intervals with the robust RR-interval estimate. If this sum was numerically closer to the robust estimate than either of the individual RR-intervals then a spurious detection was deemed to be present. The two RR-intervals were merged to form a single RR-interval.
Conversely, we determined heuristically that if an RR-in-terval was a factor of 1.8 times or greater than the robust estimate then it was probable that one or more QRS complexes were missed. To estimate (interpolate) the times of the missing QRS complexes the RR-interval was divided by the sequence of integers 2, 3, 4, , until it best matched the robust estimate of the RR-interval. The single RR-interval was then subdivided by the appropriate integer to form a series of new detections.
D. ECG-Derived Respiratory Signal
During the breathing cycle, the body-surface ECG is influ-enced by electrode motion relative to the heart and by changes in thoracic electrical impedance as the lungs fill and empty with air. The effect is most obviously seen as a slow modulation of the ECG amplitude at the same frequency as the breathing cycle [12]–[14]. To access this signal the original ECG signal was fil-tered with two median filters to remove the baseline wander. The original ECG signal was processed with a median filter of 200-ms width to removed QRS complexes and P waves. The re-sulting signal was then processed with a median filter of 600-ms width to remove T waves. The signal resulting from the second filter operation contained the baseline of the ECG signal, which was then subtracted from the original signal to produce the base-line corrected ECG signal.
A sample point of an ECG-derived respiratory signal (EDR) was then obtained by calculating the area enclosed by the base-line corrected ECG in the region 100 ms beyond the QRS de-tection point.
E. Feature Sets
The processing steps outlined above resulted in discrete index sequences of the RR-intervals and the EDR signal. Based on these, a large set of features that could potentially be used for classification were considered. Since the database classifica-tions were provided for 1-min segments of data, features were generated for each of these 1-min segments. The features con-sidered in this study were as follows.
• mean RR-interval;
• standard deviation of the RR-interval;
• the first five serial correlation coefficients of the RR-inter-vals [17];
• the NN50 measure (variant 2), defined as the number of pairs of adjacent RR-intervals where the second RR-in-terval exceeds the first RR-inRR-in-terval by more than 50 ms; • two pNN50 measures, defined as each NN50 measure
di-vided by the total number of RR-intervals;
• the SDSD measures, defined as the standard deviation of the differences between adjacent RR-intervals;
• the RMSSD measure defined as the square root of the mean of the sum of the squares of differences between ad-jacent RR-intervals;
• the Allan factor evaluated at a time scale of 5, 10, 15, 20, and 25 s where the Allan factor is defined
as ,
is the number of QRS detection points occurring in a window of length stretching from to
and is the expectation operator [18];
• interval-based power spectral density (PSD) of the RR-in-tervals [19];
• mean EDR amplitude;
• standard deviation of the EDR amplitude; • the PSD of the EDR signal.
A useful summary of RR-interval based measures and their uses is contained in [20]. It is worth noting that none of the measures listed above consider the morphology of the ECG. It is implicitly assumed that the processes leading to apnoea occur at a location external to the heart and, thus, do not directly affect the generated cardiac potentials.
Since our results show that the interval-based RR-interval and the EDR PSDs are among the most useful features for classifi-cation, it is worth carefully defining how these quantities are calculated. The interval-based RR-interval PSD was calculated in the following way. A sequence of RR-intervals was asso-ciated with each 1-min segment. The index for this sequence was beat number, not time. The mean RR-interval for that seg-ment was removed from each value, to yield a zero-mean se-quence. The sequence was zero-padded to length 256 and the fast Fourier transform (FFT) was taken of the entire sequence. The magnitudes of the FFT coefficients were squared to yield a periodogram estimate of the PSD, which had high variance. Av-eraging of four adjacent frequency bins yielded a 64-point PSD estimate of which only the first 32 points were used as features (due to the symmetry of the upper and lower PSD point esti-mates). The axis has units of cycles/interval. The EDR PSD was calculated in an identical fashion, with the spectral variable also defined as cycles/interval.
The features have been divided into labeled sets. The RR set contains 52 features derived from the RR-intervals com-prising the following: 32 features from the interval-based PSD, the mean and standard deviation of the RR-intervals per seg-ment, the mean and standard deviation of the RR-intervals per recording, the first five serial correlation coefficients, one SDSD feature, one RMSSD feature, two NN50 features, two pNN50 features and five Allan variance measures calculated at different time scales. The EDR set contains 36 features derived from the EDR signal. The PSD provided 32 features, two features were the mean and standard deviation of the EDR areas per segment and two features were the mean and standard deviation of the
EDR areas per recording. Both of these sets were combined to
form the set.
F. Classifier Models
A supervised training technique was used to derive all classi-fiers [21]. In this study, linear discriminant (LD) and quadratic discriminant (QD) models were considered. Optimization of both models was achieved by the method of maximum likeli-hood (ML). Both models provide a posterior probability esti-mate of each class. A final classification is obtained by choosing the class with the highest posterior probability estimate.
Training of the LD and QD classifiers using “plug-in” ML es-timates of classifier parameters proceeded as follows [21]. Let be a column vector containing feature values. Assume that we wish to assign to one of possible classes. A total of fea-ture vectors are available for training the classifier. The number of feature vectors available for training for class is and, hence
(1)
The th feature vector for training in class is designated as . Training of both models involves determining the class-conditional mean vectors using
(2)
For an LD classifier the common covariance matrix is cal-culated using
(3)
For a QD classifier the class-conditional covariance matrices, , are calculated using
(4)
To classify a feature vector , values are assumed for the prior probabilities and the discriminant value for each class is calculated using
(5)
for LD classifiers and
(6)
for QD classifiers.
In this paper, the estimated posterior probabilities, , are used. They are easily calculated from the discriminant values using
(7)
G. Transformations
The classifier models considered in this study implicitly assume that the feature data have a class-dependent Gaussian distribution. Classifier performance will be degraded when the actual feature statistics differ significantly from this as-sumption. Therefore, where appropriate, a transformation was applied to the features so that the histogram of the transformed feature more closely approximated a Guassian distribution. A logarithmic transform was applied to all standard deviation, PSD, RMSSD, and SDSD features. A square-root transform was applied to the Allan variance features.
H. Classification Performance Estimation
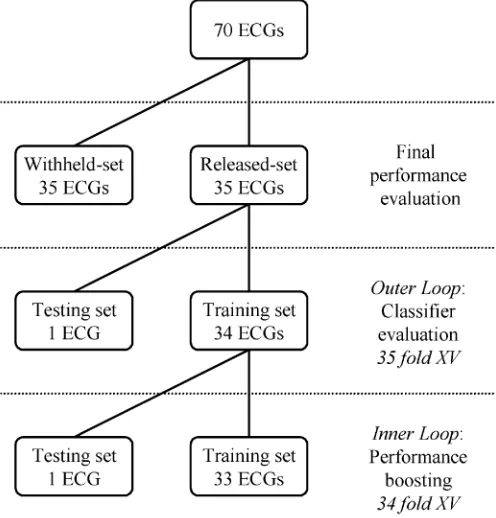
Classifier performance has been estimated using two methods in this paper. In the first method, the cross-validation scheme [21], [22] was applied to the 35 recordings in the released-set. This data was divided into 35 folds with each fold containing the data from one recording. This method was used to assess the performance of different candidate classifiers and identify the best performing classifiers for a second performance estimation. The second method of performance estimation was to process the 35 recordings in the withheld-set and submit the annotations to the competition organizers for assessment. They responded with a single figure representing the total number of correct clas-sifications. Fig. 2 shows how the data was divided in this study into separate sets for performance assessment.
In this study, we considered the overall classification accu-racy, sensitivity and specificity defined as follows. The overall accuracy is the percentage of total segments correctly classified. The sensitivity is the percentage of apnoea segments correctly classified and the specificity is the percentage of normal seg-ments correctly classified.
I. Improving the Classifier Performance
The performance of most classifier training algorithms is de-graded when there are too many parameters of the classifier to be estimated relative to the size of the training data. This occurs be-cause of the so-called “curse of dimensionality” [23] which, ap-plied to classification problems, refers to the exponential growth of training data required to successfully train a classifier with the number of classifier parameters. In these cases, techniques are available that may improve classification performance. Two techniques applicable to LD and QD classifiers were used in this study. The first was to use feature selection to find a subset of the available features with good classification performance for the classifier model used. The second method was to regularize the covariance matrices.
[image:5.612.305.553.65.324.2]When attempting to improve the classifier performance two nested loops of cross-validation were used to obtain unbiased estimates of classifier performance (see Fig. 2). The inner loop was used to measure the accuracy of the different classifier con-figurations. Although these performance figures used test-set values, these values are optimistically biased as they were used during the configuration selection process.
Fig. 2. Division of the data into training and testing sets for performance boosting and classifier evaluation using the cross-validation scheme. Final performance evaluation is performed on an independent set (the withheld-set).
The outer cross-validation loop was used to test the classifier configuration that was selected by the inner loop. As before, the outer loop used 35-fold cross-validation. The inner-loop of cross-validation further divided the 34 recordings available for training from the outer loop into 34 folds each containing data from one subject.
1) Feature Selection: Given a set of features it is often pos-sible to find a subset with better classification performance than the full set of features. However, the interaction of features is difficult to determine so, in general, the only way to optimize the classification performance of a set of features is to deter-mine the performance of all possible subsets and choose the best performing subset. This approach is often computationally in-tractable as feature sets of size generate subsets. To ease the computational burden, a heuristic search is used to search the feature set space so that subsets with probable good perfor-mance are evaluated first. The simplest procedures are the step-wise searches [24] but they are not guaranteed to find the op-timal subset. In this paper, the best-first search procedure [22] has been used, which, although slightly more complicated than the stepwise searches will (eventually) find the optimal subset.
2) Regularizing the Covariance Matrices: For an LD classi-fier the covariance matrix may be “shrunk” toward the identity matrix using [21]
with (8)
Fig. 3. An example of RR-intervals calculated from the (a) uncorrected and (b) corrected automatically determined QRS detection times for the first to second hour of recording 2 of the released-set.
and a special case occurs in which the features are assumed to be statistically independent (and, hence, have no covariance).
For the QD classifier each covariance matrix can be “shrunk” toward the common covariance matrix [21] using
with (9)
and substitute these new matrices in for the in (6). When then a LD classifier results as all . In prac-tice, for both LD and QD classifiers, various values of in the range 0 to 1 can be evaluated and the classifier performance de-termined. A value of that optimizes classifier performance can then be chosen.
J. The Temporal Relationship of Segments
Observation of sequences of the minute-by-minute classifica-tions revealed that there was a temporal association of the clas-sifications. For example, if the 11th–13th 1-min segments were classed as normal, then there was a high probability that 10th and 14th 1-min segments were also classed as normal. In light of this observation, two techniques were found to boost classifi-cation performance. The first was to average the posterior prob-abilities calculated for a segment with the posterior probprob-abilities obtained from chronologically close segments. The second was to average the input features of a segment with the input features from chronologically close segments.
K. Overall Screening For Clinically Significant Apnoea
The screening for clinically significant apnoea for each recording was achieved by calculating the average number of minutes per hour (min/h) spent in apnoea from the minute-by-minute classifications. A threshold value was determined to best separate the normal and apnoea recordings.
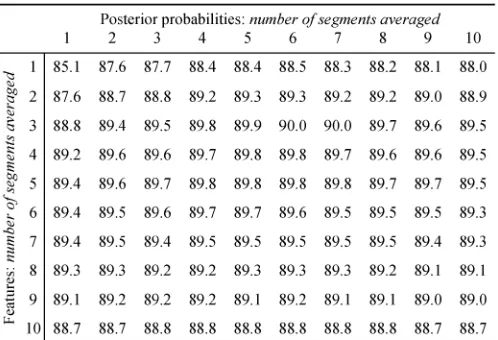
TABLE I
THECLASSIFICATIONACCURACY(%)FORDIFFERENTLEVELS OFTEMPORAL
INPUTFEATURE ANDPOSTERIORPROBABILITYAVERAGING
IV. RESULTS
A. QRS Detections and RR-Interval Correction
The two sets of QRS detection times were compared to de-termine the accuracy of the automatically generated set. If an automatically generated QRS detection time was within 100 ms of a manually verified QRS detection time it was regarded as correct. Using this method, 98.6% of the automatically gener-ated QRS detections were correct.
Fig. 3(a) shows the RR-intervals calculated from the automat-ically generated QRS detections determined from a very noisy recording. Fig. 3(b) shows the same recording after RR-interval correction. A visual inspection of the RR-intervals associated with the corrected QRS detections for all recordings showed a significant reduction in the number of physiologically unreason-able RR-intervals.
B. Classifier Performance Measured Using the Released-Set
There were 17 045 segments in the released-set with 10 531 (61.78%) labeled normal and 6514 (38.22%) labeled apnoea. All results in this section were calculated using the cross-valida-tion scheme. Features were derived from the manually verified QRS detection times.
1) Temporal Averaging: Different length equally weighted temporally averaging filters were applied to the input features and posterior probabilities and the effect on classification per-formance observed. All input features and the LD classifier were used. The filter length was varied between one and ten segments and the results are shown Table I. The accuracy was maximized when using temporal averaging of three segments of features and six segments of posterior probabilities. The temporal aver-aging was set at these values for the rest of the study.
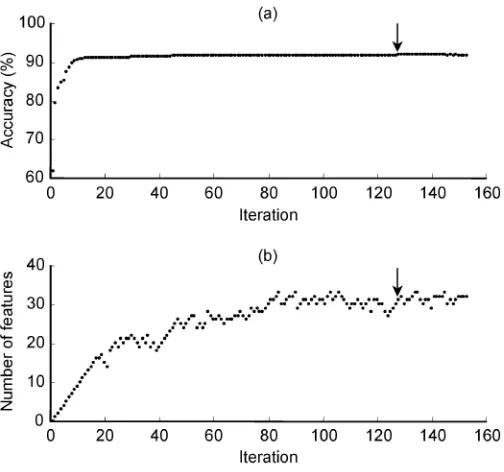
Fig. 4. Best-first search algorithm applied to feature selection using the LD classifier with theRR + EDR set using the 35 ECG recordings of the released-set. (a) Accuracy of the best performing features set versus iteration number. (b) Number of features in the chosen subset. The search algorithm was terminated after 25 consecutive iterations with no improvement in accuracy. The point of maximum classification accuracy is shown with an arrow.
terminated after 25 iterations with no improvement in accuracy. The starting point was the empty feature set. Fig. 4(a) shows an example plot of the accuracy of the best set at each iteration step and Fig. 4(b) shows the number of features in the best set. Note that the values in the third column of Table II(b) are noninteger as each is the average of individual results from the different data splits of the cross-validation process. Table II(c) shows the classification results obtained through regularization of the co-variance matrices.
C. Classifier Performance Measured On the Withheld-Set
The assessment of classifier performance on the withheld-set was provided by the competition organizers and contains only overall accuracy assessments (i.e., breakdown by sensitivity and specificity is not known).
The best performing classifiers (as measured with cross-vali-dation on the released-set) were retrained using all recordings of the released-set and then tested using all recordings of the with-held-set. Four classifiers were validated [see Table III(a)] and all processed the set. The features for the first three classifiers were calculated using the manually verified QRS de-tection times. These classifiers were the best performing stan-dard classifier (an LD classifier), the best performing classifier after feature selection (an LD classifier) and the best classifier after regularization of the covariance matrices (a QD classifier). The fourth classifier was the best of the above three classifiers (as measured on the withheld-set) retrained using features cal-culated using the automatically generated QRS detection times. This last classifier is a fully automatic system.
D. Automatic Screening of Recordings For the Presence of Clinically Significant Sleep Apnoea
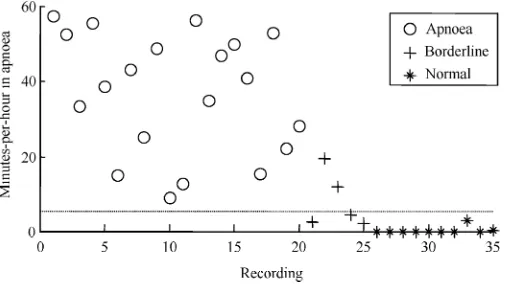
Using the fully automatic system described above the number of minutes per hour spent in apnoea calculations were generated for the released-set. Fig. 5 shows the results of these calcula-tions. A threshold of 5 min/h, allows complete separation of the subjects classed as “normal” from those classed as “apnoea.” Table III(b) presents the classification results on the released-and withheld-sets for discriminating between normal released-and ap-noea subjects using the above threshold value. The withheld-set accuracy assessment was provided by competition organizers.
E. PSD Features
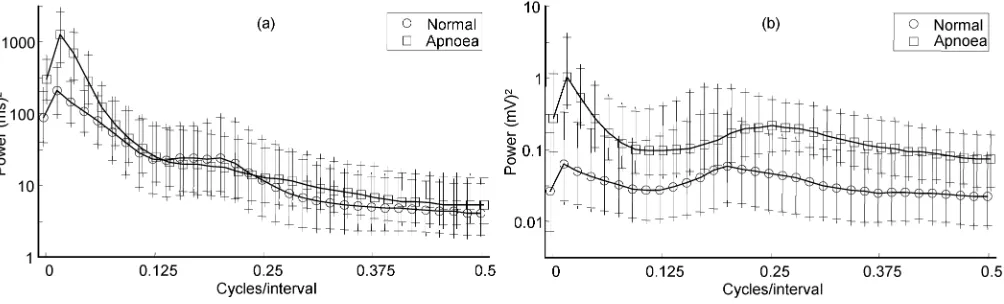
The PSD features made up the majority of our features and contributed significantly to the overall classification perfor-mance of our system. Fig. 6(a) shows the class-dependent PSD values of the RR signals over the normal and apnoea segments of the released-set. For each frequency bin the median value is shown along with vertical bars indicating the range of the 25%–75% values. As both spectra have a log-normal amplitude distribution a log scale has been used on the axis. Fig. 6(b) shows the class-dependent PSDs of the EDR signal. Again a log scale has been used on the axis.
V. DISCUSSION
A. Released-Set
In the following, all the performance figures discussed are the test-set figures from Tables I and II.
1) Temporal Averaging: Temporal averaging significantly boosted the classification performance. Using no temporal averaging, the classification accuracy was 85.1%. Introducing temporal averaging of the posterior probabilities resulted in a maximum accuracy of 88.5% and occurred when six segments were averaged. Temporal averaging of features produced a maximum accuracy of 89.4% and occurred when averaging six segments. The maximum accuracy of 90.0% occurred when using both types of temporal averaging simultaneously. It occurred when features were averaged over three segments and posterior probabilities were averaged over six segments.
2) Feature Selection and Covariance Regularization: The results in Table II(b) and (c) show feature selection and covari-ance regularization slightly reduced the classification accuracy of the best performing standard classifier. The best overall ac-curacy (90.0%) was the standard LD classifier processing the set. The sensitivity was 86.4% and the specificity was 92.3%. Feature selection applied to this classifier reduced the average number of features selected to 27.0 and the overall accuracy to 89.5%. When covariance regularization was applied the overall accuracy was 89.8%.
TABLE II
CLASSIFICATIONPERFORMANCE ON THERELEASED-SET FOR THELDANDQD CLASSIFIERSAFTER
(A) NOOPTIMISATION, (B) FEATURESELECTION,AND(C) COVARIANCEREGULARISATION
TABLE III
CLASSIFICATIONPERFORMANCE ON THERELEASED-SET ANDWITHHELD-SET OF THE(A) BESTPERFORMING
MINUTE-BY-MINUTECLASSIFIERS AND(B) SCREENINGCLASSIFIER
EDR set required an average of just 9.7 features and the RR set required an average of 23.1 features.
Feature selection applied to the QD classifier improved the performance of all feature sets relative to the standard QD clas-sifier. The highest gain was for the RR set where the accuracy increased by 5.9% to 86.1%. The average number of features chosen with the QD classifier was lower than for the LD clas-sifier for the RR (18.4) and (22.7) sets, whereas the EDR set alone required more features than the LD classifier. The QD classifier has more parameters to be estimated than the LD classifier for a given feature set size. Therefore, for a fixed size training set and feature set, the QD classifier can use fewer features than the LD classifier before the “curse of dimension-ality” becomes a problem.
For the LD classifier, regularization of the common covari-ance matrix led to optimal regularization parameters between 0.00 and 0.06, i.e., the regularized covariance matrices in all cases were very similar to the common covariance matrices from the unregularized LD classifier. For all feature sets, co-variance regularization made little difference to the classifica-tion performance relative to the unregularized LD classifier. The biggest change was a reduction in performance of 0.2% for the
set.
Fig. 5. The number of minutes per hour spent in apnoea as estimated by the regularized QD classifier processing all features for all recordings of the released-set. Applying a threshold of 5 min/h (as shown by the dotted line) completely separates the normal and apnoea records.
These results obtained here demonstrate that feature selec-tion and covariance regularizaselec-tion can lead to an improvement in classification performance. Although they introduced a signif-icant amount of extra numerical processing during the training of a classifier, we believe these methods are worth investigating. 3) Comparison of Feature Sets: Covariance regularization of the QD classifier resulted in the overall best performing clas-sifier for both the RR and EDR sets. The overall accuracy figure for both these feature sets was 86.3%. It is a coincidence that these two feature sets resulted in the same overall performance as both feature sets provide separate diagnostic information for detection of apneas. The RR set provides information on heart-beat timing whereas the EDR set provides information on chest wall movement. The combined set feature results in better classification performance than either set alone, sug-gesting that the RR and EDR sets provide independent classifi-cation information.
From a practical viewpoint, the result for the RR set is sig-nificant as it shows that by considering interbeat timing infor-mation alone, a classification rate of over 85% is achievable. Deriving interbeat timing intervals from an ECG is computa-tionally straightforward, relatively insensitive to electrode posi-tioning and amenable to real-time processing.
B. Withheld-Set
The independent validation of performance of the best three performing classifiers on the withheld-set resulted in similar accuracy figures to those determined on the released-set. The best accuracy result of 90.6% was from the QD classifier pro-cessing all features with regularized covariance matrices. The regularizing parameter was 0.85 so the common covariance ma-trix heavily weighted the covariance matrices. Feature selection reduced the set to 31 features and resulted in the simplest classifier. The overall accuracy was 90.5%. The overall accuracy of the standard LD classifier was 90.4%.
When the QD classifier processing all features with regu-larized covariance matrices was retrained using the features derived from the automatically generated QRS detection times the withheld-set accuracy was 90.5%. The significance of this result is that it estimates the performance of a fully automatic system for minute-by-minute identification of disordered breathing. This result also demonstrates that the method
presented here is insensitive to imperfect QRS detection times as using the automatically generated QRS detection points in place of the manually verified QRS detection points has resulted in 0.1% decrease in overall accuracy. It is worth noting that other QRS detection schemes exist (e.g., [25]–[27]) that claim to provide better detection performance than the 98.6% we obtained with our QRS detector, although our results suggest that these improved QRS detector schemes would make little difference to the classification performance.
C. Screening
The 30 nonborderline recordings in the withheld-set were all successfully classified by our system. This is a significant re-sult. Using only the ECG, the method presented here has suc-cessfully distinguished between subjects with no apnoea and subjects with clinically significant apnoea. This result suggests that adoption of ECG-based diagnostic tests for OSA such as proposed here could lead to a significant simplification of the process of screening for OSA.
However, when using the minutes per hour in apnoea calcu-lation it was not possible to additionally provide perfect sepa-ration of the class labeled “borderline,” although Fig. 5 shows it is apparent that the borderline recordings do mostly lie in the region between the “apnoea” and “normal” recordings.
D. PSD Plots
With reference to Fig. 6(a) the median values of all frequen-cies of the two RR spectra are very similar, except for the fre-quency range 0–0.06 cycles/interval. In this range, there is more power in the PSD of the apnoea segments than in the PSD of the normal segments and the two spectra show a reduced amount of overlap of the 25%–75% ranges. There is a small peak at 0.2 cycles/interval of the normal segment PSD which probably cor-responds to the average breathing frequency. The apnoea spec-trum does not show the same peak.
The median values of the EDR spectrum of the apnoea seg-ments shown in Fig. 6(b) have more power at every frequency than the normal segments. The significance of this is that the EDR signal has, on average, higher variance from the apnoea segments than normal segments. Inspection of the 25%–75% values shows that there is a significant amount of overlap of the two spectra for the frequency range 0.06–0.5 cycles/interval. The 25%–75% values for the frequency range 0–0.06 cycles/in-terval shows a reduced amount of overlap. There are small peaks in both spectra, probably associated with average breathing fre-quency. They occur at 0.2 cycles/interval for the normal seg-ments and 0.25 cycles/interval for the apnoea segseg-ments.
These results suggests that most of the information in the ECG relating to the presence of sleep apnoea is found at rel-atively low frequencies (i.e, less than 0.06 cycles/interval), cor-responding approximately to time-scales on the order of 10–15 s or longer. Since apnoea and hypopnoea events by definition last for longer than 10 s, it is not surprising that the effect of apnoea is observed at these low frequencies.
VI. CONCLUSION
Fig. 6. (a) Median PSD derived from the RR-intervals of the normal and apnoea 1-min segments over the 35 ECG recordings of the released-set. Along they axis, a log scale is used and the median and 25%–75% of the power is shown for each frequency bin. Along thex axis the frequency bins of the apnoea data are offset by 0.004 cycles/interval to facilitate comparison with the frequency bins of the normal data. (b) Median PSD derived from the EDR for the normal and apnoea 1-min segments over the 35 ECG recordings of the released-set. As in (a), a log scale is used on they axis, the mean and 25%–75% of the power is shown for each frequency bin and the frequency bins of the apnoea data are offset by 0.004 cycles/interval to facilitate comparison.
analysis of disordered breathing. Classifiers based on linear and quadratic discriminants were used. Classifier performance was optimized by considering feature selection and regularization of classifier parameters. Both the time of occurrence of the QRS complex and the EDR were found to be useful features for classification.
Independent testing has shown that the method separated the normal recordings from the apnoea recordings with a 100% suc-cess rate and achieved a minute-by-minute classification rate of over 90%. By considering features based only on RR-intervals a minute-by-minute classification rate of over 85% is achievable. The final structure for the proposed classifier is computationally efficient and lends itself to real-time implementation.
The method was shown to be insensitive to imperfect QRS de-tections. The difference in the minute-by-minute classification accuracy when using manually verified QRS detection points compared to automatically generated QRS detection points was 0.1%.
The significance of this study is that it provides a simple scheme for diagnosis of OSA, yet its overall diagnostic accu-racy is comparable with full polysomnography. ECG-based diagnostic tests for sleep apnoea are ideally suited to Holter monitors as no additional hardware is required. Ideally, Holter recordings would be routinely screened for apnoea and this may allow a significant reduction in the costs associated with the detection of OSA. This would be a step toward addressing the serious public health issue caused by under-diagnosis of OSA.
ACKNOWLEDGMENT
The authors would like to thank G. Moody and T. Penzel for organizing the Computers in Cardiology 2000 Challenge. They would also like to acknowledge the work of T. Penzel and L. Grote in collating and scoring the database used in this study. They thank J. McNames, G. Moody, A. Murray, T. Penzel, and B. Raymond for interesting discussion on the results of this study. The authors are also grateful to M. C. Teich of Boston University for first bringing this topic to their attention. Finally, they are grateful for the support of the Conway Institute of Biomolecular and Biomedical Research, University College Dublin.
REFERENCES
[1] Amer. Acad. Sleep Med. Task Force, “Sleep-related breathing disorders in adults: Recommendations for syndrome definition and measurement techniques in clinical research,” Sleep, vol. 22, no. 5, pp. 667–689, Aug. 1999.
[2] C. W. Whitney, D. J. Gottlieb, S. Redline, R. G. Norman, R. R. Dodge, E. Shahar, S. Surovec, and F. J. Nieto, “Reliability of scoring respira-tory disturbance indices and sleep staging,” Sleep, vol. 21, pp. 749–757, 1998.
[3] T. Young, L. Evans, L. Finn, and M. Palta, “Estimation of the clinically diagnosed proportion of sleep apnea syndrome in middle-aged men and women,” Sleep, vol. 20, pp. 705–706, 1997.
[4] T. Penzel, “The apnea-ECG database,” in Computers in Cardi-ology. Piscataway, NJ: IEEE Press, 2000, vol. 27, pp. 255–258. [5] G. B. Moody, R. G. Mark, A. L. Goldberger, and T. Penzel, “Stimulating
rapid research advances via focused competition: The computers in car-diology challenge 2000,” in Computers in Carcar-diology. Piscataway, NJ: IEEE Press, 2000, vol. 27, pp. 207–210.
[6] A. L. Goldberger, A. N. Amaral, L. Glass, J. M. Hausdorff, P. C. Ivanov, R. G. Mark, J. E. Mietus, G. B. Moody, C. K. Peng, and H. E. Stanley, “Physiobank, physiotoolkit and physionet,” Circulation, vol. 101, pp. e215–e220, 2000.
[7] T. Penzel, J. McNames, P. de Chazal, B. Raymond, A. Murray, and G. Moody, “Systematic comparison of different algorithms for apnoea de-tection based on ECG recordings,” Med Biol Eng Comp, vol. 40, pp. 402–407, 2002.
[8] C. Guilleminault, S. J. Connolly, R. Winkle, K. Melvin, and A. Tilkian, “Cyclical variation of the heart rate in sleep apnoea syndrome. Mech-anisms and usefulness of 24h electrocardiography as a screening tech-nique,” Lancet, vol. I, pp. 126–131, Jan. 1984.
[9] T. Penzel, G. Amend, K. Meinzer, J. H. Peter, and P. von Wichert, “Mesam: A heart rate and snoring recorder for detection of obstructive sleep apnea,” Sleep, vol. 13, pp. 175–182, 1990.
[10] M. F. Hilton, R. A. Bates, K. R. Godfrey, M. J. Chappell, and R. M. Cayton, “Evaluation of frequency and time-frequency spectral analysis of heart rate variability as a diagnostic marker of the sleep apnoea syn-drome,” Med. Biol. Eng. Comput., vol. 37, no. 6, pp. 760–769, 1999. [11] F. Roche, J. M. Gaspoz, I. Court-Fortune, P. Minini, V. Pichot, D.
Du-verney, F. Costes, J. R. Lacour, and J. C. Barthelemy, “Screening of ob-structive sleep apnea syndrome by heart rate variability analysis,” Cir-culation, vol. 100, no. 13, pp. 1411–1415, 1999.
[12] G. B. Moody, R. G. Mark, A. Zoccola, and S. Mantero, “Derivation of respiratory signals from multi-lead ECG’s,” in Computers in Car-diology. Los Alamitos, CA: IEEE Computer Society Press, 1985, vol. 12, pp. 113–116.
[13] , “Clinical validation of the ECG-derived respiration (EDR) tech-nique,” in Computers in Cardiology. Los Alamitos, CA: IEEE Com-puter Society Press, 1986, vol. 13, pp. 507–510.
[14] A. Travaglini, C. Lamberti, J. DeBie, and M. Ferri, “Respiratory signal derived from eight-lead ECG,” in Computers in Cardi-ology. Piscataway, NJ: IEEE Press, 1998, vol. 25, pp. 65–68. [15] R. O. Duda, P. E. Hart, and D. G. Stork, Pattern Classification. New
[16] W. A. H. Engelse and C. Zeelenberg, “A single scan algorithm for QRS-detection and feature extraction,” in Computers in Cardiology. Los Alamitos, CA: IEEE Computer Society Press, 1979, vol. 6, pp. 37–42. [17] A. Ambardar, Analog and Digital Signal Processing. Boston, MA:
PWS, 1995.
[18] M. C. Teich, S. B. Lowen, B. M. Jost, K. Vibe-Rheymer, and C. Heneghan, “Heart rate variability: Measures and models,” in Nonlinear Biomedical Signal Processing, M. Akay, Ed. Piscataway, NJ: IEEE Press, 2000, vol. II.
[19] R. W. DeBoer, J. M. Karemaker, and J. Strackee, “Comparing spectra of a series of point events particularly for heart rate variability data,” IEEE Trans. Biomed. Eng., vol. BME-31, pp. 384–387, 1984.
[20] Task Force Eur. Soc. Cardiol. and North Amer. Soc. Pacing and Electrophysiology, “Heart rate variability—Standards of measurement, physiological interpretation and clinical use,” Eur. Heart J., vol. 17, pp. 354–382, 1996.
[21] B. D. Ripley, Pattern Recognition and Neural Networks. Cambridge, U.K.: Cambridge Univ. Press, 1996.
[22] R. Kohavi, “A study of cross validation and bootstrap for accuracy es-timation and model selection,” in Proc. 14th Int. Joint Conf. Artificial Intelligence, 1995, pp. 1137–1143.
[23] C. M. Bishop, Neural Networks for Pattern Recognition. New York: Oxford Univ. Press, 1995.
[24] S. Theodoridis and K. Koutroumbas, Pattern Recognition. San Diego, CA: Academic, 1999.
[25] V. X. Afonso, W. J. Tompkins, T. Q. Nguyen, and S. Luo, “ECG beat detection using filter banks,” IEEE Trans. Biomed. Eng., vol. 46, pp. 556–564, Feb. 1999.
[26] S. Kadambe, R. Murray, and G. F. Boudreaux-Bartels, “Wavelet trans-formed-based QRS complex detector,” IEEE Trans. Biomed. Eng., vol. 46, pp. 838–848, July 1999.
[27] C. Li, C. Zheung, and C. Tai, “Detection of ECG characteristic points using wavelet points,” IEEE Trans. Biomed. Eng., vol. 42, pp. 21–28, Jan. 1995.
Philip de Chazal (M’94) received the B.E. degree in electronic engineering, and the M.Biomed.E and Ph.D. degrees in biomedical engineering from the University of New South Wales, Sydney, Australia, in 1989, 1995, and 1999, respectively.
He was a Research Scientist with the Ultrasonics Laboratory, CSIRO, Sydney, from 1990 to 1992, and a Biomedical Engineer with MedCare Systems, Sydney, from 1993 to 1999. Since June 1999, he has been with the University College Dublin. He spent one year as a Postdoctoral Scholar with the Conway Institute of Biomolecular and Biomedical Research and now works as a Research Fellow for the Department of Electronic and Electrical Engineering. His research interests include signal processing and pattern recognition for biomedical applications and image processing for multimodal applications.
Dr. de Chazal received an award at the Computers in Cardiology 2000 conference for the work described in this paper. He is a member of the IEEE Engineering in Medicine and Biology Society. He is a reviewer for IEEE TRANSACTIONS ONMULTIMEDIA.
Conor Heneghan (M’90) was born in Dublin, Ire-land, in 1968 and received the B.E. degree in elec-tronic engineering from University College Dublin, in 1990 and the Ph.D. degree in electrical engineering from Columbia University, New York, NY, in 1995.
He is currently a Senior Lecturer in the Department of Electronic and Electrical Engineering at Univer-sity College Dublin. He was previously Director of Tele-Informatics at the New York Eye and Ear Infir-mary and a Postdoctoral Research Scientist at Boston University, Boston, MA. His research interests include signal and image pro-cessing for biomedical applications and signal propro-cessing for communications. Dr. Heneghan is also a member of the Institution of Electrical Engineers (IEE) and the Institution of Engineers of Ireland (IEI). He is a member of the IEEE Engineering in Medicine and Biology Society, the Signal Processing Society, and the Communications Society. He is a reviewer for IEEE TRANSACTIONS ON
BIOMEDICALENGINEERINGand IEEE TRANSACTIONS ONSIGNALPROCESSING.
Elaine Sheridan received the B.E. and M.Eng.Sc. degrees in electronic engineering from the National University of Ireland, Dublin, in 1999 and 2001, respectively.
She is currently a Design Engineer with Motorola SPS, Cork, Ireland. Her research interests include biomedical engineering, signal processing, and communication systems.
Richard Reilly (M’92) received the B.E., M.Eng.Sc., and Ph.D. degrees from the National University of Ireland in 1987, 1989, and 1992, all in electronic engineering.
In 1988, he joined Space Technology Ireland and the Dept. de Recherche Spatiale (CNRS group) in Paris, France, developing DSP-based on-board experimentation for the NASA satellites. In 1990, he joined the National Rehabilitation Hospital, Dublin, Ireland, and in 1992 became a Postdoctoral Research Fellow at University College Dublin, focusing on signal processing for speech and gesture recognition. Since 1996, Dr. Reilly has been on the academic staff in the Department of Electronic and Electrical Engineering at University College, Dublin. He is currently Senior Lecturer and researches into neurological signal processing and multimodal signal processing.
Philip Nolan received the B.Sc. Degree (with honors) in physiology and the primary medical degree (M.B., B.Ch., B.A.O.), from University Col-lege, Dublin, Ireland, in 1998 and 1991, respectively. He held the posts of Health Research Board Fellow (1992–1994) and Newman Scholar (1994–1996) at University College Dublin before being appointed Lecturer in Physiology in 1996. He is currently Senior Lecturer in Physiology at University College Dublin. His major research interest is in the phys-iological control of breathing and the circulatory system, with a particular interest in the neural control and physiological properties of upper airway muscles, their role in preventing upper airway obstruction during sleep, and the pathophysiology of the obstructive sleep apnoea syndrome.
Mark O’Malley (M’86–SM’96) was born in Dublin, Ireland, in 1962, he received the B.E. and Ph.D. degrees from the National University of Ireland, Dublin, in 1983 and 1987, respectively.