Costs of Doing Business in
Ireland 2017
Introduction to the National Competitiveness Council
The National Competitiveness Council (NCC) reports to the Taoiseach and the Government, through the Minister for Jobs, Enterprise and Innovation on key competitiveness issues facing the Irish economy and offers recommendations on policy actions required to enhance Ireland’s competitive position. Each year the NCC publishes two annual reports:
Ireland’s Competitiveness Scorecard provides a comprehensive statistical assessment of Ireland's
competitiveness performance; and
Ireland’s Competitiveness Challenge uses this information along with the latest research to outline the
main challenges to Ireland’s competitiveness and the policy responses required to meet them.
As part of its work, the NCC also:
Publishes the Costs of Doing Business where key business costs in Ireland are benchmarked against costs
in competitor countries; and
Provides an annual Submission to the Action Plan for Jobs and other papers on specific competitiveness
issues.
National Competitiveness Council Members
Professor Peter Clinch Chair, National Competitiveness Council
Pat Beirne Chief Executive Officer, Mergon Group
Kevin Callinan Deputy General Secretary, IMPACT Trade Union
Micheál Collins Assistant Professor of Social Policy, University College Dublin
Isolde Goggin Chair, Competition and Consumer Protection Commission
Cathríona Hallahan CEO/Managing Director (Ireland), Microsoft
Declan Hughes Assistant Secretary, Department of Jobs, Enterprise and Innovation
Jane Magnier Joint Managing Director, Abbey Tours
Danny McCoy Chief Executive Officer, Ibec
Seán O'Driscoll President, Glen Dimplex Group
Margot Slattery Country President, Sodexo Ireland
Martin Shanahan Chief Executive, IDA Ireland
Julie Sinnamon Chief Executive, Enterprise Ireland
Ian Talbot Chief Executive, Chambers Ireland
Patrick Walsh Managing Director, Dogpatch Labs
Jim Woulfe Chief Executive, Dairygold Co-Operative Society Limited
Council Advisers
Patricia Cronin Department of Communications, Climate Action and Environment
Kathleen Gavin Department of Education and Skills
John McCarthy Department of Finance
Conan McKenna Department of Justice and Equality
David Moloney Department of Public Expenditure and Reform
Ray O’Leary Department of Transport, Tourism, and Sport
John Shaw Department of the Taoiseach
Kevin Smyth Department of Agriculture, Food and the Marine
David Walsh Department of Housing, Planning, Community and Local Government
Research, Analysis and Administration
Marie Bourke Department of Jobs, Enterprise and Innovation
Eoin Cuddihy 23 Kildare Street, Dublin 2, D02 TD30
John Maher Tel: 01 6312862
Table of Contents
Executive Summary 5
Chapter 1 –Introduction and Methodology 12
Chapter 2 – How Do Costs Impact on Enterprise? 14
Chapter 3– How Does Ireland Perform? 21
Chapter 4 – Labour Costs 27
Chapter 5 – Property Costs 35
Chapter 6 – Transport Costs 40
Chapter 7 – Utility Costs 43
Chapter 8 – Credit and Financial Costs 48
Chapter 9 – Business Services and Other Input Costs 51
Executive Summary
National Competitiveness
National competitiveness is a broad concept that encompasses a diverse range of factors, essential conditions and policy inputs including education and training, innovation, clusters and firm sophistication, Ireland’s economic and technological infrastructure, and the business environment (which includes entrepreneurship, taxation and the regulatory framework). The National Competitiveness Council defines competitiveness as the ability of firms based in Ireland to compete in international markets. Competitiveness is not an end in itself, but is a means of achieving sustainable improvements in living standards and quality of life. Only by ensuring that firms based in Ireland can compete successfully here and abroad can we create the employment, income and wealth necessary to improve the lives of all of our citizens.
Cost Competitiveness
In terms of business costs, as a small open economy, dependent on exports and foreign investment as major drivers of growth, our relative cost competitiveness is a significant determinant of our overall competitiveness, and ultimately of our economic prosperity, employment and our standard of living. High business costs make Ireland less attractive for mobile inward investment and reduce the competitiveness of Irish enterprises’ goods and services trading in both domestic and international markets. More broadly, a more competitive cost base can help to create a virtuous circle between inflation, wage expectations and cost competitiveness.
The Cost of Doing Business 2017 report focuses on those costs which affect business most and concentrates on costs that are largely domestically determined. It specifically focuses on Irish enterprise costs that are out of line with those in key competitor countries .The analysis and data reported are subject to availability. Based
on the summary cost profiles considered in Chapter 2, it is clear that the cost of labour is the most significant
driver of business costs for most firms – particularly for services firms. Since labour costs are generally the most significant cost component for most firms, the relationship between labour costs and consumer prices is a major determinant of Ireland’s overall cost competitiveness. Overall labour cost growth has remained modest in recent years and well below the growth experienced in both the UK and the EU28. However, this masks considerable divergence at sectoral level. As the labour market tightens further, upward pressures on labour costs can expect to increase. These will vary between sectors and be dependent on the supply and demand for labour.
From an enterprise perspective, it is important that the taxation system is balanced, broad and provides
certainty in a manner that supports and rewards employment. The Irish income tax system is the most
progressive in the EU. Ireland’s highest rate of income tax starts to apply at just below the average industrial wage; by comparison the UK top marginal rate applies at 4.2 times the average industrial wage. Entry to the higher rate of income tax in Ireland occurs at a relatively low level - the standard rate band threshold for a single individual of €33,800 is below the national average wage of €36,899 (Q4, 2016). OECD analysis shows the average single worker in Ireland faced a net average tax rate of 19.7 per cent in 2015, compared with the OECD average of 25.5 per cent and 23.4 per cent in the UK. In Ireland, a single worker on the average industrial wage, after tax and benefits, was 80.3 per cent of their gross wage, compared with the OECD average of 74.5 per cent and 76.6 per cent in the UK. Ireland’s marginal tax rate is high relative to the UK and 20 per cent higher than the EU28 average. Figure 18 shows that marginal rates in Ireland are competitive at lower wage levels but high for individuals earning the average wage or above. At 54.4 per cent, the top marginal tax rate in Ireland is high relative to the UK (49%), the OECD average (47%) and the US (43.6%).
productivity growth. Productivity performance will assume an even more prominent role in driving Irish international competitiveness. Indeed, in the longer term, productivity growth is the preferred mechanism to improve competitiveness as it can support cost competitiveness in tandem with high and increasing income levels. Relative to most OECD countries, Ireland’s productivity performance is strong in terms of growth and levels of GDP per hour worked. However, Ireland’s overall productivity performance measured relative to GDP is positively skewed by certain sectors. A narrow base of sectors (ICT and Manufacturing account for the majority of productivity growth) leaving Ireland vulnerable to shocks. Increasing productivity across all sectors
and occupations, particularly in the indigenous economy remains a significant issue1.
After labour costs, facility or property costs represent the next significant cost factor in the profile of business
costs. For services sub-sectors, office lease costs represent 4 to 15 per cent of total location-sensitive costs.
For manufacturing sub-sectors, industrial lease costs range from 2 to 5 per cent of location-sensitive costs.
The availability and cost of commercial property in Ireland remains a significant threat to sustained cost competitiveness. On the commercial side, annual growth rates in office rents in the 5 years to Q2 2016 in Dublin 4/Dublin 6 were 14.1 per cent, significantly higher than comparable rates in the UK and the Euro area. Concerns persist about the availability of prime office space for rent in large urban centres in the short term as the market tightens and vacancy rates decline. New commercial supply is being absorbed quickly while demand levels are expected to rise. These factors combined could equate to rents increasing further over the
short to medium term. In 2016 prime retail rents increased by 31.5 per cent in Ireland on average since 2014
and Ireland was the 5th most expensive location in the Euro area. Such rental price pressures combined with the shortage of supply of commercial space over the past number of years could adversely impact on Ireland’s competitiveness in attracting mobile inward investment and the expansion of existing Irish enterprises and start-ups.
From a competitiveness perspective, the supply and affordability of residential housing is a component of
Ireland’s ability to compete internationally. It impacts upon the attractiveness of Ireland as a location for investment and directly impacts on enterprise costs through wage effects, and indirectly determines the price of Irish goods and services. The cost of housing (purchase and rent) influences labour mobility and contributes to an economy’s ability to adjust to adverse economic shocks. In short, a well-functioning housing and construction sector is critical to the overall health of society and the economy. The shortage of housing in Ireland remains an impediment both to attracting mobile inward investment and the expansion of operations by enterprises and is a critical infrastructure support job creation in both Dublin and the regions. Despite an increase in construction activity and planning permissions residential property supply remains constrained. Continued strong demand means property price inflation is likely to continue in the short term without additional supply becoming available. The link between residential prices and rents, and wage expectations means that developments in the residential property sector also have a direct impact on Ireland’s international competitiveness. Average rents nationally are close to peak 2007 rates and even surpass them in certain areas. In a distinct echo of the recent past, our housing market risks undermining our entire competitiveness
offering. While the ‘Rebuilding Ireland’ Plan presents a wide-ranging set of welcome commitments, many of these will take time to implement and to effect change.
A reliable and competitively priced supply of energy is vital for business and its ability to compete successfully
in international markets. Utility and energy costs are an essential input to the entire enterprise base across
the State, both the internationally trading and domestic sectors of the economy. Utility costs can represent 1
to 7 per cent of location-sensitive costs2. Despite increasing investment in renewable energy, Ireland continues
1
For more see NCC’s Benchmarking Ireland’s Productivity Performance, 2017 2
to have a very high dependence on imported fossil fuels, particularly oil on which 48 per cent of our energy consumption is based. As a small peripheral EU economy, with limited resources, factors outside of our control such as international oil prices exert a significant influence on energy prices so it is essential that efforts continue to focus on cost determinants within our control such as regulatory costs. The energy implications for Ireland of Brexit could be significant given our dependence on energy imports from the UK, the source of 76 per cent of our oil imports. In terms of our electricity generation, 46 per cent is generated using natural gas, and 96 per cent of our gas is imported from the UK. Ireland is characterised by high taxes on motor fuel and 58 per cent of total diesel costs are made up of various taxes, the 5th highest proportion in the Euro area. The impact of these taxes is becoming more evident as the international price of oil increases.
Generally, water and waste water costs for enterprise in Ireland compare favourably to those in competitor
markets despite there being a significant variation between water and waste water tariffs across Local
Authorities. Ireland is relatively cost competitive for telecoms, although, concerns persist around quality and
the regional availability of high speed services.
Brexit also underscores the importance of Ireland’s logistics and transport sectors cost competitiveness. The
UK is the destination for 50 per cent of all maritime goods exports and 88.4 per cent of roll on/roll-off freight traffic. Of the total amount of goods received at Irish ports in 2015, a third arrived from the UK. The proportion of exports varies depending on the type of cargo involved. 85 per cent of roll-on/roll-off traffic arrived from the UK while 41 per cent of liquid bulk originated in the UK. The implications of extra administrative costs and tariffs, standards and regulations and customs on the transport of goods between Ireland and the UK could negatively impact on indigenous exporters’ supply chains, and their capacity to competitively price products, not only in the UK but domestically and in other international markets.
Access to competitively priced sources of finance is essential to facilitate enterprises establish, survive,
improve productivity and ultimately scale. Limited or costly credit damages the environment for
entrepreneurship, scaling and investment and amount to a competitive disadvantage for Irish enterprises. Irish SMEs are still heavily reliant on bank loans with limited uptake of non-bank finance sources.
The determinants of the cost of credit in Ireland are complex and varied but the concentrated lending market
coupled with higher credit risk premiums in Ireland have been cited as the reasons for higher interest rates here over the Euro area average. Irish interest rates on business loans have been consistently higher (and more volatile) than equivalent Euro area rates and it is vital that the cost of credit is reduced to align Ireland with rates in competitor countries. While many firms are understandably primarily concerned about accessing credit rather than the cost of that credit, the interest rate differential between Ireland and the Euro area places Irish based enterprises at a disadvantage. Central Bank analysis shows the Irish SME lending market is highly concentrated with the three main lenders accounting for approximately 90 per cent of market share. The CSO’s Access to Finance Survey, March 2016, indicates that there is a correlation between size and sector and growth trajectory in successfully accessing finance. It also highlights how relatively few SMEs (particularly, non-exporting SMEs) seek funding from non-bank sources: for example only 4.7 per cent of medium sized enterprises looked for equity finance compared to 39.8 per cent of similar sized enterprises who looked for bank finance. Further diversifying the lending market in Ireland and in turn increasing levels of private equity, crowdfunding and venture capital funding remains a challenge.
Combined with the aforementioned domestically determined costs, infrastructural bottlenecks, skills
shortages and increasing levels of industrial unrest also present significant downside risks for Ireland and
Service and Broader Environment Price Competitiveness
The UK’s decision to leave the EU has imminent and far reaching consequences for Ireland’s economy and
brings into sharp focus the need for Ireland to maintain and improve our cost competitiveness. Ireland’s current price profile could be described as ‘high cost, rising slowly’, the UK is “high cost, rising quickly”. Price levels in Ireland were 22.2 per cent more than the EU average in 2015; the UK was 33.3 per cent above the EU average. Ireland needs to maintain and improve its relative cost competiveness.
In recent years, the weak Euro exchange rate, low ECB interest rates, and low international fuel prices have
driven improvements in Irish Harmonised Competitiveness Index (HCI) competitiveness. The nominal HCI appreciated by 3.8 per cent on a year-on-year basis to November 2016. The real HCI increased by 2.3 per cent when deflated with consumer prices, indicating a degree of diminishing Irish competitiveness. The openness of the Irish economy means the competitiveness of the enterprise sector is particularly vulnerable to negative price and cost shocks which are outside the influence of domestic policymakers. These include unfavourable exchange rate movements, higher international energy prices or imported inflation from our major trading partners. All of these competitiveness reducing variables have been evident over the past year. The recent appreciation of the euro vis-à-vis Sterling provides a timely warning about just how vulnerable Irish firms are to external shocks and further volatility and depreciation of Sterling represents a major threat to Irish export competitiveness. Volatility in exchange rates can affect the Irish economy through a number of channels. It may generate expenditure switching effects between foreign and domestic goods and services both at home and in trade partners, thus affecting net exports, to the degree that nominal exchange rate changes are absorbed by importers/exporters rather than passed on through increased prices, exchange rate movements may also affect firms’ profit margins, with possible second-round effects on investment. Further volatility and depreciation of Sterling remains a clear threat to export competitiveness. Irish policymakers cannot influence exchange rates, and the trade performance of our small open economy will always be conditional on the ebb and flow of global markets. However, a competitive, sustainable, cost base can provide a buffer against such exchange rate fluctuations and other external factors such as international energy prices.
The international price of oil has almost doubled over the past 12 months3 and the favourable tailwind of low
international energy prices, which to date have countered increases in other domestic costs, is now
dissipating. The curbing of supply by OPEC, dwindling reserve levels and the fall-off in US shale oil production have been cited as contributory factors.
Consumer price inflation - as measured by the Harmonised Index of Consumer Prices (HICP) – decreased
slightly in 2016 according to Eurostat. Despite low levels of inflation, Ireland remains a relatively high cost location and the return to strong economic growth has resulted in a series of upward cost pressures in some areas of the economy. Ireland compares favourably in HICP terms compared to the UK, US and the EU 28. Inflation in Ireland was negative through much of 2016. Recent changes in the euro Sterling exchange rate, and the impact of higher energy prices begins has seen inflation increase in early 2017 to 0.7 per cent in both CPI and 0.6 per cent in HICP terms in March 2017. The UK’s new relationship with the EU post-Brexit will have a significant bearing on inflation there over the next few years through several channels. UK inflation recently soared to its highest level in two and a half years and is forecast to rise to 2.5 per cent in 2017. Much of the rise to date reflects the elimination of past drags from food, energy and import prices, together with renewed rises in oil prices. The projected path for inflation over the next three years in large part reflects the impact of higher
import prices following Sterling’s depreciation. Conversely, Irish inflation rates are forecast at 0.7 per cent in 2017 and 1.2 per cent in 2018.
The services sector is likely to remain the main source of upward price pressure in Ireland, with the price pass
through impact of exchange rates and an expected increase in energy prices in 2017 also possible sources of
upward pressure. In addition, residential property rents are also projected to increase due to continued
limited supply of residential property. Persistently high rates of consumer price inflation lead to expectations of further price increases, and can create a vicious circle of increasing prices, reducing real incomes, increasing wage demands and reduced international cost competitiveness. As a small open economy, any deterioration in our cost competitiveness will have a major negative impact upon economic growth, employment and our standard of living. Addressing any erosion in cost competitiveness must remain a key economic priority for both enterprise and the Government.
Challenges for Policy Makers
As outlined in Ireland’s Competitiveness Challenge 2016, maintaining fiscal sustainability and a broad tax base;
supporting structural reform, innovation, and productivity; and growing our enterprise and export base will remain significant immediate challenges for Irish policymakers. The Council has set out a number of key recommendations for structural reform to address the national cost base in Ireland’s Competitiveness Challenge 2016 report. These are summarised on page 10 of this report. Furthermore, there have been a number of key policy developments over the past year or so across the areas of interest to the Council – the development of the Action Plan for Housing and Homelessness, the National Rental Strategy, the enactment of the Legal Services Bill and the Cost of Insurance Working Group, all of which have been devised with a view to maintaining and enhancing cost competitiveness.
Ultimately, cost competitiveness is a critical foundation to withstand economic shocks and relentlessly pursuing cost competitiveness across all business inputs is essential for a small, open, trade-dependent economy such as Ireland. It is also a crucial element in reducing the cost of living and improving living
standards. In light of these recurring and immediate cost issues, cumulatively there is a role for both the public and private sectors alike to proactively manage the controllable portion of their respective cost bases, drive efficiency and continue to take action to address unnecessarily high costs. It is important we maintain vigilant control over domestically determined costs and there is no opportunity for complacency. Such actions will ensure that improvements in relative cost competitiveness are more sustainable, leaving Ireland less dependent on a benign external environment.
Finally, the findings contained in the report, along with those from the forthcoming NCC International
Competitiveness Scorecard 2017, will form the analytical basis for policy recommendations in Ireland’s
Competitiveness Challenge 2017 due later this year.
Policy Recommendations
Cost Competitiveness Policy Recommendations
Labour Costs
Continue to reform and simplify the current regime of taxes and charges on employment, specifically to further encourage the take-up of employment opportunities and job creation, whilst
simultaneously maintaining a broad personal tax base. Anomalies in relation to PAYE and the USC should be removed to support the self-employed, job creation and entrepreneurship.
Review income taxes (e.g., credits, thresholds, rates, etc.) to support improvements in after-tax income, enhancing the incentive to work while simultaneously protecting labour cost
competitiveness.
Outline how the revenue foregone from the abolition of the USC would be replaced in a growth and employment friendly manner, consistent with the principle of broadening the tax base.
Property Costs
Devise a clear implementation plan for Rebuilding Ireland – Action Plan for Housing and Homelessness
with specific timelines and assigned responsibility for specific actions. Drive implementation through regular reporting and cross-agency collaboration. Establish and resource the Housing Delivery Office and the Housing Agency’s dedicated Procurement Unit as a matter of urgency.
Establish the State Lands Management Group with the clear objective of improving the supply of affordable development land. Drive proactive engagement with all relevant interests on the large-scale strategic sites to accelerate the delivery of new homes in our urban areas.
Launch the competition to develop innovative systems for the delivery of affordable high quality residential development. Analyse the cost savings and disseminate the learnings from the competition to housing stakeholders.
Expedite the development of a commercial property price register encompassing data on commercial sales and leases.
Introduce the Vacant Site Levy as planned. Prior to its introduction, review the proposed exemptions to ensure that the Levy is sufficiently broad in scope.
Transport Costs
Avail of the provisions within the expenditure benchmark pillar of the EU fiscal rules to fund capital investment. Use of these provisions should be in a manner compatible with and in adherence to the rules of the Stability and Growth Pact.
Increase the allocation for capital investment in physical and knowledge capital to support
competitiveness, in the context of the Mid-Term Review of the Capital Plan. Ensure that coherent and clear linkages exist between the objectives set out in the National Planning Framework and the priorities identified in the Mid-Term Review of the Capital Plan
Review how other advanced economies coordinate and deliver capital investment and identify best practice in terms of the institutional framework for capital infrastructure investment.
Develop and source non-exchequer investment to support the delivery of economic infrastructure. Options include (i) Public-private partnerships; (ii) funding channels such as the European Strategic Investment Fund; and (iii) special purpose vehicles.
Utility Costs
Develop a target led, time bound implementation plan around the priorities identified in the Energy White Paper.
Complete the construction of the north-south interconnector to bolster security of supply and reduce energy costs.
Identify specific barriers and recommend actions to improve mobile and broadband access pending the rollout of the National Broadband Plan.
Commence work on the successor to the National Digital Strategy.
Credit and Financial Costs
Continue to monitor the landscape for enterprise finance so that viable businesses are not
constrained by an inability to access finance. Where gaps are identified, develop proposals to provide alternative sources of finance, with a particular focus on SMEs and on equity finance.
Partner the Strategic Banking Corporation of Ireland with more international lenders, especially in non-bank finance, so as to increase competition and provide alternative sources of finance for SMEs.
Increase the number of lenders and the uptake of SBCI loans. Secure additional funding for the SBCI once its current lending capacity has been fully drawn down.
Business Services Costs
Continue to develop a more comprehensive and representative data set on legal service prices
Incorporate the competition-enhancing and cost-reducing provisions of the Legal Services Act rapidly into the regulations to be issued by the independent Legal Services Regulatory Authority. Ensure that the LSRA is adequately resourced to undertake the research necessary to fulfil its mandate
Chapter 1 –Introduction and Methodology
Introduction
Competitiveness is a multidimensional concept, encompassing many different drivers. Competitiveness is not an end in itself, but a means of achieving sustainable improvements in living standards and quality of life. The Cost of Doing Business is just one of the elements which determine a country’s ability to compete in
international markets. The success of the enterprise sector affects overall prosperity and steps towards this prosperity also indicate progress in national competitiveness.
The NCC’s Competitiveness Framework
The Council defines national competitiveness as the ability of enterprises to compete successfully in international markets. National competitiveness is a broad concept that encompasses the diverse range of factors which result in firms in Ireland achieving success in international markets. For the Council, the goal of national competitiveness is to provide Ireland’s people with the opportunity to improve their living standards and quality of life. The Council uses a “competitiveness pyramid” to illustrate the various factors (essential conditions, policy inputs and outputs), which combine to determine overall competitiveness and sustainable growth. Under this framework, competitiveness is not an end in itself, but a means of achieving sustainable improvements in living standards and quality of life.
At the top of the pyramid is sustainable growth in living standards – the fruits of competitiveness
success.
Below this are the key policy outputs for achieving competitiveness, including business performance
(such as trade and investment), costs, productivity, and employment. These can be seen as the metrics
of current competitiveness.
Below this in the third tier are the policy inputs covering three pillars of future competitiveness, namely
the business environment (taxation, regulation, and finance), physical infrastructure, clusters and firm
sophistication, and knowledge and talent.
Finally, at the base of the pyramid are the essential conditions for competitiveness, these foundations are based on institutions, macroeconomic sustainability, and endowments.
This Costs of Doing Business 2017 report concentrates on the costs that are largely domestically determined
such as labour, property, transport, utility, credit and financial, and business services. It considers both price
levels, and changes in those levels (i.e. price inflation). Itis structured as follows:
Chapter 2 provided an overview of why costs matter for enterprise, sets out cost profiles for a range of
firm types which identify the most important cost categories, and explains the high level economic factors that determine costs;
Chapter 3 summarises the key cost trends for enterprise in Ireland;
Chapters 4 to 8 examine the main cost categories in greater detail. The primary costs analysed in these
chapters relate to labour, property, transport, utilities, and credit and financial costs;
Chapter 9 examines data on business services and other input costs – a cost category not captured in the
profiles referred to above but still an important input for the vast majority of enterprises; and
Finally, acknowledging the interlinked nature of all sectors and participants of the economy, Chapter 10
considers the broader consumer cost environment.
Methodology
In each chapter, a range of internationally comparable, enterprise-focussed cost indicators are collected for Ireland and a number of our key trading partners. We have endeavoured to collect data from high-quality, internationally respected sources, and where necessary, caveats on data are set out. Measuring and
benchmarking cost competitiveness performance relative to third countries highlights Ireland’s strengths in a number of areas but is also intended to identify potential threats on weaknesses. Nonetheless, there are limitations to comparative analysis:
While every effort is made to ensure the timeliness of the data, there is a natural lag in collating
comparable official statistics across countries. As much of this data is collected on an annual basis, there may be a time lag in capturing recent changes in cost levels.
The Council is also constrained in terms of the availability of metrics and their impact on enterprises of
different sizes and sectors and across a number of important areas such as water, transport and international freight, waste, insurance and Local Authority rates.
Given the different historical contexts and economic, political and social goals of various countries, and
their differing physical geographies and resource endowments, it is not realistic or even desirable for any country to seek to outperform other countries on all cost measures.
There are no generic strategies to achieve an optimum level of cost competitiveness; as countries face
trade-offs and may be at different points in the economic cycle.
Where possible, Irish cost levels are compared to a relevant peer group average (e.g. the OECD and Euro
Chapter 2 – How Do Costs Impact on Enterprise?
The NCC framework (see Chapter 1) for analysing competitiveness performance considers inputs and outputs can be illustrated on a pyramid. Under the framework, competitiveness is not an end in itself, but a means of achieving sustainable improvements in living standards and quality of life. The NCC currently uses a pyramid to outline the framework within which it assesses Ireland’s competitiveness. At the top of the pyramid is sustainable growth in living standards – the fruits of competitiveness success. Below this are the key policy outputs for achieving competitiveness, including business performance (such as trade and investment), prices and costs, productivity and employment. These can be seen as the metrics of current competitiveness. Below this are the policy inputs covering three pillars of future competitiveness, namely education and training, innovation, clusters and firm sophistication, Ireland’s economic and technological infrastructure and the business environment (which includes entrepreneurship, taxation and the regulatory framework). Finally, at the base of the pyramid are the essential conditions for competitiveness, these foundations are institutions, macroeconomic sustainability and natural endowments.
Why Costs Matter
Generating sustainable broad based export-led growth is essential to sustaining economic growth in these challenging times. To achieve such growth, Ireland’s international competitiveness must be maintained and enhanced relative to our key competitors.
Competitiveness is a complex concept, encompassing many different drivers. Notwithstanding the evolution of the Irish economy and the growing complexity of the goods and services produced in the country over the past decade, cost competitiveness remains a critical determinant of success. Indeed, in the absence of a currency devaluation policy lever to manage short term competitiveness pressures, a combination of cost competitiveness in key business inputs and enhancements in productivity must provide the foundations for sustaining growth. In the longer term, productivity growth is the preferred mechanism to improve
competitiveness as it can support cost competitiveness in tandem with high and increasing income levels. A high cost environment weakens competitiveness in a number of ways.
High costs make Ireland less attractive in terms of mobile investment and business expansion and in the
context of Brexit, if unchecked could see companies relocating to other jurisdictions;
High costs make firms which rely on domestically sourced inputs less competitive when they are selling
into foreign markets – this is a particular concern for large indigenous exporting sectors such as the food and drink sector, construction products and services, timber and engineering; and
A high cost environment can impact on firms which may not export, but which rely on the domestic
market – their customers (consumers and other firms) may source cheaper inputs from abroad due to currency fluctuations, rather than from within Ireland, leading to a loss of market share for Irish based enterprises.
manage their cost base and drive efficiency, thus creating a virtuous circle between the costs of living, wage expectations and cost competitiveness.
Which Costs Matter Most?
From a competitiveness perspective, it is essential that policymakers focus on maintaining cost
competitiveness, particularly in relation to those goods and services that comprise a significant percentage of business costs and that are out of line with those in competitor countries. Figure 1 and Table 1 provide an
enterprise cost profile based on data for a range of sectors and locations4.
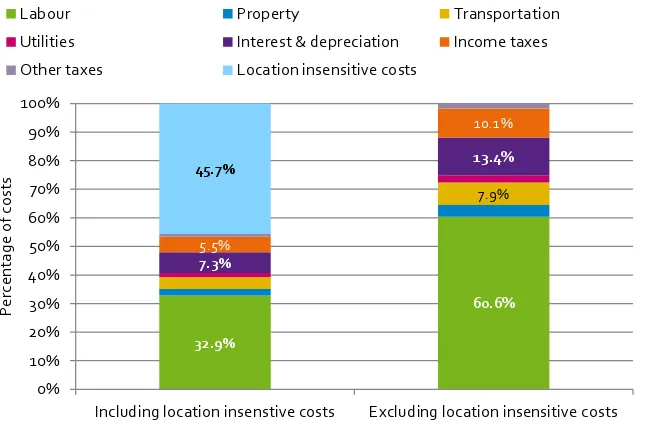
[image:16.595.87.419.305.518.2]The data illustrate the relative importance of location sensitive and location insensitive costs (i.e. goods and services produced on international markets where the price is determined by global supply and demand conditions: e.g. commodity raw materials, industrial equipment, etc.).
Figure 1: Summary of Enterprise Cost Profiles, 2016
The column on the right strips out cost elements determined
internationally and focuses instead on costs which are primarily determined domestically. The significance of the location-sensitive cost factors differs by sector, with considerable variations occurring between services and manufacturing firms.
Source: KPMG Competitive Alternatives 2016, NCC Calculations
These differences are elaborated upon in Table 1, which provides a range of magnitude for each cost category.
4 KPMG’s 2016 Competitive Alternatives report explores the most significant business cost factors in more than 100 cities and 10 countries around the world. This study measures 26 key cost components, across 7 business to business service segments and 12 significant manufacturing sectors. The 10 countries included in the KPMG report are Australia, Canada, France, Germany, Italy, Japan, Mexico, Netherlands, UK and US. While Ireland is not included in the project, Figure 1 provides data based on the average contribution of each cost factor for the 10 countries included in the study. This provides an indication of the importance of each cost factor to the average firm. All figures in this report are expressed in US dollars and so results are sensitive to exchange rate movements – while exchange rate changes do not affect local business costs expressed in local currency, they do impact international comparisons when local costs are converted to US dollars.
32.9%
60.6% 7.9%
7.3%
13.4%
5.5%
10.1%
45.7%
0% 10% 20% 30% 40% 50% 60% 70% 80% 90% 100%
Including location insenstive costs Excluding location insensitive costs
P
erce
n
ta
ge
of
c
ost
s
Labour Property Transportation
Utilities Interest & depreciation Income taxes
Table 1: Relative Significance of Location Sensitive Costs (% of total location sensitive costs), 2016
Services Manufacturing
Labour & Benefits 72-86% 40-57%
Of which: Salaries & Wages 52-61% 28-40%
Statutory Plans 8-10% 5-7%
Other Benefits 12-14% 7-10%
Facility Costs 4-15% 2-5%
Transportation Costs - 6-21%
Utility Costs 0-1% 2-7%
Capital Costs 0-8% 11-25%
Taxes 3-16% 10-18%
Of which: Income Taxes5 1-15% 9-15%
Property Taxes 1-2% 1-2%
Other Taxes 0-1% 0-1%
Source: KPMG Competitive Alternatives 2016
Taking these in turn:
Labour costs include wages and salaries, employer-paid statutory plans, and other employee benefits.
KMPG research indicates that labour costs represent the largest category of location-sensitive cost factors for all industries examined. For the services sub-sectors examined, labour costs typically range from 72 to 86 per cent of location-sensitive costs, while for manufacturing operations the typical range is from 40 to 57 per cent of total location-sensitive costs.
Facility or property costs represent the next significant cost factor. For services sub-sectors, office lease
costs represent 4 to 15 per cent of total location-sensitive costs. For manufacturing sub-sectors, industrial lease costs range from 2 to 5 per cent of location-sensitive costs.
Transportation costs are only assessed for manufacturing operations – reflecting the cost of moving
finished goods to markets. For the manufacturing sub-sectors examined, transportation costs represent 6 to 21 per cent of total location-sensitive costs.
Utility costs represent 1 to 7 per cent of location-sensitive costs6. Electricity and natural gas costs are more
significant for manufacturers than for non-manufacturers.
Costs of capital include both depreciation and interest. These are major cost items for manufacturers,
ranging from 11 to 25 per cent of location-sensitive costs across sub-sectors. Capital-related costs are much less significant for services sub-sectors, at 0 to 8 per cent of location-sensitive costs.
Taxes typically represent 3 to 16 per cent of total location-sensitive costs for the services sub-sectors
examined, and 10 to 18 per cent for manufacturing sub-sectors.
5 Effective income tax rates are calculated to reflect combined corporate tax rates (national, regional and local), net of generally applicable tax credits, grants and other common government incentives.
6
What Drives Costs?
Ireland would be considered a wealthy country by international standards. Wealthy countries are generally expensive countries and two theories are often cited to demonstrate this correlation, both of which resonate in some way with the Irish economic model.
In an economy catching up with its richer neighbours, labour productivity tends to rise faster in sectors producing internationally tradable goods (particularly in capital intensive manufacturing industry) than in those involved in the more labour intensive and generally non-traded service sector. Increases in labour productivity growth in traded manufacturing industries are usually followed by wage growth throughout the economy. Thus, a combination of wage growth across both traded and non-traded sectors, but lower labour productivity gains in the services sector, leads to more rapid increases in the cost of services. In this way, services inflation is often higher in those regions of a monetary union enjoying the most rapid growth in productivity and incomes. This is known as the ‘Balassa-Samuelson effect’.
The Bhagwati–Kravis–Lipsey view provides a somewhat different explanation from the Balassa– Samuelson theory and the crux is that tradable goods are more capital intensive than non-tradable goods and wealthy countries have higher endowments of capital than their poorer counterparts. Therefore, workers in tradable goods in more affluent countries will be more productive and earn higher wages. Less affluent countries often have an abundance of labour and thus their non-tradable goods will be less expensive.
Analysis by the European Commission7 has found that even allowing for Ireland’s relatively high level of GDP per capita, the price level in Ireland prior to the recent crisis had been relatively high in comparison with other Euro area economies. The Irish economy underwent a sharp correction in terms of its cost base across a range of metrics during the crisis. Notwithstanding these cost adjustments the Irish price level remains elevated compared with many of our competitors. Ireland’s current price profile could be described as ‘high cost, rising slowly, with price levels in Ireland 22.2 per cent more than the EU average in 2015.
Over the past number of years since the economic crisis a number of recurring cost-drivers identified by the Council have emerged impacting on a range of business inputs:
Housing costs which indirectly impact on industries’ costs and influence the competitiveness of Irish goods and services;
Commercial property costs;
Credit costs and interest rate differentials between Irish firms and their European counterparts;
Energy and utility costs;
Business services costs, namely professional services and transport; and
Consumer costs, namely insurance, health and education.
In light of these recurring and immediate cost issues, cumulatively there is a role for both the public and private sectors alike to proactively manage the controllable portion of their respective cost bases, drive efficiency and continue to take action to address unnecessarily high costs.
7
HICP – Administered prices (HICP-AP)
Persistently high rates of consumer price inflation lead to expectations of further price increases, and can create a vicious circle of increasing prices, reducing real incomes, increasing wage demands and reduced international cost competitiveness. Inflation also adversely impacts upon our attractiveness as a location for mobile talent. Although Irish inflation is currently low, it is prudent to consider administrative factors affecting consumer price inflation and contributing to the Irish consumer price level.
Administered prices refers to prices of goods and services which are fully (“directly”) set or mainly (“to a significant extent”) influenced by the government (central, regional, local government including national regulators). From a policy perspective, the portion of any increase in administered prices that can be attributed to the government directly is unclear for at least two reasons. Firstly, in the case of Ireland, the categories are “mainly-administered”, meaning the government does not completely determine prices in these categories. Secondly, some categories, such as electricity and gas, may be more influenced by international prices that are outside of the control of governments. In addition, certain pricing aspects of administered prices are determined by independent regulators (in accordance with their prescribed
mandates). The HICP-AP is a Eurostat measure of state-influenced prices. It is important to stress the HICP-AP basket differs from country to country depending on the scope government has to influence prices. A number
of conventions guide the definition of administered prices8. The goods and services classified as
“administered” by the CSO and Eurostat represent a small subset of the overall Irish CPI basket. Up to 2006, refuse collection was considered a fully administered category, however, there are currently no consumer goods and services categories classified as fully administered prices in Ireland. Mainly administered prices cover the prices of goods and services on which the government including any national regulator has a significant influence. Table2 outlines the range of goods and services categories defined as mainly administered prices in Ireland and the year in which they were classified and included in the mainly administered basket.
Table 2: Mainly-administered prices in Ireland
COICOP9 Sub indices Mainly-administered prices, in Ireland and date of inclusion
04.41 Water Supply (from 2015)
04.43 Sewage (from 2015)
04.51 Electricity (up to 2011)
04.52 Gas (up to 2014)
06.3 Hospital services
07.31 Passenger transport by railway (from 2011)
07.32 Passenger transport by road
07.35 Combined passenger transport (from 2011)
08.1 Postal services (up to 2008)
12.53 Insurance connected with health (up to 2008)
Source Eurostat
8 Consumer prices subject to indirect taxation and excise duties are not classified as administered as their effects are reflected in the HICP at Constant Tax Rates (HICP-CT). Products that are subject to standards regulation, such as health and safety or environmental standards or products under the Common Agricultural Policy are excluded. Products that are subject to index-linked price regulation by adjusting inflation are typically excluded. There are also conditions that dictate whether and how telecommunications, electricity, and gas items are included in the HICP-AP basket.
9
Figure 2: HICP and Mainly-administered prices in Ireland, 2011-201610
Figure 2 shows a downward trend in HICP and administered price inflation over the period 2011-2016. Inflation in administered prices was particularly high in 2011 (6.3%) 2012 (7.3%) and 2015 (10.5%). In 2016, mainly administered prices decreased by 1.9 per cent compared to a decrease in the HICP of 0.2 per cent.
Source: Eurostat
Table 3: HICP and Mainly administered prices, annual average rate of change (%), 2011-2016
2011 2012 2013 2014 2015 2016 Median 11-16
Average 11-16
All-items HICP 1.2 1.9 0.5 0.3 0 -0.2 0.4 0.6
Mainly administered prices 6.3 7.3 3.2 1.2 10.5 -1.9 4.8 4.4
Overall index excluding mainly administered prices
0.9 1.6 0.4 0.3 -0.6 -0.1 0.4 0.4
Electricity 6.6 11.311 5.6 3.6 -0.2 -3.6 3.6 2.4
Gas 6.6 15.2 6.7 2.1 -2.4 -3 4.4 4.2
Hospital services 10.6 1.5 -0.5 0 0 0.1 0.1 2.0
Passenger transport by railway 1.3 2.7 5.1 4.7 4.4 2.1 3.6 3.4
Passenger transport by road 2 6 5.8 2.2 2.7 0.9 2.5 3.3
Combined passenger transport 3.4 6.8 7.3 7.1 1.9 0.2 5.1 4.5
Postal services 0 1 6.1 7.2 8.9 2.9 4.5 4.4
Insurance connected with health 20.6 15.6 11.9 7.4 0 5.3 9.7 10.1
Water supply 0 0 0 0 174.7 -50 0.0 20.8
Sewerage collection 0 0 0 0 174.7 -50 0.0 20.8
Source: Eurostat
Table 3 sets out the annual changes in the Classification of Individual Consumption by Purpose (COICOP) sub-categories that Eurostat has at one point determined qualify as fully- or mainly-administered in Ireland. Some categories, such as Refuse collection, Electricity, Gas and Insurance connected with health and Postal services were identified as administered up to particular points in time, after which the category has dropped out of the
HICP-AP basket. Others, such as Water supply and Sewerage collection was introduced in 201512. All other
10
Inflation in administered prices has been higher than headline HICP inflation in Ireland throughout the period 2011-2016 and the differential between the two has narrowed (with the exception of 2015).
11 Figures in italics are not categorised as administered prices for the related year.
subheadings are included in the HICP-AP index for the entirety of the time series. The table shows that transport related costs have increased at a rate consistently higher than HICP over the period 2011-2016. The rate of increase in hospital services was high in 2010 but has slowed considerably since then. Categories no longer categorised as administered prices such as Insurance connected with health, postal services, gas, electricity and postal services increased at a more rapid rate than HICP prices.
Figure 3: Inflation in mainly administered prices, Ireland, UK and the Euro area, 2011-201613
Figure 3 shows that between 2011 and 2016, inflation in Irish mainly administered prices has outpaced inflation in mainly administered prices in the Euro area (changing composition).
With regard to the UK14,
with the exception of 2015, (largely as a result of the introduction of water charges) mainly administered prices were higher than the Irish rates in every year.
Source: Eurostat/ECB
13 Comparison with the Euro area is a comparison between other countries’ HICP-AP inflation but there are differences in the composition and categories that make up the Irish HICP-AP basket and the Euro area basket which is calculated by the European Central Bank.
14
Chapter 3– How Does Ireland Perform?
Figure 4: Euro/pound sterling and euro/dollar exchange rate Index, January 2012-2017
The relative value of the Euro against the Dollar and particularly Sterling has fluctuated
considerably in recent months. The
depreciation of Sterling in the wake of the Brexit referendum decision has diminished
competitiveness relative to UK produced goods and services.
[image:22.595.84.410.154.356.2]Source: Eurostat
Figure 5: Euro/pound sterling and euro/dollar exchange rate, January 2012- 2017
In 2016, the Euro strengthened and appreciated by 16 per cent against Sterling posing significant challenges for parts of the exporting sector reliant on trade with the UK. Further volatility and depreciation of Sterling represents a major threat to Irish export competitiveness.
Source: Eurostat 75 80 85 90 95 100 105 110 115
Jan
-12
M
ay-12
S
ep
-1
2
Jan
-13
M
ay-13
Sep
-1
3
Jan
-14
M
ay-14
Sep
-1
4
Jan
-15
M
ay-15
Sep
-1
5
Jan
-16
M
ay-16
Sep
-1
6
Jan
-17
Eu
ro
e
xch
a
ng
e
rat
e
J
a
n
20
12
=
100
Index USD Index GBP Avg USD Avg GBP
0.6 0.7 0.8 0.9 1 1.1 1.2 1.3 1.4 1.5
Ja
n
-12
M
ay-12
Se
p
-1
2
Ja
n
-13
M
ay-13
Sep
-1
3
Jan
-14
M
ay
-14
Sep
-1
4
Jan
-15
M
ay-15
Sep
-1
5
Jan
-16
M
ay-16
Sep
-1
6
Jan
-17
Euro
Exch
a
ng
e
Ra
te
Figure 6: Harmonised Competitiveness Indicators15, January 2005 – January 2017 (January 2005 = 100)
From March 2014 to January 2015, renewed euro depreciation provided a boost to Irish cost competitiveness. The latest data up to January 2017 show that the nominal HCI
decreased marginally by 1 per cent, primarily as a result of exchange rate movements, whereas real HCI improved by 1 percent over the previous 12 months.
Source: Central Bank of Ireland, NCC Calculations
Figure 7: Real HCI Movements in Ireland, Germany, Spain and Euro area (Jan 2005 – Jan 2017 (Jan 2005 = 100)
Figure 7 shows improvements in competitiveness were recorded across the Euro area during 2014 and H1 2015 as the euro depreciated. Irish competitiveness has mirrored that of the Euro area 19 over the corresponding period, with Ireland significantly more competitive that both Germany and Spain.
Source: Eurostat, NCC Calculations
Focus on Individual Cost Categories
15 Harmonised Competitiveness Indicators (HCIs) provide meaningful and comparable measures of countries price and cost competitiveness that are also consistent with the real effective exchange rates (REERs) of the euro. See NCC, UNDERSTANDING HARMONISED COMPETITIVENESS INDICATORS, 2016
80.00 90.00 100.00 110.00 120.00 130.00 Jan -0 5 O ct-0 5 Ju l-06 A pr-0 7 Jan -0 8 O ct-0 8 Jul -0 9 Apr-10 Jan -11 O ct-11 Jul -1 2 A pr-13 Jan -14 O ct-14 Jul -1 5 A pr-16 Jan -17 Im p rove m e nt J a n 20 0 5= 100 Disi m p rove m e nt
Nominal HCI Real HCI
70 75 80 85 90 95 100 105 110 Jan -0 5 A ug-0 5 M ar-0 6 O ct-06 M ay-0 7 D ec -0 7 Jul -0 8 Fe b -0 9 Sep -0 9 A pr-10 N ov -10 Jun-11 Jan -12 A ug-12 M ar-13 O ct-13 M ay-14 D ec -14 Ju l-15 Fe b -16 Sep -1 6 Im p rove m e nt J a n 20 0 5= 100 Disi m p rove m e nt
Harmonised competitiveness indicators can be difficult to translate into real world experience. From the perspective of the firm or an individual, in order to fully appreciate changes in prices and costs, it is necessary to examine more tangible indicators such as wage rates, rents, and the prices paid for various utilities and
services. In this regard, Costs of Doing Business 2017examines over 70 different metrics across a range of
business cost categories to provide an overview of the cost environment for enterprise in Ireland. The key messages are summarised below.
Measures of Overall Cost Competitiveness
Summary of Business Cost Trends in Ireland
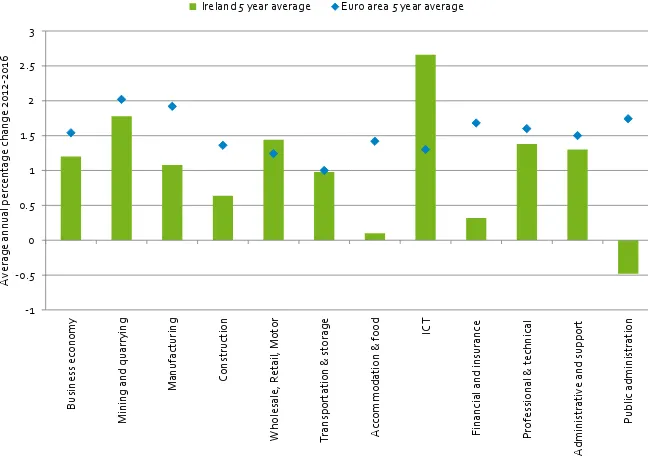
Labour Costs There is considerable heterogeneity across Europe with regard to, average hourly labour
costs in the whole economy, with the lowest hourly labour costs recorded in Bulgaria (€4.4), and the highest in Denmark (€42). In Ireland, the hourly labour cost was €30.4 in 2016, compared to €26.7 in the UK and €29.8 for the Euro area 19. The relative change in hourly labour costs 2015/2016 for the whole economy was 1.3 per cent compared to an increase of 1.4 per cent in the Euro area.
While demands for wage increases are understandable after a period of economic stagnation and wage cuts, our relative competitive position will be negatively affected if wage growth outpaces that in competitor countries and is not backed up by increases in productivity. While labour cost growth has been positive, the growth has been below EU and Euro area averages in the 5 year period to 2016, representing a competitiveness gain for Ireland. Sectoral wage growth rates have been lower in Ireland than the Eur0 area over the corresponding period with the notable exception of Wholesale & Retail and ICT. Domestically, at sectoral level, hourly labour costs in Construction and Wholesale & Retail in Ireland grew by 4.6 per cent and 4.1 per cent respectively between 2012 and 2015. Across all sectors the average growth was 1 per cent.
In 2015 the minimum wage as a percentage of average wages ranged from 34.6 per cent in the Czech Republic, 44per cent in Ireland to 52.4 per cent in Slovenia. As a percentage of average wages in 2014 across the Euro area 15, Ireland has the 10th highest minimum wage (not all comparable figures are 2014). In 2016 Ireland had the 2nd highest monthly minimum wage (€1,546). In its 2016 report to Government, the Low Pay Commission (LPC)
recommended that the national minimum wage should increase by €0.10 to €9.25 per hour from 1 January 2017 after having previously concluding that moderate increases in the national minimum wage are unlikely to have a significantly adverse effect on employment. According to the OECD, the levels of taxation in Ireland are below the Euro area on average income levels and on marginal income levels for married couples. The corresponding marginal levels are, however, high for single earners. Ireland is currently very reliant on taxes on income as a source of revenue and significantly less revenue is generated through social security contributions in Ireland as compared with other OCED members. Ireland has the 8th lowest rate of social security contributions in the OECD. Employers’ contributions are the 7th lowest, and employee contributions are the 11th lowest (although benefits are also
Property Costs
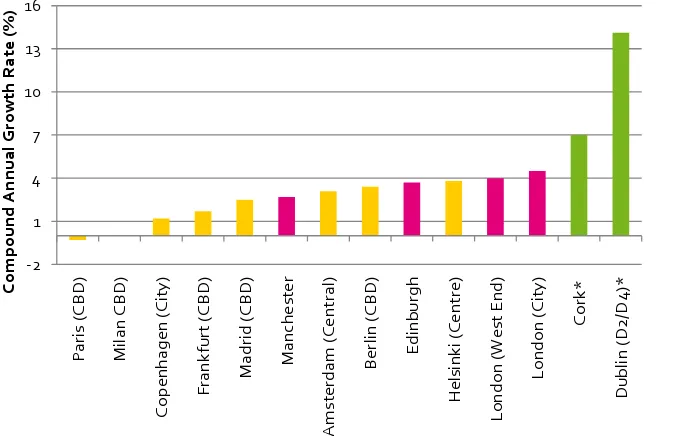
The last number of years has witnessed a sustained recovery in the Irish commercial property market. The cost of constructing a prime office unit and a High Tech Factory / Laboratory facility in Ireland rose by 6 per cent and 2 per cent in 2016 over the previous year. Commercial rents growth has been driven by an increase in demand, reflecting the improving economy. This in turn, has boosted capital values, the price that would have been paid for property if it had been purchased at the point of valuation, in all commercial sectors (e.g., office, industrial and retail). Overall growth was 3.8 per cent in Q4 2016. This acceleration has almost halved in the period since Q3 2015.
The availability of competitive property solutions is a key requirement for the expansion of enterprises and winning mobile investment. In 2016 prime retails rents increased by 32 per cent year-on-year on Dublin’s Grafton St. In the 5 years to Q2 2016 Compound Annual Growth Rates associated with Office Rents were 14.1 per cent in Dublin (D2 and D4 districts) and 7 per cent in Cork. The growth rates in Dublin were over three times the equivalent rates in both London City and London’s West End. Commercial property prices in Ireland, however, still compare favourably to comparable cities in the UK but concerns persist about the availability of prime office space for rent in large urban centres in the short term as the market tightens and vacancy rates decline. This could result in future rent increases and any shortage of supply16 of new commercial space could adversely impact our competitiveness .
Transport Costs
Ireland continues to have a very high dependence on imported fossil fuels, particularly oil on which 48 per cent of our energy consumption is based. As a small peripheral EU economy, with limited resources, factors outside of our control such as international oil prices exert a significant influence on energy prices. Ireland is characterised by high taxes on motor fuel and 58 per cent of total diesel costs are made up of various taxes, the 5th highest proportion in the Euro area. The impact of these taxes is becoming more evident as the international price of oil increases. As well as lowering greenhouse gases, investment in renewables is reducing our reliance on imported fuel. Oil is a significant component of our fuel mix, but while the fuel mix has an energy policy relevance in Ireland’s contemporary economy, oil’s main
significance is in transport policy and fiscal receipts.
In the year to January 2017 world oil prices have risen by almost 80 per cent to over $54 per barrel. This sharp rise in oil prices has been a contributing factor to the increased prices for petroleum products, and more generally inflation levels, across the EU. Irish petrol and diesel prices increased by 14.8 and 22 per cent respectively in the 12 months to February 2017. In addition, the cost of 1,000 litres of diesel in Ireland (€1,269) was 4.8 per cent above the Euro area average (€1,211) in the corresponding month. Ireland was the 4th most expensive country with taxes on diesel, at 58 per cent, accounting for the majority of this differential in Ireland. This is the 5th highest proportion in the Euro area. With regard to service prices in the transport sector, prices have been relatively stationary in recent quarters. Air transport is a notable exception with rapid price growth of 22.6 per cent recorded between 2012 and 2016.
Utility Costs The EU is among the most expensive locations for electricity and gas globally. The differential average price for electricity between Ireland and the UK has gone from a point where we are almost 12 per cent more expensive in 2012 to a situation where in the first half of 2016 electricity prices are 6 per cent cheaper in Ireland. Whilst industrial gas prices are now equal to the average prices across the Euro area, comparable prices are over 15 per cent lower in the UK. The data available, however, is based on cumulative average prices for Ireland and simple arithmetic averages for comparators. These figures also exclude VAT charges which may be making Irish prices appear to be more competitive given the fact that only 5
countries, Greece, Italy, Luxembourg, Malta and the UK have lower VAT rates on both natural gas and electricity17.
On average, water and waste water costs for enterprise in Ireland compare favourably to those in competitor markets. Within Ireland, water costs vary significantly by local authority. In terms of waste costs, the cost of landfill has increased from €93 per tonne in 2010 to €113 in 2014 because of increases in the landfill levy18. Irish landfill costs are amongst the most expensive of the benchmarked countries/regions.
Ireland is relatively cost competitive for telecoms, especially for business mobile broadband. However, concerns persist around the issues of quality (speed) and the regional availability of high speed services.
Credit and Financial Costs
The supply and demand for credit has improved significantly since the height of the crisis. However, the cost of credit, while falling remains high in an international context. Ireland had the 4th highest SME interest rates on bank overdrafts and credit lines in the Euro area in 2016. In January 2017, the interest rate in Ireland on loans of up to and including €1 million was almost double the Euro area average rate for new business. Furthermore, Irish interest rates for loans both under- and over the €1m threshold have been noticeably more volatile than Euro area rates. Irish and Euro area interest rates diverged further in 2014 and 2015. It is vital that cost competitiveness in this area does not weaken further.
The cost of registering a business in Ireland as a percentage of Gross National Income was 0.2 per cent in Ireland in 2016, half the rate recorded some five years previously. The
corresponding average across the OCED was 3.88 per cent.
Business Services and Other Input Costs
Services prices in Ireland have risen continuously since the beginning of 2012 and the magnitude of the increase has been higher than the Euro area 19 average during this period also. Overall since 2010, service prices have risen by more than manufacturing prices perhaps reflecting the greater exposure of the manufacturing sector to international competition. Large increases in prices were recorded in Postal and Courier (10.6 %) and Advertising, Media & Market Research (7.9%) since 2012.
While the price of legal services dipped for a brief period in 2013, in Q3 2016 legal service prices were 8.3 per cent higher than the corresponding quarter in 2012. According to the
17
France applies a standard rate and a reduced rate of 20% and 5.5% on both natural gas and electricity. 18
World Bank, in international terms Ireland remains an expensive location in which to enforce a business contract and is the 6th most expensive in the OECD. It also takes significant time (650 days) to enforce a contract in Ireland (compared with an OECD average of 551 days. The World Bank also estimate that the total cost of contract enforcement in Ireland amounts to 26.9 per cent of a claim, compared with 22.1 per cent across the OECD.
Broader Cost Environment
Ireland remains an expensive location in which to do business with a price profile which can be described as “high cost, rising slowly”. Irish consumer prices remain over 22 per cent above the European Union average. Education costs have increased at a faster rate than overall consumer costs since 2012 and over the corresponding period prices have risen by 18.5 per cent. These increases have been driven primarily by increases in the tertiary sector. Irish insurance price inflation as measured by the HICP has been volatile and significantly above the UK rate and Euro area average from early 2014. Health insurance, which accounts for approximately 60 per cent of the insurance category, has increased in Ireland in recent months. In March 2017 the rate of Irish health insurance inflation (8.3%) was well above the Euro area (2.3%) and UK (3.8%).
Mainly administered prices cover the prices of goods and services on which the government including any national regulator has a significant influence. There has been a downward trend in HICP and administered price inflation over the period 2011-2016. Inflation in administered prices was particularly high in 2011 (6.3%) 2012 (7.3%) and 2015 (10.5%).
The affordability of housing is a key component of competitiveness. It impacts upon the attractiveness of Ireland as a location for investment and directly impacts on enterprise costs through wage effects, and indirectly determines the price of Irish goods and services. Taking account of the higher cost of mortgage finance in Ireland, only two cities, Amsterdam and London had a higher ‘mortgage affordability index’ in 2015. In terms of rent as a percentage of income, three international cities were found to be less affordable than Dublin. Residential Tenancies Board data for 2016 indicates that private sector rents continued to trend upwards. At a national level, annual growth was 7.8 per cent in Quarter 4, 2016; this compares to 6.6 per cent annual growth in Q3 2016. The standard national average rent in Q4 2016 stood at €986 per month. This is nearly the same as peak rents in 2007. The CSO’s Residential Property Price Index has risen by 52.1 per cent in the five years to February 2016 while year-on-year national growth in the corresponding month was 10.7 per cent.
Chapter 4 – Labour Costs
Figure 8: Total Economy Hourly Labour Costs 19,2016
Total Hourly Labour Costs denominated in Euro are shown in Figure 8. Hourly labour costs in the EU ranged from €4.4 in Bulgaria to €42.0 in Denmark in 2016. At €30.4 per hour (Ireland’s
hourly rate was the 8th
highest in the Euro area, 2% and 12% higher than the Euro area 19 and UK respectively.
Source: Eurostat
Figure 9: Growth in labour costs, annual percentage change, 2011-2016
In 2016, Irish labour costs grew by 1.6% compared with growth of 1.6%, 1.4% and 1.5% respectively in the EU28, the Euro area 19 and the UK. The year-on-year growth rate in Ireland has been below the comparable rate across the EU28 during the period 2011-2016.
Source: Eurostat
19 Eurostat total economy data refers to enterprises with 10 or more employees and excludes agriculture and public administration 0
5 10 15 20 25 30 35 40 45
H
un
ga
ry
P
ol
a
n
d
Spa
in
E
U
2
8
U
n
ite
d
Ki
n
gd
o
m
Ita
ly
E
uro
a
rea
19
Ire
la
n
d
G
e
rma
ny
Finl
a
n
d
Ne
th
e
rla
n
d
s
Fr
a
n
ce
Swe
d
e
n
D
e
n
ma
rk
T
ot
al
labo
u
r
cos
ts
(
€
pe
r
h
ou
r)
2016 2012
-2 -1 0 1 2 3 4 5
2011 2012 2013 2014 2015 2016
Cha
n
ge
on
prev
ious
pe
rio
d
(%
)


copper(I) nitrate](data:image/gif;base64,R0lGODlhAQABAIAAAP///wAAACH5BAEAAAAALAAAAAABAAEAAAICRAEAOw==)