Abstract—Molecular communication (MC) is a nano-bio-inspired communication paradigm that utilizes chemical signaling to convey information over gas and fluid mediums. However, MC reliability is more sensitive to design constraints such as power utilization, and large computation abilities compared with the traditional communications systems. Therefore, there is a need for fast and low-complexity detection schemes to identify the received bits under many sources of noise that are inherent in these channels. In this paper, we propose a novel detection scheme for molecular communication via diffusion (MCvD). Our system model consists of a single transmitter (Tx), a single receiver (Rx), and a free diffusion- based propagation environment. Although our algorithm is designed to perform well for MC systems as a study case, it can be tailored to any traditional communication system as well. Furthermore, our new paradigm can be applied to any modulation system; however, we used a binary ON-OFF keying modulation scheme to modulate the information as the most known modulation scheme used for this type of channel. We have been able to achieve BER as low as 10-5 at signal-to-noise (SNR) levels where classic approaches achieved BER levels of the order of only 10-2. Our approach could be a new path to achieve Shannon limits since we are starting off with excellent BER even without any coding. Hence, with error-correcting coding, the successful detection probability can now reach new highs unseen before, and an easier and faster approach the Shannon limit.
Index Terms—molecular communication, diffusion, molecular concentration, entropy, correlation.
I. INTRODUCTION
molecular communication (MC) system is an emerging communication technology for delivering information to receptors through entirely different mediums such as an aqueous or gaseous environment [1]. In MC, nanomachines (NM) are used to convey information between a transmitter (Tx) and a receiver (Rx) [2]. Neither radio frequency (RF) nor optical wireless communication can efficiently propagate inside mediums where severe obstruction and path loss can occur, as in fluid, body, and tissue-based environments. Thus, the biocompatibility of MC allows it to serve as a reliable communication system in body area networks [3] for various
Manuscript received July 01, 2018; revised July 30, 2018.
Mohammed Alzaidi is with the Stevens Institute of Technology, Hoboken, NJ 07030 USA. Phone:860-771-0661; e-mail: [email protected].
Walid K. M. Ahmed is with the Stevens Institute of Technology, Hoboken, NJ 07030 USA. e-mail: [email protected].
Victor B. Lawrence is with the Stevens Institute of Technology, Hoboken, NJ 07030 USA. e-mail: [email protected].
applications such as drug delivery [4], tumor monitoring [5], and point-of-care diagnostic chips [6].
The MC architecture discussed in [7] is fundamentally different from traditional communication regarding its abilities. Since MC exists naturally over billions of years, it has a limited capability of power and computational abilities. Thus, reduced-complexity fast detection algorithms become a requirement for the designers of MC systems. In the literature, several detection schemes have been proposed and investigated in terms of the diffusion environment and their ways of making detection decisions. In [8] two different detection schemes are introduced. The first is amplitude detection, where the Rx measures the amplitude at a specific time of each symbol duration and compares it with a predefined threshold. The second is the energy detection scheme, where the Rx calculates the energy of the signal and compares it with a predetermined threshold value. Coherent detection techniques that have been applied to traditional communication are tailored for application to MC systems. The maximum-likelihood (ML) sequence detector and the maximum a posteriori detector are introduced in [9]. These methods, used commonly in traditional communication, require a large number of computational operations. However, such schemes seldom take the time and power limitations as the main design constraints. We assume that the Tx and Rx always require a reduced-complexity fast detection scheme capable of working on the noisy received signals and reliably detecting the sent bits.
In this paper, we discuss the performance of a novel detection scheme for MC via diffusion (MCvD) that performs operations of low computational complexity to detect the received packets. As will be explained later in this paper, we propose a scheme that is based on a multi-layered detection approach, which utilizes entropy-based discrimination followed by small-size (N bits) low-complexity correlation operations. Our proposed scheme achieves a significant uncoded bit error rate (BER) where, at low signal-to-noise-ratio (SNR), it still tolerates the noise and has a decent BER compared to with Fixed-Threshold Detection (FTD) scheme [10] and other complex approaches. The remainder of the paper is structured as follows. Section II introduces the system model based on the main process of the MCvD. A novel reduced-complexity fast detection algorithm is detailed in Section III. Section IV provides the simulation results, and Section VI concludes the paper.
Achieving Very Low Un-Coded BER via A
Novel Reduced-Complexity Fast-Detection for
Diffusion-Based Molecular Communications
Mohammed S. Alzaidi,
Member, IAENG
, Walid K. M. Ahmed, and Victor B. Lawrence
II. SYSTEM MODEL
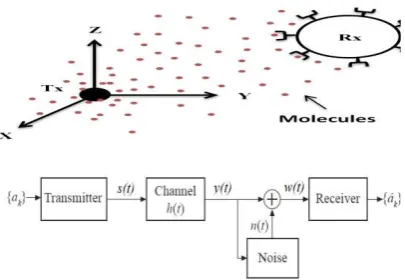
Our MC system model consists of a single Tx, information molecules, a fluid medium, and a single Rx. The Tx and Rx can be either a biological cell/organism or a NM manufactured for this purpose. The 𝑇𝑥 is a point source that releases molecules in the medium. The Rx is a spherical NM that detects those molecules, as illustrated in Fig. 1. We assume that the Tx and Rx are located in a stationary environment where both have become synchronized over time. In this paper, we apply a binary ON-OFF keying modulation scheme with equally likely transmitted binary information bits; however, we did not apply any coding technique to our system model. The Tx encodes information bits {𝑎 } to molecules’ concentrations pulses,
𝑠(𝑡), which can be considered as a rectangular pulse given as [11]:
𝑠(𝑡) = 𝑄 . 𝑎 . 𝑟𝑒𝑐𝑡 𝑡 − 𝑇
2
𝑇 − 𝑘𝑇 (1)
where 𝑇 is the pulse width at the beginning of each symbol duration 𝑇.
Then, the concentration of the molecule pulses s(t) diffuses randomly based on the Brownian motion process until they hit the Rx. In this channel, the propagation relies on factors such as the diffusion coefficient, distance, and time between Tx and Rx. The second Fick’s law of diffusion represents the propagation environment [12]. The concentration of the molecules at the location (𝑥, 𝑦, 𝑧)that diffuse based on the diffusion coefficient
𝐷 over a time period 𝑡 is given by Equation [13]:
ℎ( 𝑡; 𝑥, 𝑦, 𝑧) = 𝑄 4𝜋𝐷𝑡
𝑒 (2)
The response of the diffusion channel 𝑦(𝑡) is the convolution between the modulated signal 𝑠(𝑡) and the impulse response of the diffusion channel ℎ(𝑡).
The total received concentration signal that is detected by Rx, which is caused by sending the original transmitted bits sequence {𝑎 } that distorted through the channel, is donated by
𝑤(𝑡), which can be represented as:
𝑤(𝑡) = 𝑎 𝑦(𝑡 − 𝑗𝑇 ) + 𝑛(𝑡) (3)
where 𝑛(𝑡) is the counting noise generated by the random process. It is assumed to be zero-mean adaptive white Gaussian noise (AWGN) with a variance of σ , i. e., n(t)~ 𝒩(0, σ ).
To mitigate the inter-symbol-interference (ISI), we use the same technique introduced in [14]. Therefore, the Tx sends a number of N-consecutive bits and then becomes silent before sending other N-consecutive bits to mitigate the ISI, as shown in Fig.2. In this paper, we call these N-consecutive bits ‘words’. The received word samples r can be defined as:
𝑟 = 𝑦 + 𝑦 + 𝑛 (4)
where 𝑦 represents the original received bits, 𝑦 is ISI coming from the previous words, and 𝑛 is the AWGN noise.
III. THE DETECTION SCHEME
When detecting a sequence of N-bits together, the transmitted bits state is one of the 2N possible states; therefore, correlating all states to determine which one has the strongest correlation relationship to the transmitted bits requires power and more computational operations. Moreover, if N becomes larger, the number of states will grow by a factorial factor, which increases the difficulty of adapting this method for the MC.
[image:2.595.64.267.86.226.2]Generally speaking, to identify the transmitted bits on the receiver side, we need to answer two characterization questions about the received bits: How many digits (i.e., 1s and 0s) are in the transmitted bits and what is the exact location of the digits considered in this paper (i.e., 1s) in the transmitted bits? We consider only 1s as they represent the information pulses according to the ON-OFF modulation scheme. Our proposed algorithm answers these two questions by passing the received word samples r[k] through two layers, with each layer solving one question. We utilize a statistical discrimination metric, called the entropy (logarithmic) value, to measure the information of the received word as follows:
[image:2.595.327.536.93.269.2]Fig. 1. MC system components
𝐸𝑛𝑡𝑟𝑜𝑝𝑦 = 1
𝑘 𝑙𝑜𝑔 |𝑟 | (5)
where 𝑘 is the number of samples of the received word. For the sake of clarity, in this paper, we use the 8-bit case as the reference case to illustrate how our detection scheme performs the detection. The number of 8-bit states is equal to 255 states, excluding the state of all 8 zero bits.
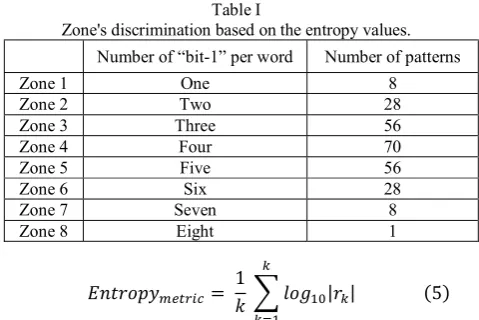
To identify the threshold values that we need to detect the signal, we calculate entropy values for all of the 8-bit states. We found that they are clustered in eight non-overlapping zones, as shown in Table I. Based on these zones; we can identify how many bit-1 digits occur by assigning two thresholds for each zone. The minimum and maximum entropy values among the logarithmic values of the states are considered the lower and upper thresholds, respectively.
A. Layer One: Entropy Layer
This layer aims to identify how many bit-1 digits are in each received word 𝑟[𝑘]. The entropy value of received word 𝑟[𝑘] is also calculated by (5) and compared with the pre-specified zone thresholds. When considering the entropy value, two scenarios can be applied to determine which zone needs to be correlated, as follows:
If the entropy value is related to a specific zone, this zone pattern will be taken to layer two, as indicated in Fig. 1a.
If the entropy value is not related to a particular zone and falls between two zone intervals due to the noise distortion, both zones will be combined and taken to layer two, as indicated in Fig. 1b.
As a result, the entropy metric reduces the number of patterns that we need to correlate instead of correlating all states. Furthermore, for the first scenario, where the received word entropy value falls between the thresholds of a specific zone, layer one limits the second layer to work on, at most, 35 out of 256 states, thereby excluding more than 85% of the states. For the second scenario, where the received word entropy value falls between the thresholds of two zones, the first layer limits the second layer to work with at most 70 states, thereby excluding at most 72% of all states. Therefore, our proposed algorithm saves more power and time as it performs small computational operations.
B. Layer Two: Correlation Layer
We already know the quantity of the bit “1” digits from Layer One. This layer now seeks to recognize the locations of these bit “1” digits. We assume that the Rx has prior stored non-noisy concentration waveforms𝑧[𝑘]. Due to space and power limitations in the MC, we only consider the primary patterns that represent more than one state and equal the same entropy value. For example, for zone 1 where there are eight states that all have only one digit bit “1” and seven digit bits “0”, we only store their primary pattern as shown in Table II.
We use two stages of correlation for Layer Two. At the first stage, The Rx calculates the Pearson correlation coefficient between the received kth word samples 𝑟[𝑘] and the
primary pattern concentration samples 𝑧[𝑘] applying the following formula:
𝛾 = ∑ (𝑟 − 𝑟 )(𝑧 − 𝑧 )
(∑ (𝑟 − 𝑟 ) )(∑ (𝑧 − 𝑧 ) )) (6)
where 𝛾 is the correlation coefficient, 𝑟 is the mean value of
𝑟 and 𝑧 is the mean value of 𝑧 .
Based on that result, the algorithm will choose the primary pattern candidate with the maximum correlation coefficient. At this point, the algorithm reduces the states from 2 to only a single state. The remaining at the second stage of correlation is to identify the delay between the received word samples and the stored samples of the matched pattern. To perform that task, we calculate the time lag by applying the following cross-correlation function formula:
𝑅 = 𝑟[𝑚]𝑧[𝑚 − 𝑘] (7)
[image:3.595.51.291.89.249.2]where 𝑘 is the lag value between the received signal 𝑟[𝑚] and the chosen candidate state.
Table I
Zone's discrimination based on the entropy values.
Number of “bit-1” per word Number of patterns
Zone 1 One 8
Zone 2 Two 28
Zone 3 Three 56
Zone 4 Four 70
Zone 5 Five 56
Zone 6 Six 28
Zone 7 Seven 8
[image:3.595.55.275.613.736.2]Zone 8 Eight 1
Fig. 3 scenarios graphical description
Table II Zone 1 patterns.
All pattern The primary pattern
1 0 0 0 0 0 0 0
1 0 0 0 0 0 0 0 0 1 0 0 0 0 0 0
[image:3.595.316.538.631.740.2]IV. PERFORMANCE EVALUATION
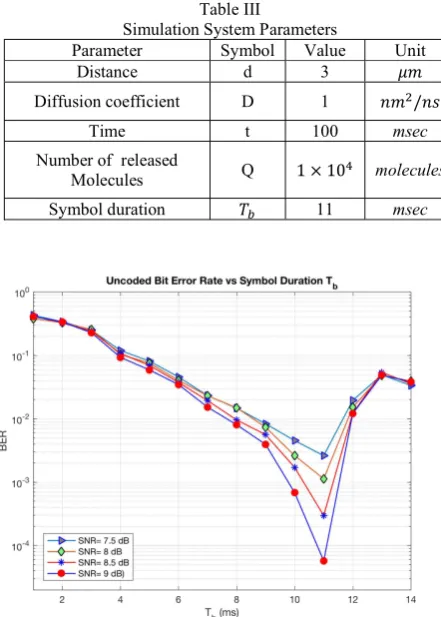
This section describes the simulation results used to evaluate the performance of the proposed algorithm. The simulation environment was built with Matlab. Estimates of bit error rates were done thru Monte Carlo simulations. The simulation parameters are related to a realistic environment [15]. For the evaluation, the main system parameters are summarized in Table 3. The distance between 𝑇𝑥 and Rx is 3 μm; the diffusion coefficient is equal to 1 (nm )/ns, and the number of released molecules is 1 × 10 molecules.
A. Bit Error Rate versus Symbol Duration
First, as shown in Fig. 4., we simulated the BER versus symbol duration to show the most appropriate symbol duration that gives the lowest BER. We found that symbol duration is an important factor that plays a role in sizing the distances between zones. Moreover, if the symbol duration is between 14 msec
and less than 90 msec, the zones overlap and as a consequence BER will increase. As we mentioned earlier in this paper, we are interested in using a small symbol duration to increase as much as possible the data rate. Therefore, we chose to evaluate a duration between 1 msec and 14 msec. Based on the simulation results, we found that at 11 𝑚𝑠𝑒𝑐, the distances between the zones is the largest, which reduces BER.
B. Bit Error Rate versus Signal to Noise Ratio
Second, as shown in Fig. 5., we simulated the BER versus different levels of the SNR for various scenarios
with different bit lengths such as N= 6, 7, 8, and 9. The BER for the length of bits 6, 7 and 8 is almost the same, where we see only minimal changes in the discrimination gaps between the zones. However, with a length of 9 bits, the discrimination distances become smaller due to the ISI. Our proposed algorithm shows a significant low uncoded BER compared to the traditional Fixed-Threshold Detection (FTD) scheme, which has the worst BER.
C. Throughput analysis
[image:4.595.324.539.98.285.2]Finally, as mentioned earlier, we assume that the transmitter sends a group of bits and then waits for a while to give a chance for the ISI molecules in the channel to degrade. Although we may waste some time, we use a very short time symbol duration which raises the ISI in the channel. As seen in Fig. 6, we still gain a much better throughput than if we send it sequentially. The best case that gives us the best BER and throughput is to wait for 209 msec, which within the current literature is still considered a good choice for MC speed during communication.
Table III
Simulation System Parameters
Parameter Symbol Value Unit
Distance d 3 𝜇𝑚
Diffusion coefficient D 1 𝑛𝑚 /𝑛𝑠
Time t 100 msec
Number of released
Molecules Q 1 × 10 molecules
Symbol duration 𝑇 11 msec
Fig. 4. BER vs. Symbol duration
[image:4.595.51.272.428.737.2]Fig. 5. BER vs. SNR
[image:4.595.327.538.539.715.2]V. CONCLUSION
In this paper, we proposed a novel detection scheme for the MCvD channel. The work aims of this to develop a reduced-complexity fast detection scheme. Based on the entropy metric, the proposed algorithm identifies the required zone to correlate and identify the transmitted signal. This metric helps to make detection of a group of bits faster by small computational operations in a short measurement period. To date, most groundbreaking studies pursue detection based on a bit-by-bit discrimination approach, which consumes power and time. Our approach can be applied to any modulation scheme and also can be generalized to be applied to any other traditional communication system. Furthermore, our algorithm allows the system developer the ability to choose the number of bits that are to be detected together (e.g., we simulated N = 6, 7, 8, 9). The simulation results demonstrate that our scheme able to achieve low-un-coded BER as 10-5 at signal-to-noise (SNR)
levels where classic approaches such as FTD scheme achieved BER levels of the order of only 10-2 only. Our method could be
a new path for achieving Shannon limits since we are starting off with excellent BER even without any coding. In future, we will apply error-correcting coding to our promising scheme, which will only get better and better than current/existing systems, and an easier and faster approach the Shannon limit.
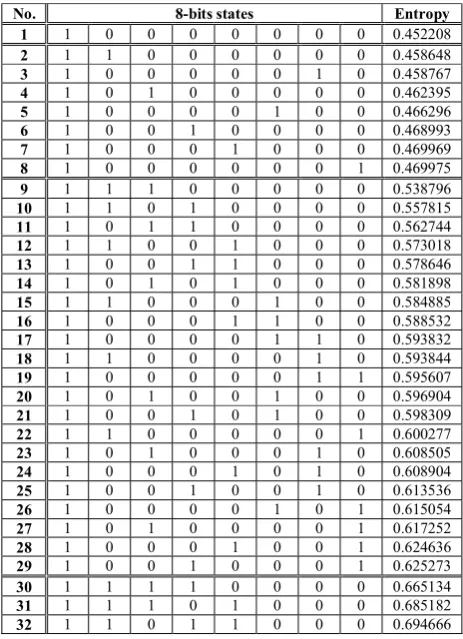
[image:5.595.52.284.435.755.2]APPENDIX
Table for primary patterns of 8-bits entropy documentations
No. 8-bits states Entropy
1 1 0 0 0 0 0 0 0 0.452208
2 1 1 0 0 0 0 0 0 0.458648
3 1 0 0 0 0 0 1 0 0.458767
4 1 0 1 0 0 0 0 0 0.462395
5 1 0 0 0 0 1 0 0 0.466296
6 1 0 0 1 0 0 0 0 0.468993
7 1 0 0 0 1 0 0 0 0.469969
8 1 0 0 0 0 0 0 1 0.469975
9 1 1 1 0 0 0 0 0 0.538796
10 1 1 0 1 0 0 0 0 0.557815
11 1 0 1 1 0 0 0 0 0.562744
12 1 1 0 0 1 0 0 0 0.573018
13 1 0 0 1 1 0 0 0 0.578646
14 1 0 1 0 1 0 0 0 0.581898
15 1 1 0 0 0 1 0 0 0.584885
16 1 0 0 0 1 1 0 0 0.588532
17 1 0 0 0 0 1 1 0 0.593832
18 1 1 0 0 0 0 1 0 0.593844
19 1 0 0 0 0 0 1 1 0.595607
20 1 0 1 0 0 1 0 0 0.596904
21 1 0 0 1 0 1 0 0 0.598309
22 1 1 0 0 0 0 0 1 0.600277
23 1 0 1 0 0 0 1 0 0.608505
24 1 0 0 0 1 0 1 0 0.608904
25 1 0 0 1 0 0 1 0 0.613536
26 1 0 0 0 0 1 0 1 0.615054
27 1 0 1 0 0 0 0 1 0.617252
28 1 0 0 0 1 0 0 1 0.624636
29 1 0 0 1 0 0 0 1 0.625273
30 1 1 1 1 0 0 0 0 0.665134
31 1 1 1 0 1 0 0 0 0.685182
32 1 1 0 1 1 0 0 0 0.694666
33 1 0 1 1 1 0 0 0 0.696361
34 1 1 1 0 0 1 0 0 0.702378
35 1 1 0 1 0 1 0 0 0.714305
36 1 0 1 1 0 1 0 0 0.716068
37 1 0 0 1 1 1 0 0 0.716662
38 1 1 1 0 0 0 1 0 0.716881
39 1 1 0 0 1 1 0 0 0.717567
40 1 0 1 0 1 1 0 0 0.72413
41 1 0 0 0 1 1 1 0 0.728015
42 1 1 1 0 0 0 0 1 0.728771
43 1 1 0 1 0 0 1 0 0.730519
44 1 0 0 0 0 1 1 1 0.731674
45 1 0 1 1 0 0 1 0 0.732607
46 1 1 0 0 0 1 1 0 0.734674
47 1 0 0 1 1 0 1 0 0.735977
48 1 1 0 0 1 0 1 0 0.736915
49 1 0 0 1 0 1 1 0 0.743035
50 1 0 1 0 1 0 1 0 0.743342
51 1 1 0 1 0 0 0 1 0.743722
52 1 0 1 0 0 1 1 0 0.744808
53 1 0 1 1 0 0 0 1 0.746228
54 1 1 0 0 0 0 1 1 0.746531
55 1 0 0 0 1 1 0 1 0.746861
56 1 0 0 1 1 0 0 1 0.751857
57 1 1 0 0 1 0 0 1 0.752286
58 1 0 0 0 1 0 1 1 0.753087
59 1 1 0 0 0 1 0 1 0.753713
60 1 0 1 0 1 0 0 1 0.758843
61 1 0 1 0 0 0 1 1 0.759471
62 1 0 0 1 0 1 0 1 0.761751
63 1 0 0 1 0 0 1 1 0.761825
64 1 0 1 0 0 1 0 1 0.763645
65 1 1 1 1 1 0 0 0 0.791199
66 1 1 1 1 0 1 0 0 0.808222
67 1 1 1 0 1 1 0 0 0.816785
68 1 0 1 1 1 1 0 0 0.819003
69 1 1 0 1 1 1 0 0 0.820754
70 1 1 1 1 0 0 1 0 0.822867
71 1 1 1 0 1 0 1 0 0.833503
72 1 0 0 1 1 1 1 0 0.835152
73 1 1 1 1 0 0 0 1 0.835275
74 1 0 1 1 1 0 1 0 0.835685
75 1 1 1 0 0 1 1 0 0.837133
76 1 1 0 1 1 0 1 0 0.837584
77 1 0 0 0 1 1 1 1 0.841782
78 1 1 0 0 1 1 1 0 0.84218
79 1 0 1 1 0 1 1 0 0.843599
80 1 1 0 1 0 1 1 0 0.844772
81 1 0 1 0 1 1 1 0 0.846078
82 1 1 1 0 1 0 0 1 0.8473
83 1 0 1 1 1 0 0 1 0.849791
84 1 0 0 1 1 1 0 1 0.85143
85 1 1 0 1 1 0 0 1 0.851672
86 1 1 1 0 0 0 1 1 0.8528
87 1 1 1 0 0 1 0 1 0.853644
88 1 1 0 0 0 1 1 1 0.856611
89 1 1 0 0 1 1 0 1 0.858776
90 1 0 0 1 1 0 1 1 0.858778
91 1 0 1 1 0 1 0 1 0.859886
92 1 0 0 1 0 1 1 1 0.860238
93 1 1 0 1 0 1 0 1 0.861214
94 1 0 1 0 1 1 0 1 0.862497
95 1 0 1 1 0 0 1 1 0.86261
96 1 1 0 1 0 0 1 1 0.863009
97 1 0 1 0 0 1 1 1 0.864648
98 1 1 0 0 1 0 1 1 0.864948
99 1 0 1 0 1 0 1 1 0.869057
100 1 1 1 1 1 1 0 0 0.897858
101 1 1 1 1 1 0 1 0 0.912696
102 1 1 1 1 0 1 1 0 0.920312
104 1 1 1 0 1 1 1 0 0.924441
105 1 1 1 1 1 0 0 1 0.925414
106 1 1 0 1 1 1 1 0 0.925675
107 1 0 0 1 1 1 1 1 0.934103
108 1 1 1 1 0 1 0 1 0.934886
109 1 0 1 1 1 1 0 1 0.93651
110 1 1 1 1 0 0 1 1 0.938294
111 1 1 1 0 1 1 0 1 0.939156
112 1 1 0 1 1 1 0 1 0.940291
113 1 0 1 1 1 0 1 1 0.943663
114 1 1 1 0 0 1 1 1 0.944339
115 1 1 0 0 1 1 1 1 0.944466
116 1 1 1 0 1 0 1 1 0.9455
117 1 0 1 0 1 1 1 1 0.946896
118 1 0 1 1 0 1 1 1 0.947134
119 1 1 0 1 1 0 1 1 0.947256
120 1 1 0 1 0 1 1 1 0.949858
121 1 1 1 1 1 1 1 0 0.990659
122 1 1 1 1 1 1 0 1 1.003825
123 1 1 1 1 1 0 1 1 1.010604
124 1 0 1 1 1 1 1 1 1.011221
125 1 1 1 1 0 1 1 1 1.014479
126 1 1 0 1 1 1 1 1 1.016008
127 1 1 1 0 1 1 1 1 1.016332
128 1 1 1 1 1 1 1 1 1.072905
REFERENCES
[1] T. Nakano, A. W. Eckford, and T. Haraguchi, Molecular Communication.Cambridge, UK: Cambridge University Press, 2013. [2] N. Farsad, H. B. Yilmaz, A. Eckford, C.-B. Chae, and W. Guo, “A
comprehensive survey of recent advancements in molecular communication,” IEEE Commun. Surv. Tutor., vol. 18, no. 3, pp. 1887– 1919, Third Quarter 2016.
[3] B. Atakan, O. B. Akan, and S. Balasubramaniam, “Body area nanonetworks with molecular communications in nanomedicine,” IEEE Commun. Mag., vol. 50, no. 1, pp. 28–34, Jan. 2012.
[4] O. Veiseh, J. W. Gunn, and M. Zhang, “Design and fabrication of magnetic nanoparticles for targeted drug delivery and imaging,” Adv. Drug Deliv. Rev., vol. 62, no. 3, pp. 284–304, Mar. 2010.
[5] J. Wang, B. Yin, and M. Peng, “Diffusion Based Molecular Communication: Principle, Key Technologies, and Challenges,” China Commun., vol. 14, no. 2, pp. 1-18, Feb. 2017.
[6] P. Yager et al., “Microfluidic diagnostic technologies for global public health,” Nature, vol. 442, no. 7101, pp. 412–418, Jul. 2006.
[7] T. Nakano, M. J. Moore, F. Wei, A. V. Vasilakos and J. Shuai, "Molecular Communication and Networking: Opportunities and Challenges," in IEEE Transactions on NanoBioscience, vol. 11, no. 2, pp. 135-148, June 2012.
[8] I. Llatser, A. Cabellos-Aparicio, M. Pierobon, and E. Alarcon, “Detection techniques for diffusion-based molecular communication,” IEEE J. Sel. Areas Commun., vol. 31, no. 12, pp. 726–734, Dec. 2013.
[9] D. Kilinc and O. Akan, “Receiver design for molecular communication,” IEEE J. Sel. Areas Commun., vol. 31, no. 12, pp. 705–714, Dec. 2013. [10] G. H. Alshammri, M. S. Alzaidi, W. K. M. Ahmed and V. B. Lawrence,
"Low-complexity memory-assisted adaptive-threshold detection scheme for on-OFF-keying diffusion-based molecular communications," 2017 IEEE 38th Sarnoff Symposium, Newark, NJ, 2017, pp. 1-6.
[11] W. Guo, T. Asyhari, N. Farsad, H. B. Yilmaz, B. Li, A. Eckford, C-B.Chae, “Molecular Communications: Channel Model and Physical Layer Techniques,” IEEE Wireless Communications, vol. 23, no. 4, 2016, pp. 120-127.
[12] M. Pierobon and I. F. Akyildiz, “A physical end-to-end model for molecular communication in nanonetworks,’ IEEE J. Sel. Areas Commun., vol. 28, pp. 602–611, 2010.
[13] W. H. Bossert and E. O. Wilson, “The analysis of olfactory communication among animals.” Journal of theoretical biology, vol. 5, no. 3, pp. 443–69, 1963
[14] M. U. Mahfuz, "Achievable Strength-Based Signal Detection in Quantity-Constrained PAM OOK Concentration-Encoded Molecular Communication," in IEEE Transactions on NanoBioscience, vol. 15, no. 7, pp. 619-626, Oct. 2016.