LEABHARLANN CHOLAISTE NA TRIONOIDE, BAILE ATHA CLIATH TRINITY COLLEGE LIBRARY DUBLIN OUscoil Atha Cliath The University of Dublin
Terms and Conditions of Use of Digitised Theses from Trinity College Library Dublin
Copyright statement
All material supplied by Trinity College Library is protected by copyright (under the Copyright and Related Rights Act, 2000 as amended) and other relevant Intellectual Property Rights. By accessing and using a Digitised Thesis from Trinity College Library you acknowledge that all Intellectual Property Rights in any Works supplied are the sole and exclusive property of the copyright and/or other I PR holder. Specific copyright holders may not be explicitly identified. Use of materials from other sources within a thesis should not be construed as a claim over them.
A non-exclusive, non-transferable licence is hereby granted to those using or reproducing, in whole or in part, the material for valid purposes, providing the copyright owners are acknowledged using the normal conventions. Where specific permission to use material is required, this is identified and such permission must be sought from the copyright holder or agency cited.
Liability statement
By using a Digitised Thesis, I accept that Trinity College Dublin bears no legal responsibility for the accuracy, legality or comprehensiveness of materials contained within the thesis, and that Trinity College Dublin accepts no liability for indirect, consequential, or incidental, damages or losses arising from use of the thesis for whatever reason. Information located in a thesis may be subject to specific use constraints, details of which may not be explicitly described. It is the responsibility of potential and actual users to be aware of such constraints and to abide by them. By making use of material from a digitised thesis, you accept these copyright and disclaimer provisions. Where it is brought to the attention of Trinity College Library that there may be a breach of copyright or other restraint, it is the policy to withdraw or take down access to a thesis while the issue is being resolved.
Access Agreement
By using a Digitised Thesis from Trinity College Library you are bound by the following Terms & Conditions. Please read them carefully.
Characterisation o f Laser Produced
Plasmas
Brendan Doggett
Submitted for the degree o f Doctor o f Philosophy
School o f Physics University o f Dublin
'trinity COLLEGE' 1 5 MAY ^oub
. LIBRARY DUBLIN^
Declaration
This thesis has not been submitted as an exercise for a degree in any other university.
This thesis is entirely my own work, except for the advice and assistance m entioned in the acknowledgem ents and the collaborative work m entioned in the list o f publications.
I agree to allow the library o f Trinity College Dublin copy or lend a section or this entire thesis on request.
Summary
This thesis describes the apphcation o f planar Langm uir probes in laser produced plasmas. The influence o f the ion flow on the probe behaviour and its effect on the m easured plasma param eters has been investigated for different probe orientations. The expansion dynamics o f the laser produced plasm a were studied using the probes and the results obtained were compared to adiabatic expansion models.
The application o f Langm uir probes to the plasm a was considered in terms o f the possible perturbation o f the plasm a and sheath effects. It was suggested that rotating the probe so that its surface was aligned parallel to the flow would eliminate the ion current due to the flow and so increase the accuracy o f the results. In this orientation better agreement was found with the isentropic expansion models. In addition we showed that the plasm a imm ersion im plantation models could be used to describe the ion current to the probe and indirectly determine the electron temperature.
Finally the plume was analysed using an energy selective-tim e o f flight mass analyser. The m ass-to-charge ratios and the energy distributions o f the various ions could be determined and com pared to the energy distributions obtained from the ion probe results.
Acknowledgements
Acknowledgem ents; the last to be written y e t the fir s t (and som etim es only part) to be read.
It w on't do ju stic e to everyone but still '
To my parents, particularly my mother, for selflessly providing m e with every opportunity in life. This thesis is for you guys.
To Andrew, Anita, Lauren, Ruth and Chris; well what can I say? Thanks for your help, lifts, clothes, m oney and for popping in whenever you could. M uch appreciated. As for you Patsy; Happy Birthday! A special mention to Niall; y ou’ve provided some high points over the past few years. Those days and nights in Riso, Flannerys, W helan’s, Neds, the Point, the Vibe and the R D S ...
A special thanks to M aster Reilly and Reverend Cow an for m any interesting debates and pints at PN.
/ Thank you to my supervisor, Jam es Lunney, for giving me the opportunity to complete this work. Your advice and encouragem ent over the past few years is sincerely appreciated. Thanks to Yitzhak Kaufman for some very useful discussion during his time here, to Bo Toftm ann and Jorgen Schou during my time in Roskilde and Crete and to Peter Sheerin and M yles Turner for our collaboration during the past few years. The staff o f the physics department, (school o f physics?) deserve particular mention. To Ken, Joe, Pat, M ick and Dave; thanks for the help in (and outside) the lab.
Thanks to my fellow researchers past and present; particularly m em bers o f group D. Thanks Chris for opening my eyes to the far-east and Lee for giving m e a few black ones in the squash court. I ’ve been very lucky to work with some great guys in group L. W orking backw ards there’s Tonii, Fintan, A m it and Casper am ong m any others; thanks for the help (and coffee), particularly over the last few m onths. I have fond m em ories when I first started o f the three amigos; Tue, Donagh and Eduardo. The m ad dog o f Dingle still lives.
Table of contents
Introduction... 1
Diagnostic Techniques:... 3
Outline of the thesis...5
References:... 7
1. Theory and m odelling... 8
1.1 Laser heating of the target...9
1.1.1 Model Output...11
1.2 Plasma Ionisation...13
1.3 Expansion of the laser ablation plume... 15
1.3.1 Isentropic plasma expansion... 17
1.3.2 Isothermal plume expansion... 23
1.4 Conclusions... 28
1.5 References... 29
2. Experimental M ethods... 31
2.1 Experimental Setup... 31
2.2 Plasma characterisation techniques... 33
2.2.1 Langmuir probe... 33
f 2.22 Energy Selective-Time of Flight Mass Spectrometer... 35
2.3 Estimated errors...38
2.4 References... 39
3. Langmuir P ro b e...40
3.1 Plasma equilibrium... 41
3.2 Probe Regime...45
3.3 Probe theory...48
3.4 Probe Perturbation... 52
3.5 Probe size, sheath and edge effects... 56
3.6 Conclusion 1... 59
3.7 Ion velocity and energy distribution...60
3.8 Probe rotation...62
3.9 Plasma immersion ion implantation...66
3.9.1 Lieberman model... 68
3.9.2 Riemann & Daube model... 70
3.9.3 Sheerin & Turner m odel... 72
Table o f contents
3.11 Conclusions I I ... 74
3.12 R eferences... 75
4. Experim ental R e su lts...77
4.1 Probe o rie n tatio n ... 78
4.2 Plane probe perpendicular to flow ...79
4.2.1 Ion angular distribution... 81
4.2.2 Ion and neutral distribution... 83
4.2.3 Electron tem perature... 85
4.3 Plane probe aligned parallel to flo w ... 89
4.4 PHI M o d e ls... '...91
4.5 Conclusion 1 ... 96
4.6 M ultiply ionised species and contam ination... 98
4.7 Energy Selective-Time o f Flight M ass Spectrom eter... 101
4.8 Conclusions I I ... 110
4.9 R eferences... 111
Conclusions and future w ork... 112
Appendix A: Laser heating m odel... 115
Appendix B: Light transmission calculation... 118
In trod u ction 1
Introduction
In 1954, Charles Townes and Arthur Schawlow invented the maser (microwave amplification by stimulated emission of radiation), using ammonia gas and microwave radiation. By the late 1950s scientists all over the world were trying to develop an optical maser. While employed at Hughes Research Laboratories as a section head in May 1960, Theodore Maiman developed, demonstrated, and patented a laser using a pink ruby medium with silvered ends, for which he gained worldwide recognition. His ruby laser was eight inches long and produced a single pure frequency o f deep red light (694.3 nm). The first gas laser, a helium-neon with a wavelength o f 1150 nm, was produced in December of the same year and during the following years the area exploded with the CO2 and Nd:YAG lasers created by 1964.
Initially, theoretical and experimental studies on the interaction o f laser beams with f solid, liquid, and gaseous materials were carried out. The ease with which material could be vaporised led to the first deposition of a thin film by Smith and Turner in 1965 [1]. However the limitations in the wavelength and the peak power meant that the material selection was limited and the film quality was poor in comparison to other techniques available at the time. It was not until the mid 1970s with two major developments that greater interest in laser technology took place. First, electrically Q-switched lasers became available. These could generate very short pulses with a peak power exceeding 10* Wcm'^. The second advance was the development o f a high-efficiency second harmonic generator to deliver shorter wavelength light. Up until the 1990s the most common lasers used in material science were the CO2 and the Nd:YAG but the availability o f lasers in the ultraviolet regime resulted in a lower absorption depth and hence heated volume. In general, the most useful range of laser wavelengths for material processing lie between 200 to 400 nm, as most materials show strong absorption in this region. Together these two developments widened the material choice and improved the overall film quality.
For the laser material interaction the main parameters are the surface reflectivity at the particular laser wavelength, the optical absorption depth and the thermal diffusion
A,
depth. The optical absorption depth is given by: d^ j = ---, where k is the extinction Auk
Introduction 2
T he therm al d iffusivity is given by:
w here k , a n d Cp are the therm al conductivity, density and specific heat capacity
respectively. T he heat diffusion depth is then defined as:
d„=2(Dt,)^
w here ip is the length o f the laser pulse. In m etals the laser radiation is absorbed by the
excitatio n o f free electrons. T he excited electrons therm alise rapidly by electron-electron collisions, w ith a characteristic relaxation tim e; . E nergy from the electrons is then
transferred to the lattice b y electron-phonon in teractions characterised by; r , , w here
Te « T , .
F or various pulse lengths three situations can arise. F or relatively long pulses, i.e. n anosecond pulses, - ^ T p . The pulse length is sufficiently long for extensive heating
o f the targ et to o ccur resulting in a large m olten zone. F or a 6 n anosecond (ns) pulse the h ea t d iffusion depth in silver, the best co n ductor o f all, is dth ~ 1 fxm, w hich is m uch larger than the optical absorption d epth dopt ~ 20 nm at a w avelength o f 250 nm. F o r picoseconds
p ulses (ps), T e < ^ T , ! ^ T p , the pulse length is at least com parable w ith the electron-phonon
relaxation tim e. In this regim e dth ~ 10 nm for m etals and heating o f the target allow s m olten m aterial to form . F or fem tosecond pulses, (fs), <sc «sc r , , the pulse length is
shorter th an the electron-phonon relaxation by three orders o f m agnitude so in this regim e dth is confined to the surface and heat conduction into the target can be neglected w ithin the tim e duration o f the pulse. The choice o f pulse length and w a velength finally depends on the choice o f laser application.
In trod u ction ^ 3
It is now used to deposit multi-component targets, dielectrics and glasses. Laser ablation using fs pulses has m any interesting features. It has been shown recently to produce nanoparticles during ablation and can have several advantages over more standard techniques.
Laser ablation can also be used in several analytical technique. These include m atrix assisted laser desorption ionisation (MALDI), laser m icro-probe mass spectrometry (LMMS) and laser induced breakdown spectrometry (LIBS). For example LIBS uses a short-pulsed laser (~7 ns) focused on the sample to be analysed to create a plasma. The plasm a consists o f neutrals and charged species and radiates at specific wavelengths depending on the elements. By capturing the light the elem ents are identified by, their specific wavelengths and the abundances are m easured by the intensity o f the light at specific wavelengths.
Diagnostic Techniques:
A plasma, by definition, is charge neutral with equal num ber o f positive and negative charges. Its key param eters are the density and tem perature o f its constituents. There are many techniques available to determine these param eters such as optical spectroscopy, photographic techniques, m ass spectroscopy and charge collection. Optical spectroscopy and interferom etry techniques are particularly useful in analysing the plum e expansion close to the target. Among other methods, relative line intensity m easurem ents are the most
/ common technique to determine the temperature in a laser-produced plasma. This technique is due to the fact that densities o f atoms in various states are proportional to the exponentials o f the negative ratios betw een the excitation energy and the thermal energy. Photographic techniques such as gated ICCD photography can be used to characterise the expansion o f the plum e in vacuum or in the presence o f a background gas [3].
The characterisation by charged species analysis is im portant as the plasm a can be highly ionised with energetic ions (10 - 200 eV), which can influence the growth process during PLD. Techniques such as tim e-of-flight mass spectroscopy (TOFM S) allows mass identification and energy analysis to be performed sim ultaneously and on a shot to shot basis. TOFM S contains various m ethods such as linear-TOFM S where the spectrometer is m ounted along the direction o f the plume expansion, and reflectron-TOFM S where an ion
Introduction 4
Charge collection techniques are possibly the m ost com m on diagnostic technique used to characterise a plasma. The charge is collected using an electrostatic probe
/ imm ersed in the plasm a. The use o f electrostatic probes to obtain localised information of plasm a param eters is a well-established technique dating back to 1923, where it was first introduced by Langm uir and M ott-Smith [4], and as such it is comm only referred to as a Langm uir probe. The literature provides num erous experiments and review articles concerning the device with some o f the m ost com prehensive being by D em idov et al [5] and Chen [6].
Conceptually a Langm uir probe is a very sim ple device. It consists o f a small metallic electrode inserted into the plasm a and connected externally to an electrical circuit. In some cases a honeycom bed structure is used to overcom e secondary electron emission. The circuit allows the probe be biased positively or negatively with respect to the plasma potential and an oscilloscope is then used to determ ine the voltage drop across a resistor. Its m ost com m on application is in recording the TOF spectra o f positive ions within the plume. If the laser produced plasma can be considered to have rapid acceleration then the TOF spectra can be converted into kinetic energy distributions. W hen the current to the probe is m easured for a range o f probe potentials a current-voltage (IV) characteristic is obtained from w hich several plasm a parameters such as density and tem perature can be determined.
Introduction 5
Outline o f the thesis
The aim o f this thesis is to advance the understanding and application o f Langm uir probes in laser produced plasmas. We attem pt to understand the effect o f the plasm a flow on the probe behaviour and provide a new m ethod to determ ine the plasm a parameters.
This thesis can be divided into two m ain themes; a description o f the ablation process, plasm a form ation and subsequent expansion, and the identification and
/ characterisation o f the plasm a using various techniques. The individual chapter content can be summ arised as follows.
Chapter 1: Theory and modelling
This chapter introduces the theory used to develop a num ber o f m odels o f the ablation process. These include a model for the laser heating o f a target and the subsequent evaporation o f m aterial[8]. We also introduce the isentropic hydrodynam ic expansion m odel for a plum e into vacuum by Anisim ov [9] and the isotherm al m odel o f Singh and Narayan [10].
Chapter 2: Experimental method
The experim ental setup is presented in this chapter. Techniques that are used for the analysis o f the plasm a such as a Langm uir probe and a m ass-to-charge analyser will be introduced. Finally estimates o f the errors will be presented.
Chapter 3: Langmuir probe
Introduction ' 6
Chapter 4: Results
This final chapter presents the general results obtained for the ablation o f silver. The results o f particle density and tem perature from different probe orientations are compared and finally the results from the m ass-to-charge analyser are presented.
Appendix A:
Laser heating m odel Appendix B:
Light transm ission technique Appendix C:
Introduction 7
References:
1. Smith, H.M. and Turner, A.F., Applied Optics, 4: p. 147(1965). 2. Dijkkamp, D., et al.. Applied Physics Letters, 51(8): p. 619(1987).
3. Geohegan, D.B. and Puretzky, A.A., Applied Physics Letters, 67(2): p. 197(1995). 4. Langmuir, I. and Mott-Smith, H.M., Gem. Electr. Rev., 26: p. 731(1923).
5. Demidov, V.I., Ratynskaia, S.V., and Rypdal, K., Review o f Scientific Instruments, 73(10): p. 3409(2002).
6. Chen, F.F., Introduction to plasma physics and controlled fusion. 2nd ed. 1984, New York: Plenum Press.
7. Riemann, K.U., Journal o f Physics D (Applied Physics), 24(4): p. 493(1991). 8. Lunney, J.G. and Jordan, R., Applied Surface Science, 127-129: p. 941(1998). 9. Anisimov, S.I., Luk'yanchuk, B.S., and Luches, A., Applied Surface Science, 96-
98: p. 24(1996).
1. Theory and M odelling 8
1. Theory and modelling
The laser solid interaction and plasm a form ation is a com plicated process since the laser
absorption and subsequent material removal are characterised by different but
interconnectm g processes. The laser ablation process is generally broken into two stages.
The first is the evaporation and ionisation o f m aterial from the target and the second is the
plume expansion. The laser light strikes the target and interacts with the electrons in the
solid. The excited electrons then collide with the lattice phonons and transfer the absorbed
energy to the lattice. Since the energy relaxation tim e is o f the order o f ps for metals [1 ,2 ]
the optical energy can be thought o f as being instanteously turned into heat for ns ablation.
The reflection o f the laser light from the target is an im portant param eter which
affects the efficiency o f the ablation. For m etals in the UV regim e it can be quite low, for
example silver at 248 nm the reflectivity is 0.25. As the laser heats the target the
tem perature increases rapidly with tem peratures up to several thousand Kelvin easily
achieved and as a result vaporisation becomes significant. The plasm a, which primarily
consists o f atoms, ions and electrons may also contain nano and m icro-particles. As the
plasm a is produced in front o f the target, it will begin to absorb the incom ing light leading
to further heating and ionising o f the plume and a reduction in the laser intensity reaching
the target. The laser light is absorbed prim arily by inverse Brem sstrahlung (IB) (electron-
neutral or electron-ion), which involves the absorption o f a photon by a free electron
(within the field o f a heavy particle to conserve m om entum ) and by direct single-photon
excitation processes. For IR laser ablation absorption by IB is dom inant while for visible
and U V w avelengths, photoionisation is the dom inant ionisation process. At the end o f the
pulse the layer o f plasm a can be tens o f m icrons thick and have a high internal pressure
which drives its subsequent expansion.
In the literature a variety o f models for laser ablation exist for various experimental
conditions [3]. A large num ber are based on thermal processes, w hich describe the k se r-
target interaction using the thermal heat conduction equation [4]. This is suitable for ns
pulses w hereas for ps and fs a two-tem perature m odel is needed as the optical energy
cannot be considered as being instantaneously turned into heat [5].
The first step o f modelling laser ablation for a solid is usually to determine the
1. Theory and Modelling 9
1.1 Laser heating of the target
The following model is similar to that developed by Jordan and Lunney [6] and we present the main features here. We described in the introduction that for ns pulses the penetration depth is much less than the heat diffusion depth and so the energy flux from the laser can be treated as a source term at the surface. One-dimensional heat conduction equations can be used since the laser spot dimensions are orders o f magnitude larger than the heat conduction depth. It is then possible to use Duhamel’ s theorem [7] to describe the surface temperature change o f the target for a time-varying heat source [8].
/
, N 1 V l ( t - T )
T s (t) = - ^ = ( - V ^ T (1.1)
^ K p K C p J Vt
where I is the energy flux at the target surface, and k, p and Cp are the thermal conductivity, mass density and specific heat capacity o f the target respectively. The irradiance. I, contains a term that takes into account absorption by the evaporated particles, . The
irradiance is expressed as follows:
[ (t ) = ( l - R ) l | ( t ) e x p *^vapP vap COS0
( 1.2)
vap I ( t ) = j j v a p d - C
Ii is the input laser intensity at the target before accounting for the reflectivity o f the target surface, R. The intensity was obtained by fitting the laser pulse profile measured using a fast photodiode, is the photo-absorption cross-section at the laser wavelength
and is taken as the threshold value o f the hydrogen-like photoionisation cross-section.
From [9] it is o f the order 10^'^cm^. 0 is the angle o f incidence o f the laser beam with respect to the target normal , p^^p is the total number o f vapour particles accumulated up to
a time t, and finally jvap is the evaporation rate.
1. Theory and M odelline 10
( 1.3)
where u is the atomic mass unit, Mmoi is the m olar m ass and ps is the pressure above the surface. An additional factor is sometimes included to account for recondensation at the surface and is referred to as the sticking coefficient ‘s ’.
In the case where a material evaporates as single atoms or molecules the vapour pressure above the surface is commonly expressed in terms o f latent heat o f evaporation per particle ( L ^ ) in the form o f the Clausius-Clapeyron equation;
Ps — = exp
Po B V 0 ‘ s y
( 1.4 )
1. T heory and M odelling 11
1.1.1 M odel O utput
From the previous calculations it is possible to estimate some of the ablation parameters. Fig. 1.1 shows the output from the model for the change in surface temperature and ablation rate with fluence. As yet, other parameters that affect the ablation process such as re radiation from the plasma and change in reflectivity due to surface roughening are not included.
4000-3.1 Jem' - -2.1 Jem - — 1.1 Jem
3000-B 2 0 0 0
-I -
1000-0 20 40 60 80 100
T im e (ns)
3.1 Jem' -2.1 Jem' 1.1 Jem' 10°
-Q .
10'
--9 10
40 6(
Tim e (ns)
100
[image:19.552.16.544.31.794.2]1. T heo ry a n d M odelling 12
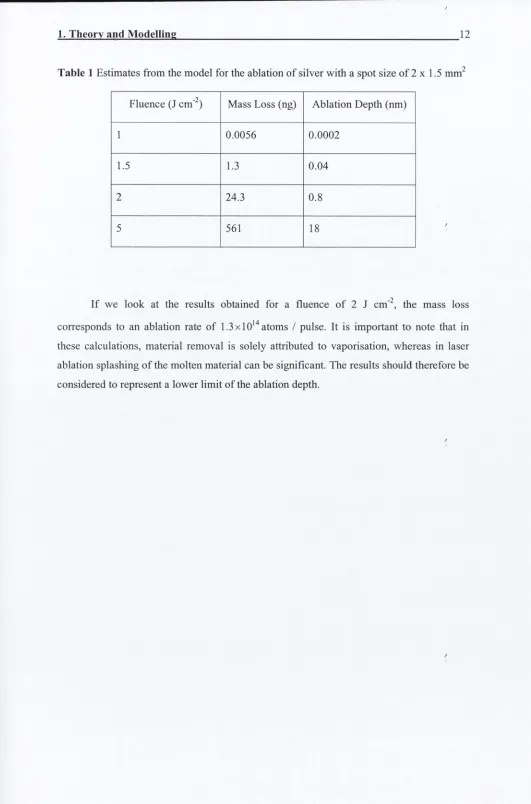
T ab le 1 Estim ates from the model for the ablation o f silver with a spot size o f 2 x 1.5 mm^
Fluence (J cm'^) Mass Loss (ng) A blation Depth (nm)
1 0.0056 0.0002
1.5 1.3 0.04
2 24.3 0.8
5 561 18
If we look at the results obtained for a fluence o f 2 J cm'^, the m ass loss
[image:20.552.9.540.0.804.2]1. Theory and M odelling 13
1.2 Plasma Ionisation
f
A m ean ionisation, Z , is often assigned to the plasma. W e shall estimate the mean ionisation o f the plume using the semi-analytical approach by Z el’dovich and Raizer [9]. A comparison with a plasm a physics code “FLY” by Lee [10] w as carried out in the thesis of
by Z el’dovich and Raizer starts with the Saha-equation relating the particle populations of the various ionisation stages in the plasma, with the plasm a assum ed to be in local therm odynam ic equilibrium. From the Saha equation:
where ne and n^ are the electron density and ion density o f the m ionised ion. gm is the statistical weight o f an m -ion in its ground state and Im+i is the ionisation potential o f the m-ion in its ground state.
The m ethod is based on two steps. First it is assum ed that the ion num ber density Hm and the ionisation potentials Im+i are considered to be continuous functions o f the ionic charge m. These are obtained by connecting the discrete values o f nm and Im+i by a continuous curve. The system o f recurrence relations defined by the Saha equation can then be transform ed into a differential equation for the fijnction n(m) by replacing the finite differences by differentials:
Hansen [11] and showed good agreem ent with the analytical approach. The approximation
(1.5)
( 1.6)
The Saha equations can then be replaced with one differential equation:
V \ /
(1.7)
where A = 2 x = 4 .8x10 IV m ^ = 6 x l 0 w cm ^ . It is assum ed that
1. Theory and Modelling 14
The distribution function n(m) has a very narrow and sharp peak about some value nimax which depends on the density and temperature o f the plasma. The second step is to assume that the average value o f the ionic charge, i n , is equal to the value mmax where the function n(m) has a maximum. The narrower and more sharp this peak is, the better the approximation.
Finally it is argued that the average value o f the ionisation potential should be referred to the point m + ^ on the graph o f Im+i vs. m. This results in the following
transcendental equation for iri(T ,n ), which can be used to predict the mean ionisation:
l|m + ^ j = kTln
mn (1.8)
Starting with a value o f m and temperature, the right hand side can be calculated. Then using the interpolation curve o f Im+i vs. m a new value o f m is found and this is continued until the value converges. This is then the average ionic charge, Z = m .
40
■ S ilv e r io n is a tio n p>otential I n te r p o la tio n
25 S 20
S 10
1 2 3
0
3.0
T .(e V )
2.5
-•10 I N
2.0
-c o « 'co c CO 0) S
0.5 -0.0
10’“
D e n s ity , n (c m )
(a) (b)
Fig. 1. 2 (a) The interpolation curve to the ionisation potential used with
(1.8) for the calculations in (b). (b) The average ionic charge as a function o f density.
If we take the results from the model in the previous section, for a fluence o f 2 J cm'^ the ablation rate was 1.3 x lO'"^ atoms / pulse. For the spot size o f 2 x 1.5 mm^ and
18 ^
[image:22.552.17.539.22.605.2]1. Theory and Modelling 15
1.3 Expansion of the laser ablation plume
At the end o f the laser pulse there remains a dense layer o f plasma (lO ’^ - lO’^ atoms) with initial dimensions X^.Y^and Zo(Fig.l.3). and Y(,correspond to the laser spot dimensions and can be tens o f microns thick.
Fig.1.3. The initial dimensions o f the plasma plume at the end o f the laser pulse, t = 0, and its dimensions after a time t.
1. Theory and M odelling 16
the plasma travels through the gas experiencing little or no collisions, while a slower component is form ed after it interacts with the gas, losing m om entum and decelerating. After a period o f time the two components will be spatially separated. It is generally characterised by the detection o f two peaks in TOF studies o f the plasma.
1. Theory and M odelling 17
1.3.1 Isentropic plasma expansion
Anisim ov treated the adiabatic expansion o f a one-com ponent vapour cloud into vacuum using a particular solution o f the gas-dynamic equations, w hich applies when describing flows with se lf sim ilar expansion. It is assum ed that the form ation time o f the vapour cloud is m uch less than its expansion time and that the focal spot o f the laser has an elliptical shape with sem i-axes and Yq. The expansion is m odeled as a triaxial gaseous semi ellipsoid whose semi-axes are initially equal to and » CgXp, where Xp is the duration o f the laser pulse, and c^ is the sound speed in the vaporised m aterial given by:
y is the ratio o f the plasm a specific heats and e = j ( Ep is the energy o f the plume and
Mp is its mass) . The adiabatic index, y, o f a gas is the ratio o f its specific heat capacity at constant pressure (Cp) to its specific heat capacity at constant volum e (Cv). To understand the definition, consider the following experiment: A closed cylinder with a locked piston is filled with air. This cylinder is heated. Since the piston cannot move the volume is^ constant. Tem perature and pressure rise. Heating is stopped and the energy added to the system, which is proportional to Cv, is noted. The piston is now freed and m oves outwards, expanding without absorbing energy (adiabatic expansion). Doing this work (proportional to Cp) cools the air to below its starting temperature. To return to the starting temperature the air must be heated. This extra heat amounts to about 40% o f the previous amount. Thus air has an adiabatic index o f approxim ately 1.4. For a laser produced plasm a values in the range o f 1.1 - 1.4 have been reported [16].
The gasdynam ic equations are:
p
1. Theory and M odelling 18
w here p, p, v and S are the density, pressure, velocity and entropy o f the gas respectively.
It is assum ed th at the flow p aram eters are constant on ellipsoidal surfaces and the density
and pressure profiles can be w ritten as:
P ( r ,t) =
P (r,t) =
M
I.(Y)XYZ
E
y^
I , (y) X Y Z
r x o Y o Z jT-l
r,
X Y Z 1 X s> N
1
(1.1 0)
w here M = jp ( r ,t ) d V is the m ass and E = ( y - 1 ) '|p ( r , 0 ) d V is the initial energy o f the
vapor cloud. Ii and I2 are functions o f gam m a and are equal to:
I,(Y) =
i r
a +-(1.1 1)
h ( y ) =
-n^r{a + 2)
2(y-\)r
a + — 12
w here F (z) is the G am m a-function. F or the pressure and density pro files d efined by (1.10)
and w hen the initial v apour cloud is isentropic ( a = l/y - 7 ), the entro p y depends on the
coordinates and tim e as:
-ln<
Y-1 ^(y) XoYoZ„
I , (y) XoYqZ,
M
Y - l
( Y - l ) (1.12)
U sing (1.10) and (1.11), the gas-dynam ic equations ca n be red u ced to a set o f ordinary
1. Theory and M odelling 19
U =
-5 U
d X
5 U
5 Y
5 U
d Z
5 y - 3 E [ X oYoZoT
Y - l M X Y Z
(1.13)
The initial conditions for (1.13) are set as:
X ( 0 ) = X „ , Y ( 0 ) = Y „ , Z ( 0 ) = Zo
X ( 0 ) = Y ( 0 ) = Z ( 0 ) = 0
(1.14)
In order to integrate (1.13) numerically, the following dim ensionless quantities are
introduced, using Xo as a spatial scale length:
^^ = Tin = CC =
HoCo
Y - l(1.15)
with initial conditions:
^(0) = l,ri(0) = Ti„,C(0) = i;o
4(0) = fi(0)=4(0) = 0 (1.16)
where:
^ X Y ^ Z
V Y
Aq Aq Aq
t p ^ Yo
T = — , n o = ^
X„ M„
(1.17)
W here Ep is the plum e energy and Mp is the plum e mass. Eqn (1.15) is solved using a
1. Theory and M odelling 20
m athem atical m eth o d used can be found in [11], F rom (1.10) w e can obtain the m ass flux
in the Z direction:
F (z, t) = p (x , y, z, t)v^ (x , y, z, t)
v , ( x , y , z , t ) = ^ Z
(1.18)
T he tim e-o f-flig h t d istribution for a plum e can be expressed in units o f j / ^ :
F((t),t) dt ^
mI, ( Y) z
-^ l + tan-^(j)
3 / 2
I--' dt
l^l + k^tan^(j); t^ < . (1.19)
tf is the lead in g edge arrival tim e and k is the p lum e edge ratios. T he expression for
tem perature from the m odel is:
T = 8 (5y- 3 ) (y- 1 )
^ y V 7 ^
Y - 1
1
2y I X Y Z ;
U J
(1.20)
w here e = P m (5 y - l ) ' is the energy p er particle. It can be seen that the m odel depends on
tw o pure g eom etric param eters (Xo and Yo), w hich are related to the shape o f the laser
spot, and a th ird p aram eter related to the dim ension o f the plasm a perp en d icu lar to the
target surface after the laser pulse has elapsed (Zo). T his p aram eter depends on the physical
pro perties o f the plasm a through y. F o r a sudden ex p an sio n o f a gas into vacuum the
velocity o f the expansion front (v/) is related to the sound speed through the follow ing
expression [11]: ,
1. Theory and Modelling 21
0.8
-0.6
-> Density
T em perature Velocity
0,4 -o Cl
0.2 -Cl
0.0
0.6 0.8 1.0
0.0 0.2 0.4
Flux Temperature
0.8
-K
0.6
-0.4 -lu \±.
0.2
-0.0
0 1 2 3 4 5
z / Z t / t ,
(a) (b)
Fig. 1.4 (a) The spatial variation of the density, temperature and velocity within the plume.
Z is the plume edge and y was taken as 1.25. (b) The flux (1.19) and the temperature (1.20)
variation at a distance from the origin. The time is normalised to the front arrival time, tf.
Fig. 1.5 shows the solution for some typical experimental conditions. For these results we
took a rectangular spot with the ratios Xq: Yq: Zq = 1; 0.4: 0.13 and y = 1.25. We can see
that at T > 1, the Y dimension is greater than the X dimension showing the rotation of the
semi-axis of the ellipsoid. We can also see that the acceleration phase lasts until t ~ 5.
2.0
-Y / X
0.5
-0.0
1 10 100
0.1
T
[image:29.552.7.547.21.751.2]1. Theory and Modelling 22
The angular dependence of the number o f particles arriving per unit area normal to the
flow, (<})), can be found by integrating (1.18) from the arrival time, tf, to infinity. /
If tf »X o/p'^^ the analytical expression for F((j)) /F(0) in the plane x-z will be:
M
-F(0)
1 + tan^ (j)
(l + (k^)tan^{|)) ( 1.22)
k is the ratio o f the plume edges, eg kx = Z/X and ky = ZfY, and essentially describes the plume elongation. For example, k = 1 describes a spherical expansion.
Equation (1.22) describes the deposition per unit area on a hemisphere, whereas for a / planar surface this is rewritten as:
(1.23)
From the Anisimov model the ion flux along the z axis can be written as:
N
■Ak2 ZVf
Ii(y) (Vft)' ( v ) /y - 1
(1.24)
By simplifying this equation, an experimental ion flux signal can be fitted where: '■
1 = B ZVf
(vftr
(v ft) V1(1.25)
The parameter B, depends on the initial parameters and can be let vary to obtain the best
fit. z is the distance from the target andvj- is the plasma front velocity. From (1.25), the
dl ^ maximum current occurs when — = 0.
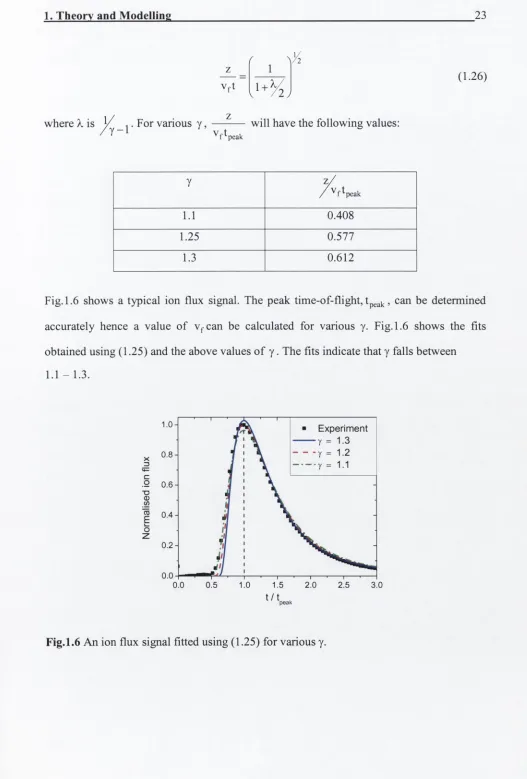
1. Theory and Modelling 23
V f t 1 +
(1.26)
where is
Y
i ■ various y , — ^— will have the following values;7
V
/
^peak1.1 0.408
1.25 0.577
1.3 0.612
Fig. 1.6 shows a typical ion flux signal. The peak time-of-flight, tp^^^, can be determined
accurately hence a value of v^can be calculated for various y. Fig. 1.6 shows the fits
obtained using (1.25) and the above values of y . The fits indicate that y falls between
1.1 - 1.3.
Experiment
0,8
-.2 0.6
-■ D <D to
03
E o 2
0.4
-0.2
-0.0
0.0 0.5 1.0 1.5 2.0 2.5 3.0
[image:31.552.15.542.16.795.2]1. Theory and Modelling 24
1.3.2 Isothermal plume expansion
The plasma expansion has also been modeled by Singh and Narayan [15], using a uniform
temperature, self-similar solution o f the gas dynamic equations. In their work the laser-
solid interaction is divided into (i) interaction o f the beam with the bulk target, and (ii)
plasma formation, heating and initial isothermal expansion. After the laser pulse they
describe the adiabatic expansion o f the plume. From the model the density (n) o f the
plasma at any point (x, y, z) at time t, can be expressed as a Gaussian function given by:
where N j is the total number o f particles at the end o f the laser pulse, A is the probe area,
and X ,Y and Z are the dimensions o f the expanding plasma, and correspond to the
distance at which the plasma density decreases to 60.65 % o f its maximum. Similar to the
previous model we can fit this equation to an experimental signal.
(1.27)
from which the ion flux can be written as:
(1.28)
1 0 - ,1^ ■ E x p e r im e n t ■
o
z c
X
D
CO
E
u .
0 5 10 15 20 25 30
T i m e (^ s)
1. Theory and M odelling 25
The Anisim ov as well as the Singh and N arayan m odels have the following
differential equations, which describe the propagation o f the plume.
d'X d'Y d^Z
dt^ dt"
rX o Y o Z o 'v-i
1
o
< 1
X Y Z V
v-i
(1.29)
where A = ( 5 y - 3 ) for Anisim ov and A = ® p/ ^ for Singh and N arayan’s model.
This equation includes all the plume features observed experim entally such as:
• Strongly peaked in the direction perpendicular to the target surface
• The flip-over effect
The strong peaking o f the plume is due to the fact that the acceleration o f the front
in the Z direction j proportional t o ^ . Since Zo is less than either Xo or Yo, the
acceleration is m uch greater away from the target. The flip-over effect will occur because
if Xo is less than Yq, the plume will have greater acceleration in the X-direction.
The adiabatic expansion m odels o f Anisimov and Singh and Narayan have proved
to be very useful for the understanding and interpretation o f laser ablation experiments.
Both m odels consider the adiabatic expansion o f a small volum e o f hot gas into vacuum,
with the dimensions o f the volume o f gas chosen to correspond to the dim ensions o f the
vaporised m aterial at the time when evolution and heating o f the ablated material is
complete. For ns ablation this time corresponds to the end o f the laser pulse. The Anisimov
m odel considers the expansion o f the plum e to be isentropic, w hich essentially means that
there is no heat conduction betw een parts o f the plume. On the other hand the Singh and
Narayan model m akes the assumption that the plume is isotherm al at all times. There is
clearly a need to establish which o f these extreme constraints is more appropriate [17].
Though the expansion model o f Anisim ov was developed for the expansion o f a
neutral gas, it seems to agree with Langm uir probe m easurem ents in ablation plumes [ 16,
18]. The density gradients in the plasma drive the expansion, which leads to supersonic
flow. Since the gradient is greatest normal to the target the acceleration o f flow is greatest
in the same direction, resulting in the usual forward directed ablation plume. Considering
1. Theory and M odelling 26
rate is sufficient to m aintain the equality o f tem perature betw een the electrons and ions, i.e
T e=T j=T . Thus the plasm a pressure will be:
where nj is the ion density, Z is the m ean ion charge, k is the Boltzm ann constant and T is the temperature. Since the Debye length is m uch sm aller than the plasm a dimension we
analysis o f Attwood [19], it can be seen that there are two contributions to the gradient o f plasm a pressure. The first is due to the ion density gradient:
where y is the ratio o f specific heats. This is the sam e starting point as used by Anisimov in his analysis o f the expansion o f a small volume o f hot vapour. Thus it is valid to use the m odels developed by Anisim ov and Singh and N arayan to describe the expansion o f ionised laser ablation plumes. However the following question rem ains; is the expansion isentropic or isotherm al? Essentially we w ant to know if electron heat diffusion is sufficiently rapid to keep pace w ith the plasm a expansion. Taking the Spitzer formula [20] for the thermal conductivity o f a plasm a it can be shown that heat will diffuse a distance s, in time t, given by:
P = nj(Z + l)kT (1.30)
/
can ignore the influence o f charge separation on the expansion dynamics. Following the
5x 9x (1.31)
Secondly the gradient o f electron density gives rise to an am bipolar electric field:
en^ dx eng (?x (1.32)
which o f course will act on the ions. The ion m om entum equation is given by:
1. Theory and M odelling 2 7
2 9 . 3 x l O ' ^ T ^
s - t ( 1 , 3 4 )
Z ( Z + ljrij
w here T is in eV and n; in c m '^ The rate o f plasm a expan sio n is o f the sam e ord er o f the
ion sound speed , and in one dim ension the length /, o f a freely expanding plasm a after
tim e t, is approxim ately:
/ = c t = 9 .7 9 x l0 ^
^yZT^^2
^
j(1.35)
w here M is the atom ic w eight. F or as long as the expressio n is ap p roxim ately o n e
dim ensional; rij/ = n ^ d , w here ns is the atom density in the target and d is the ablation
depth. Thus:
Substituting for nj in (1.34) leads to:
n - ^ (1.36)
2 9 . 3 x l O '^ T ^ ,
s = 7 /7 ^ , X ■ (1.37)
ZlZ + ljn^d
F or an isentropic plasm a expansion w e require that s < / , w hich from (1.35) and Q .37)
yields:
T^ < 1 . 0 5 x l 0 - ‘V ^ Z ^ ( Z + l ) n , d M '^ (1.38)
T aking y = 5 /3 , Z = 1, d = 10'^ cm and for A g, ns = 5.86 x 10^^ cm^ and M = 108 we get:
T < 1 2 .4 e V (1.39)
T hus it w ould seem that for typical ns ablation co n d itio n s the p lum e expansion m ay be
treated as isentropic if the plasm a tem perature is less than about 12 eV , w h ich is norm ally
1. Theory and M odelling 28
1.4 Conclusions
This chapter set out to describe the laser ablation process and to indicate some typical
f
plasm a conditions. The ablation model in section 1.1 enables us to estimate the plasma
yield for a range o f fluences. For a typical fluence used throughout this o f
2 12
1.5 J cm ' the m odel predicts an ablation yield o f 7 x 10 particles / pulse. The thickness of
the plasm a at the end o f the pulse is calculated indirectly from an estimate o f the initial
sound speed in the plum e as described in the isentropic model o f Anisimov. The thickness
was determined to be approxim ately 50 fim, which gives a density o f 5 x lO'^ particles /
cm^. The ionisation model can then be used to assign a m ean ionisation to the plasma. At
the end o f the laser pulse, the electron tem perature can be betw een 2 - 3 eV. The average
ionisation is then predicted to be between 2.5 - 3.5.
The behaviour o f the plume has been m odelled by Anisim ov and can be used to
describe the expansion and distribution in vacuum. It provides a description o f the ion flux
and tem perature in terms o f the ratio o f the specific heat capacities (y). Fits to some
experimental data indicate it lies between 1.1 - 1.3. The sharp edges o f the pressure and
density profiles at the front at which the density is equal to zero, m eans that the
tem perature at the edge approaches zero as well. This is in contrast to Singh and N arayan’s
model, in which the tem perature o f the plume is considered constant. Singh and N arayan’s
m odel assumes the plume is isothermal, i.e.VT = 0, and that the variation o f the density is
1. Theory and M odelling 29
1.5 References
1. Miller, J.C. and Haglund, R.F., Laser ablation and desorption. Experimental
methods in the physical sciences, v.30. 1998, San Diego ; London: Academic.
2. Wang, X.Y., Riffe, D.M., Lee, Y.S., and Downer, M.C., Physical Review B / (Condensed Matter), 50(11): p. 8016(1994).
3. Bogaerts, A., Chen, Z., Gijbels, R., and Vertes, A., Spectrochimica Acta - Part B
Atomic Spectroscopy, 58(11): p. 1867(2003).
4. Amoruso, S., Applied Physics A: Materials Science and Processing, 69(3): p.
323(1999).
5. Wellershoff, S.S., Gudde, J., Hohlfeld, J., Muller, J.G., and Matthias, E.,
Proceedings o f the SPIE - The International Society fo r Optical Engineering,
3343(pt.l-2): p. 378(1998).
6. Lunney, J.G. and Jordan, R., Applied Surface Science, 127-129: p. 941(1998).
7. Carslaw, H.S. and Jaeger, J.C., Conduction o f heat in solids. 2nd ed. 1986, Oxford:
Clarendon.
/
8. Ready, J.F., Effects o f high-power laser radiation. 1971, New York ; London:
Academic Press.
9. Zel'dovich, I.A.B. and Raizer, I.P., Physics o f shock waves and high-temperature
hydrodynamic phenomena, ed. W.D. Hayes and R.F. Probstein. 1966, New York ;
London: Academic P.
10. Lee, R.W., Whitten, B.L., and Stout, R.E., II, Journal o f Quantitative Spectroscopy
and Radiative Transfer, 32(1): p. 91(1984).
11. Hansen, T.N., Ion outflow and soft X-ray radiation from a micro capillary
discharge source and laser produced prisma. 2002, Dublin: Trinity College.
12. Itina, T.E., Hermann, J., Delaporte, P., and Sentis, M., Applied Surface Science,
208-209: p. 27(2003).
13. de Posada, E., The influence o f the laser induced plasma in the pulsed^laser
depositon ofZnO . 2005, Dublin: Trinity College.
14. Anisimov, S.I., Luk'yanchuk, B.S., and Luches, A., Applied Surface Science, 96-
98: p. 24(1996).
1. Theory and M odelling______________________________________________________. 30
16. Hansen, T.N., Schou, J., and Lunney, J.G., Applied Physics A (Materials Science
Processing), 69(suppl.): p. 601(1999).
17. Lunney, J.G., Doggett, B., and Kaufman, Y., Langmuir probe diagnosis o f laser
ablation plasmas. Submitted Journal o f Physics, Conference series, (COLA ’05).
18. Toftmann, B., Schou, J., and Lunney, J.G., Physical Review B (Condensed Matter
and Materials Physics), 67(10): p. 104101(2003).
19. Attwood, D.T., Soft x-rays and extreme ultraviolet radiation : principles and
applications. 2000, Cambridge: Cambridge University Press.
20. Spitzer, L., Physics o f fully ionized gases. 2nd revised ed. Tracts on Physics and
Astronomy;no.3. 1962: Interscience.
21. Toftmann, B., Schou, J., Hansen, T.N., and Lunney, J.G., Physical Review Letters,
2. Experim ental methods 31
2. Experimental Methods
The basic equipm ent required for plasm a production and characterisation has been
discussed in detail elsewhere [1]. This chapter only serves to summ arise the features o f the
setup used for the plasm a formation and the specifications o f the characterisation
techniques used throughout this thesis. In general the requirem ents can be split into two
distinct sections. The first consists o f the laser, capable o f delivering up to a few hundred
m illijoules per pulse, a vacuum chamber in which the ablation is carried out and a substrate
if required where the plasm a plume deposits a thin film. The second section includes the
various m ethods and techniques used for the characterisation or monitoring o f the
deposition process. These can include RHEED and surface reflectivity for analysing thin
films, and electrostatic probes, optical absorption / em ission spectroscopy and energy
analysers for characterising the laser ablation plume.
2.7
Experimental Setup
In this thesis a Lam bda Physic KrF (LPX 100, 248 nm, 26 ns pulse width) excimer
laser was used for m ost o f the ablation. W e used an aperture to select a rectangular part of
the beam to m inimise hotspots and imaged it onto the target using a 30 cm focal length
lens. This results in a final spot o f approximately 1 m m x 0.5 mm. The fluence was varied
using the focusing lens. The average energy per pulse was m easured inside the chamber
using a Scientech therm opile joulem eter, which was calibrated against a known electrical
2. Experimental methods 32
Imaging Lens
Focusing Lens
Aperture
Rotating Target
Fig.2.1 A Schematic o f the laser ablation setup.
The work was carried out in a stainless steel barrel chamber (15 litres) with an
obtainable base pressure o f 5 x lO ”^mbar (with baking) using a Pfeiffer-Balzers TSH 050
turbo molecular system (50 1 s '). A Balzers Penning gauge was used for the 10'^ to 10'^
mbar regime. For the region o f 0.2-1 mbar an Edwards Pirani gauge was used. The latter
was calibrated using a Hastings HPM-2002-OBE wide range gauge, which consists o f a
dual sensor unit containing a piezoresistive direct force sensor and a thin film Pirani type
2. Experim ental methods 33
2.2
Plasma characterisation techniques
2.2.1 Langm uir probe
The technique o f using an electrostatic probe to m easure the properties o f a plasma
was introduced in 1923 by Langmuir [2], The theory was presented for steady and
collisionless plasm as in which the electron energy distribution function (EEDF) is
M axwellian. In general the basis o f the theory and the experim ental set up are relatively
simple. The electric probe is a conducting object inserted into the plasm a and is connected
outside the cham ber to some circuit. Probe theory creates a connection between the
m easured probe currents or voltages and the param eters o f the undisturbed plasma.
However, in contrast to the simple operation o f probes the theoretical interpretation o f the
results rem ains complicated. The use o f electrostatic probes in a flowing plasma was
further developed by Koopman [3].
Fig.2.2(a) shows a schematic o f the typical Koopm an bias circuit used for a flowing
plasma. The operating principle o f a Langm uir probe at first glance is very simple' The
electrical circuit allows variation o f the probe voltage, V, with respect to the plasma and to
m easure the current voltage characteristic I(V). Generally a few guidelines need to be
followed when deciding on the components for the circuit.
1. The total collected integrated charge in a pulse m ust be m uch less than that stored in
the blocking capacitor (Cb).
2. The voltage m easured over the load resistor ( Rl) should be m uch less than the bias voltage ( Vb) applied to the probe at all times.
For exam ple, the RC time (R = Rc = 22 kQ , .’.R C = 14 ms), restricts the rate at which the
experim ent can be carried out. Once the capacitor is charged only transient currents from
2. E xperim ental m ethods 34
(a) (b)
' Grounded collar
Probe
^ Bias
Insulator
Collecting area
' Osc
Fig.2.2 (a) A RC ‘K oopm an’ circuit for flow ing plasm as. The bias voltage ( Vb) could be
varied betw een ± 30 V and the load resistor (R l) could be varied to keep Vqsc to a
m inim um . The blocking capacitor (Cb) rem ained fixed at 0.65 fiF. (b) An exam ple o f a
planar probe w hich has dim ensions 3 x 2 mm.
Throughout the experim ents a small planar probe w ith dim ensions 4.5 x 2 mm^ was
positioned 10 cm from the target. Its purpose w as to ensure reproducibility o f the ablation
plum e and was orientated to face the target. It w as biased at -30 V to record the ion signal
due to the plasm a flow, and by m aintaining a constant ion flux to this probe using the
focusing lens, any variation in laser energy and ablation rate could be corrected. For probe
experim ents a second probe o f typically 5 x 5 mm^ w as used. This probe w as positioned
close to the target norm al and could be rotated around its axis so as to change its
orientation relative to the plasm a flow. For both probes, the current w as determ ined by
using a digital oscilloscope to m easure the voltage across a load resistor and w as averaged
2. Experimental methods 35
2.2.2 Energy Selective-Time of Flight Mass Spectrometer
T hroughout this w ork w e w ill show how L angm uir probes can b e used to m easure the p lasm a density and tem perature, the p lasm a flow velo city and the shape o f the ablation plum e expansion. H ow ever one clear disadvantage o f these probes is th eir inability to distinguish b etw e en d ifferent ion species and charge states. A n energy spectrom eter is a useful addition to the L angm uir probe in determ ining the plasm a param eters. M any p rinciples have b e e n used to achieve energy analysis o f charged particles such as the m easurem ent o f the tim e o f flight, the retardation b y a p otential b arrier and the dispersion in a deflecting field.
2. Experimental methods 36
D etectors
-Ri (Inner Plate)
Rj (Outer Plate) Ion Path
Fig.2.3 The ES-TOFMS, with the ion trajectory and detectors. The inset shows the circuit
used to measure the current collected.
When a voltage is applied to the plates and an electric field established, the
spectrometer acts as an energy filter, allowing only ions with certain energies to reach the
detector. The pass energy of the spectrometer is given by:
ZAVRn
^ F il t e r ~
^
( 2 - 1 )where Z is the ion charge, AV is the voltage applied between the plates, Ro is the centreline
radius of curvature and d is the plate separation. By choosing suitable values of Ro and d
we can determine the energy range of the spectrometer. We selected Ro = 3.5 cm and d =
3.25 mm which gives the analyser an energy range o f 0 -3 5 0 eV assuming Z = 1. The
device was isolated inside a grounded aluminium box, (7 x 10 x 2 cm), with a 1 cm
diameter entrance to mount the entrance slit (3 mm x 50 fim). It was situated along the
target normal at a distance o f 29 cm with all electrical connections made through grounded
BNC connectors. The charge collected by the detector was determined using an operational
amplifier operating in inverting mode with a feedback resistor (Rf) of 220 kQ.
One limitation of the device is that low energy ions cannot be reliably detected due
to space charge effects at low transmission energies. The space charge causes shifts in the
positions of the peaks and corresponding errors in determining their TOF. Its magnitude
2. Experim ental methods 37
E s p a c e = ^ ( 2 - 2 )
where w is the sHt width and nj is the ion density at the slit. For a slit o f 50 |xm and a
typical ion density of lO'^ cm'^ at 29 cm then Espace ~ 4000 V m ''.
Only ions with the same energy,
f 2 ^
£■
■^lon ^ V 2 e ,
as the pass energy of the
spectrometer will travel the length o f the analyser to reach the detector. The output of the
analyser then gives the time of flight and hence the velocity o f the ions. The mass-to-
charge ratio is then determined by balancing both energy equations:
= (2.3)
Z dv,^
R esolution
As the energy is determined using (2.1), the associated error can be calculated as:
AR
^ n i t e r - ^ f i lte r ( 2 - 4 )
Taking AR = 3 mm (the diameter of the wire detector) and R =Ro, then
2. Experim ental methods 38
2.3 Estimated errors
The follow ing tab les sum m arise the errors for som e o f the frequently used quantities.
Quantity Symbol Units Error
Probe distance D cm 0.2 cm
L aser spot dim ensions x , y m m 0.1 mm
P o w erm eter voltage V m V 5 m V
T im e o f flight t t o f |0,S 0.05 )a,s
Definition Explicit error Approx
F luence
F = 1 A
^ fA E AA AV Ax A y^
F x — + ---= ---+ — + —
^ E A V X y ,
0.3F
T im e o f flight d
V to f = — to f
X
o f Ad ^ At^„f ^
0.15v,„f
Ion energy P 1 2
E i o n ^ l o n ^
V .o f
0-2Ei„„
Ion flux , t
F = f v ( t ) d t
R A e J ^ ’
/
F x \
2. Experimental methods 39
2.4 References
1. Chrisey, D.B. and Hubler, G.K., Pulsed laser deposition o f thin film s. 1994, New
York ; Chichester: J. Wiley.
2. Langmuir, I. and Mott-Smith, H.M., Gem. Electr. Rev., 26: p. 731(1923).
3. Langmuir Probe 40
3. Langmuir Probe
The full characterisation o f a plasm a plume requires m any different techniques, each
giving inform ation about a particular aspect. Diagnostics o f plasm as can generally be
divided into two m ain categories: active non-contact m ethods, such as optical
spectroscopy, and contact m ethods, such as energy analysers and electrostatic probes. In
this thesis we restrict ourselves prim arily to the electrostatic probe. It was one o f the first
techniques for m easuring the properties o f a plasma, and has proved itself to be a versatile
and robust device. The subject o f electric probes in plasm as is imm ense with thousands of
references in the literature.
/ Electric probes come in all sizes and shapes, but the more comm on are spheres,
cylinders and flat discs. They are usually made out o f m aterials like molybdenum, tungsten
or graphite and the holders can be made from glass, quartz or ceramic materials. Some
general requirem ents m ust be satisfied before using the probes. These include that the
probe tip m ust be able to withstand the heat load from the plasm a and that the probe should
not perturb the overall state o f the plasma. The first requires a small probe size compared
with the typical plasm a scale lengths. The second is not as easy to satisfy. The perturbation
o f the plasm a occurs prim arily through changes o f the electric potential and hence the
particle density and energy. The perturbation depends on the potential o f the probe and the
current draw n by it. Therefore a good understanding o f the perturbative effects o f the probe
is important before interpreting the results.
In this chapter we shall discuss the probe-plasm a interaction, the relevant probe
theories and some param eters such as density and tem perature obtained using electrostatic
3. Langmuir Probe 41
3.1 Plasma equilibrium
Various collisional and radiative processes betw een charged and neutral particles take
place within the plasm a, w ith their relative im portance depending upon the density,
tem perature and degree o f ionisation. There are two basic ionisation processes; impact
ionisation, where an electron strikes an atom resulting in an ion and two electrons; and
radiative ionisation where a photon with sufficient energy is absorbed by an atom,
dissociating it into an ion and an electron. Recom bination processes are the reverse o f the
ionisation processes and are: three-body recom bination, where two electrons and an ion
jo in to make an atom and free electron; and radiative recom bination, where an electron and
ion com bine into an atom with the release o f a photon. All these rates depend on the
electron tem perature and density.
D ifferent plasm a equilibrium m odels assume different relative strengths o f these
o 0
various processes. For example, in low-density (< 10 cm ' ) plasm as, radiative f recom bination is larger than three-body recom bination and the model o f ‘coronal
equilibrium ’ can be used. In this case impact ionisation and radiative recom bination are in
balance. A t high densities, (> lO'^ cm'^) the ‘Local Thermal Equilibrium ’ model is
applicable and the atom, ion and electron densities will be described by the Saha-Boltzman
model. The collisional processes within a plasma are discussed in detail in [1] so we shall
just present the relevant equations here.
If we have a density, n„, o f neutral atoms with a cross sectional area, a , then an
electron will travel a distance ^ ^ before it has a reasonable probability o f colliding
with an atom. This quantity is called the mean-free path for collisions, and for
3. Langmuir Probe
/ 42
The collisional frequency is usually defined in terms o f an average over all velocities in the
M axwellian distribution and is written as:
v = ( f ‘) = n „ (a v ) (3.1)
For a hydrogen atom, the Bohr radius is given by a^ « 5 x l O '" m. The cross-section for
elastic scattering o f an electron by a neutral atom can then be estim ated roughly as:
a„ ~7iao ~10"“ m^ '(3.2)
A t a distance ao from a neutral atom an incom ing electron has a substantial chance
o f undergoing a collision. However when an electron approaches an ion it will experience
an attractive Coulom b force, which deflects the electron trajectory towards the ion. The
interaction with the Coulom b force o f another charged particle is essentially the same as a
‘collision’. We then define an effective ‘Coulomb cross-section’ o f the ion in term s o f the
distance o f closest approach ‘b ’ o f the electron to the ion:
Tie" 1 0 ^ ''
a . ~ 7 i b '--- m ' (3.3)
(4ns„)^T/ t
where Te is given in eV. If we compare the two cross sections we see that Coulomb
collisions will dom inate over collisions with neutrals in any plasm a that is ju st a few
percent ionised. Only if the ionisation level is very