Automatic extraction and description of
human gait models for recognition purposes
David Cunado, Mark S. Nixon,
*and John N. Carter
Department of Electronics and Computer Science, University of Southampton, Southampton SO9 5NH, UK
Received 4August 2000; accepted 21 November 2002
Abstract
Using gait as a biometric is of emerging interest. We describe a new model-based moving feature extraction analysis is presented that automatically extracts and describes human gait for recognition. The gait signature is extracted directly from the evidence gathering process. This is possible by using a Fourier series to describe the motion of the upper leg and apply temporal evidence gathering techniques to extract the moving model from a sequence of im-ages. Simulation results highlight potential performance benefits in the presence of noise. Clas-sification uses thek-nearest neighbour rule applied to the Fourier components of the motion of the upper leg. Experimental analysis demonstrates that an improved classification rate is given by the phase-weighted Fourier magnitude information over the use of the magnitude tion alone. The improved classification capability of the phase-weighted magnitude informa-tion is verified using statistical analysis of the separainforma-tion of clusters in the feature space. Furthermore, the technique is shown to be able to handle high levels of occlusion, which is of especial importance in gait as the human body is self-occluding. As such, a new technique has been developed to automatically extract and describe a moving articulated shape, the hu-man leg, and shown its potential in gait as a biometric.
Ó 2003 Elsevier Science (USA). All rights reserved.
1. Introduction
Most people can recognise acquaintances by the way they walk, although it is not just their gait that identifies them—for example, their hair style or clothing is usually
Computer Vision and Image Understanding xxx (2003) xxx–xxx
www.elsevier.com/locate/cviu
*
Corresponding author. Fax: +23-8059-4498. E-mail address:[email protected](M.S. Nixon).
recognisable. This research investigates the possibility of recognising people by way of a gait signature as obtained by computer vision. We first review the field of bio-metrics and present current approaches to gait recognition by computer vision.
There has been considerable study of gait in a number of fields, although there has been little cross-fertilisation of ideas between these fields: psychological gait cues have yet to find deployment elsewhere. Amongst this work, there are emergent tech-niques aimed at recognising people by their gait. None of these techtech-niques use a known mechanical topology or medical studies, but concentrate more on heuristic and statistical metrics. It is however possible to develop a model-based gait extrac-tion technique from which a metric directly applicable to the mechanics of walking can be generated. Before the performance advantages associated with such an ap-proach are detailed, current research in gait and its allied fields shall be reviewed.
1.1. Biometrics
In todayÕs society, a reliable means of identification is in great demand. Incidents like releasing a child from a day-care centre to a complete stranger or a welfare re-cipient claiming benefit under six different identities could have been avoided with improved means of identification. One study [29] has shown that one area where technology has enhanced the ability to identify people is biometrics.
A biometric is a measure taken from a living person and used as a method of iden-tity verification or recognition. This measure can be based on some physiological characteristic, like a fingerprint, or some aspect of human behaviour, like handwrit-ing. Currently, the main application for biometrics is in security, for access control. It is anticipated that the stock of potential applications will increase as the tech-niques mature. Potential future applications could include immigration control and surveillance.
The areas currently under research include automatic face recognition, eye (ret-ina) identification, fingerprints, hand geometry, vein patterns, and voice patterns. In-deed, the use of retinal recognition is under investigation in the UK for biometric use in ATM transactions. Recent surveys [11,32] reveal the immense wealth of research in the field of biometrics, with many applications ranging from banking to security. Even with the vast range of applications and research in the field of biometrics, gait has appeared only recently [26].
In many applications of person identification, particularly those involving serious crime, many established biometrics are obscured. The face may be hidden or at low resolution; the palm is obscured; the ears cannot be seen. However, people need to walk so their gait is usually apparent. This motivates using gait as a biometric. The Oxford Dictionary definition of gait is‘Manner of walking, bearing or carriage as one
walks’suggesting that studies can concentrate on different facets of a personÕs walk.
provoke attention. On escape, the robber will either exit at speed (if the crime is known to have been observed), or in (apparent) leisure. The motion in both cases is natural, for the subject will either not want to draw attention to themselves or will want to move quickly. In this case, using gait as a biometric would appear attractive. Prior lack of research in gait was perhaps due to technological limitation: analy-sing gait involves procesanaly-sing a sequence of images and only recently have main-stream architectures and image acquisition been able to offer the requisite performance. Clearly, there are limits to the use of gait as a biometric. A clearer ex-amination of the potency of some apparent limitations awaits development of a practical gait recognition system. However, it is not unlikely that footwear can affect gait, as can clothing. Equally, physical condition can affect gait such as pregnancy, affliction of the legs or foot, or even drunkenness. These factors are not new to bio-metrics: a face can have make-up or spectacles; ears can be obscured by hair. These can be of natural occurrence, but could also be used for purposes of deception. De-ception could go further, a subject can wear a mask and in palm recognition it is of concern that hands can even be cut off. Human perception can be impeded by these factors, but the major question concerns whether a biometric system can still per-ceive the underlying characteristics of the biometric, regardless of the presence or ab-sence of these factors. In the case of gait, this underlying characteristic can be the musculature which essentially limits the variation of motion. However, factors such as clothing, footwear, and physical condition must await investigation, since meth-ods of recognising the basic nature of gait have yet to become established. Similar to the role of facial expressions or make-up in automatic face recognition, these factors would appear secondary to the principal drive of study of gait as a potential biometric.
Other than its availability, or its naturalness, recognising gait is attractive since it is non-invasive and requires no subject contact, in common with automatic face rec-ognition and other biometrics. Clearly there is a view that gait can be used to recog-nise individuals. This view is actually not new: Shakespeare used a rich lexicon of adjectives to describe gait, including Ôprincely,Õ ÔlionÕs,Õ Ôheavy,Õ Ôhumble,Õ Ôweary,Õ Ôforced,Õ Ôgentle,Õ Ôswimming,Õ and Ômajestic.Õ Further, in The Tempest [Act 4Scene 1], Ceres observes
ÔHighÕst Queen of state, Great Juno comes; I know her by her gait.Õ
Even more, in Troilius and Cressida [Act 4Scene 5], Ulysses states
ÔTis he, I ken the manner of his gait; He rises on the toe: that spirit of his in aspiration lifts him from the earth.Õ
The former is one of ShakespeareÕs many observations concerning the ability to recognise people by their gait; the latter includes a concise description of DiomedesÕ
Accordingly, there appears not only to be a view that gait has potential as a bio-metric, but also that there is application potential too, as gait appears to have several practical advantages over other biometrics, and some application advantages in common with them. There have been allied studies, particularly those in medical studies for reasons of therapy. Also, there have been psychological studies concen-trating on human capabilities. There have also been computer vision approaches aimed to model and to track human targets through a sequence of images, though not usually for recognition. These works are reviewed by [1] and more recently [20]. Tracking approaches are potentially less suitable for gait as a biometric since occlusion (temporal and spatial) can complicate implementation greatly.
1.2. Current approaches to automatic gait recognition
In what was perhaps the earliest approach to automatic recognition by gait, [27] derived a gait signature from the spatio-temporal pattern of a walking person. Here, in the XT dimensions (translation and time), the motions of the head and of the legs have different patterns. These patterns were processed to determine the body mo-tionÕs bounding contours and then a five stick model was fitted. The gait signature was derived by normalising the fitted model for velocity and then by using linear in-terpolation to derive normalised gait vectors. This was then applied to a database of 26 sequences of five different subjects, taken at different times during the day. De-pending on the values used for the weighting factors in a Euclidean distance metric, the classification rate varied from nearly 60% to just over 80%, a promising start in-deed. Clearly, a model was not used within the study. As such, it would appear dif-ficult to confirm that the metric was indeed purely related to a subjectÕs gait.
of six subjects found that with as little as three features a good recognition rate (90.5%) was achieved, plateauing at five features with a rate of 95.2%.
It would appear that the central goal of the work by [16] was to determine what content of motion aids recognition rather than to develop a biometric metric using this approach. Although demonstrating that a model-based approach is not neces-sary to produce good recognition results, [16] expected that‘discrimination would suf-fer when the database of individuals became large; simple motion cues could identify types of gait, but would no longer uniquely identify an individual.’
Another approach [21] was aimed more at generic object–motion characterisa-tion, using gait as an exemplar of their approach. The approach was similar in func-tion to spatio-temporal image correlafunc-tion, but used the parametric eigenspace approach to reduce computational requirement and to increase robustness. The ap-proach first derived body silhouettes by subtracting adjacent images, with further processing to reduce noise. Then, the images were projected into eigenspace, a well established approach in automatic face recognition. Eigenvalue decomposition was then performed on the sequence of silhouettes where the order of the eigenvectors corresponds to frequency content. Recognition from a database of 10 sequences of seven subjects showed classification rates of 100% for 16 eigenvectors and 88% for eight, compared with 100% for the (computationally much more demanding) spa-tio-temporal image correlation approach. Further, the approach appeared robust to noise in the input images. Clearly, this is a statistical approach; the system can only learn to classify labelled data. Should the system have been trained erroneously, then the wrong identification will occur since a unique model of human walking has not been assumed, rather that humans can be recognised from walking by the suc-cessive distributions in a sequence of images.
Eigenspace transformation (EST) based on Principal Component Analysis (PCA), or the Karhunen-Loeve Transform, has been demonstrated to be a potent metric in automatic face recognition and gait analysis, but without using data analysis to in-crease classification capability. A new approach combines canonical space transfor-mation based on Canonical Analysis (CA) or Linear Discriminant Analysis (LDA), with the eigenspace transformation, for gait analysis [9]. This gives aÔstatisticalÕ (ar-ea-based) approach to automatic gait recognition wherein the image sequence is de-scribed as a whole, and neither by a model- nor by a motion-based approach, but one which describes the motion content.
On five sequences of five people from the Visual Computing Group, University of California, San Diego [9,15] achieved a classification rate of 85% by CST alone whereas 100% was achieved with combined EST and CST. Further, the clusters were better separated by CST, suggesting that the technique would appear suited to larger databases. A later extension [10] was based on using dense optical flow [16] and again achieved 100% on the same data, showing that the best performance was achieved by using dense optical flow which combined both vertical and horizontal motion com-ponents. However, these techniques remain statistical in basis, describing human motion by the statistics of a sequence of area distributions rather than any attempt to match the data to a model.
Recognition of different kinds of gait motion was investigated by [18] and [19]. The trajectories of body parts were extracted from grey-level image sequences, and feature vectors were then derived from this trajectory information. Optic flow was used to determine the trajectories of the body parts in [18], whilst [19] modelled sev-eral body parts and the background as mixture densities to extract the trajectories. The feature vectors for the gait analysis were formed from the displacements of the body parts in thex- andy-directions. Classification was performed using Hidden Markov models, one trained for each kind of gait type. In common with all the sta-tistical (area-based) approaches discussed in this section, the features derived for the gait analysis in [18] and [19] are not based on a model of the human body or its mo-tion. As such, the discriminatory powers of the classification will be limited to the quantity and quality of the training data available.
1.3. Aims of the research
This paper explores the possibility of extracting a gait biometric from a sequence of images of a walking subject without using markers. Sophisticated computer vision techniques are developed, aimed to extract a gait signature that can be used for per-son recognition. A model-based approach is sought to produce a biometric that has high fidelity to the original data. Medical studies are used to develop the model. This is a novel approach to gait recognition by computer vision, as current techniques have concentrated on heuristic and statistical gait metrics. Naturally, the application of a model will potentially alleviate the restrictions imposed on statistical (area-based) approaches, namely that the extracted metric can be directly attributed to hu-man motion. As such, this would appear to offer the potential for discriminating not only gait, but also factors that affect gait.
that a model-based method can handle such a distorted scene without marker points since it relies on the presence of human motion in the sequence, and as such can in-herently model its time history/future.
Furthermore, it would appear impossible for an area-based technique to explicitly handle occlusion. The discriminatory measure derived in statistical techniques is formed directly from the motion information of pixels in the image sequence. In the case of an occluded object, where the motion information of the pixels has been removed in some parts of the sequence, an area-based approach could fail since there is no model with which to handle the missing information. A model-based technique can overcome the reduced information by globally integrating the information gath-ered locally in each image of the sequence. In this way, the importance of the infor-mation in each individual image is dramatically reduced, so much so that an object can be missing/occluded in several frames without affecting the extraction of the sig-nature. The ability to handle occlusion successfully is fundamental to automatic gait recognition. In practical applications the person can be occluded by accessories such as briefcases, umbrellas, shopping bags or rucksacks. Also, the human body is self-occluding in many of its motion types.
Similarly, secondary effects such as footwear and apparel cannot be analysed by statistical techniques. The description of motion in the image sequence produced by the statistical (area-based) methods cannot be extrapolated to include these effects as the description has no basis in the mechanics of human motion. With a model-based approach, these secondary effects can potentially be accommodated in the feature ex-traction stage. For instance, a tired person will walk with less flexion of the legs, but nevertheless the image sequence will still contain a moving person and as such its model can still be extracted.
Initially, extant computer vision techniques were used to extract a gait biomet-ric from a sequence of images [5]. Although a gait signature was successfully gen-erated from the extracted features, there were several strategic problems. Essentially, the use of extant techniques did not consider the potential perfor-mance gains possible with sequence-based processing of moving features, being more concerned with a frame-by-frame approach to moving feature tracking. New modelling techniques were then developed to solve these problems. Using no-vel temporal evidence gathering methods, a gait model can be extracted from an image sequence and a signature based on this model generated totally automati-cally. We could have improved matters by using one of the new approaches for background subtraction to isolate moving subjects before analysis but instead we chose to phrase our new approach as a conventional approach to feature ex-traction, here targeted at extracting and describing moving shapes, from sequences of images.
2. Modelling human gait
2.1. Medical studies
The goal of most gait research has been to classify the components of gait. [23] and [22] produced standard movement patterns for normal people that were com-pared to the gait patterns for pathological patients [22]. No statistical or mathemat-ical analysis was performed on the collected data.
Gait was considered by [22] asÔa total walking cycleÕ—the action of walking can be thought of as a periodic signal, with an associated frequency spectrum. [2] exam-ined the frequency content of kinematic gait data, and showed that normal gait had a maximum frequency component of 6 Hz. As such, kinematic gait data could be rep-resented by a limited number of frequency components.
2.2. Gait description
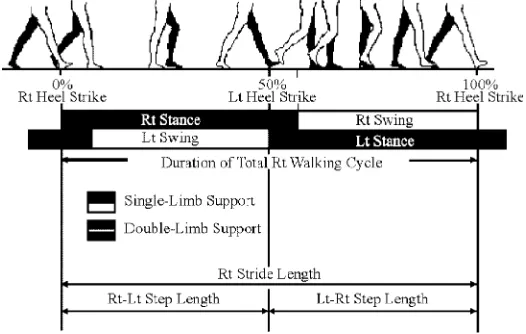
The following terms are used to describe the gait cycle, as given in [23]. Fig. 1 il-lustrates the terms described. Agait cycleis the time interval between successive in-stances of initial foot-to-floor contact (Ôheel strikeÕ) for the same foot. Each leg has two distinct periods; astancephase, when the foot is in contact with the floor, and a
swingphase, when the foot is off the floor moving forward to the next step. The cycle
[image:8.544.148.411.448.615.2]begins with the heel strike of one foot, the left foot for example. This marks the start of the stance phase. The ankle flexes to bring the left foot flat on the floor (Ôfoot-flatÕ) and the body weight is transferred onto it. The right leg swings through in front of the left leg as the left heel lifts of the ground (Ôheel-offÕ). As the body weight moves onto the right foot, the supporting left knee flexes. The remainder of the left foot, which is now behind, lifts of the ground ending the stance phase with toe-off.
The start of the swing phase is when the toes of the left foot leave the ground. The weight is transferred onto the right leg and the left leg swings forward to strike the ground in front of the right foot. The gait cycle ends with the heel strike of the left foot.
Stride lengthis the linear distance in the plane of progression between successive
points of contact of the same foot.Step lengthis the distance between successive con-tact points of opposite feet. Astepis the motion between successive heel strikes of opposite feet. A complete gait cycle is comprised of two steps.
2.3. Characteristics of human gait
From the work carried out by [23] and [22] it can be concluded that if all gait movements were considered, gait is unique. In all there appear to be 20 distinct gait components, some of which can only be measured from an overhead view of the subject.
Murray [22] foundÔthe pelvic and thorax rotations to be highly variable from one subject to another.ÕThese patterns would be difficult to measure even from an over-head view of the subject, which would not be suited to application in many practical situations. [22] also suggested that these rotation patterns were not found to be con-sistent for a given individual in repeated trials. As such, they would not appear suited to an automated computer vision-based biometric system.
In [23] and [22], ankle rotation, pelvic tipping, and the spatial displacements of the trunk (vertical oscillation, lateral oscillation, and forward displacement) were shown to possess individual consistency in repeated trials. Naturally, given the resolution of most general purpose cameras, the ankle is difficult to extract consistently, let alone its rotation. Equally, the pelvis can easily be obscured by clothing, making a mea-surement of its inclination easily prone to confusion and error. The spatial displace-ments of the trunk are measured from the neck. Thus, the extraction of the these displacements is hampered by a difficulty in finding the neck consistently and by the fact that the neck, like the pelvis, is easily obscured by clothing. As such, these components would be difficult to extract accurately from real images. Again, these would appear unsuited to an automated system.
Since many features established by medical studies appear unsuited to a computer vision-based system, the components for this investigation have been limited to the rotation patterns of the hip and knee. These patterns are possible to extract from real images and, from medical studies, appear to possess a high degree of individual con-sistency and inter-individual variability.
2.4. Rotation pattern of the hip
gait cycle, the hip is in continuous extension as the trunk moves forward over the supporting limb. In the second phase of the cycle, once the weight has been passed onto the other limb, the hip begins to flex in preparation for the swing phase. This flexing action accelerates the hip so as to direct the swinging limb forward for the next step. The angle of rotation is measured as the angle between the line joining the hip and knee, and the line passing through the hip point parallel to the ground.
2.5. Model of legs for gait motion
[image:10.544.198.372.106.227.2]The potential of the periodic nature of gait for an analytic approach was first in-vestigated by [14], who performed a feasibility study into using gait as a biometric. An analytic approach was used, describing the legs and the motion of walking as a model based on medical and perceptual studies. The human leg was modelled as two pendula joined in series (Fig. 4). The upper pendulum modelled the thigh and was suspended between the hip and the knee. The lower pendulum modelled the lower leg suspended from the knee to the ankle. This pendulum model is backed by [22]—Ôfor normal gait, the duration of successive temporal components and the length of successive steps are rhythmic.Õ
[image:10.544.193.369.261.398.2]Kuan [14] extracted the hip rotation pattern for three subjects from a sequence of images using computer vision techniques. The rotation patterns were curve fitted manually to in-fill for missing data points. Fourier analysis was performed on the rotation patterns, and the magnitude and phase spectra for each subject were exam-ined. The magnitude plots showed some variation between subjects, whilst the phase plots exhibited greater variation between subjects. The greater inter-individual vari-ation of the phase spectra makes the phase informvari-ation an attractive measure for recognition. The manner in which the hip inclination changes is of as much interest as the actual angle itself, and as such both the magnitude and phase information were of use. Kuan concluded that this model-based approach looked promising, but as yet insufficient for an automated non-invasive technique.
The frequency information of hip rotation appears to be attractive for recognition as different walking speeds can be dealt with effectively. When fast walking was con-sidered by [22] it was found that the increased ground speed was effected by an in-crease in stride length and reduction in gait period. Both the hip and knee exhibited greater extensions and flexions throughout the gait cycle in fast walking. The frequency scaling property of the FT predicts that the effect of a reduction in the period of the cycle is an expansion in frequency of the spectrum;
fðatÞ$F 1 jajX
jx a
; ð1Þ
whereXðjxÞis the FT offðtÞ, andais a real constant. Given the relationship shown above, the spectrum for fast walking might demonstrate the difference in speed by appearing to be a stretched version of the free walking spectrum, keeping a char-acteristic envelope for a given individual at different walking speeds—effectively, a gait signature. The scaling effect of the spectrum for different walking speeds can be eliminated by normalising the time axis for the hip rotation patterns to the length of gait cycle in each case; the time scale will cover from 0% to 100% of the walking cycle. In this way, direct comparisons between spectral data can be made, as the
[image:11.544.157.376.106.260.2]Fourier information is now independent of the fundamental frequency of the gait cycle.
This study uses the model presented in [14] as the leg motion is periodic and each part of the leg (upper and lower) appears to have pendulum-like motion. Fourier theory allows periodic signals to be represented as a fundamental and harmon-ics—the gait motion of the lower limbs can be described in such a way. Accord-ingly, computer vision techniques were required to extract the measurements from video sequences in an automatic manner to allow the investigation of remote gait measurement as a potential biometric. This involved a re-examination of the basic processes by which the measurements were derived, and new development thereof.
3. Gait signature by evidence gathering
The preliminary study described in [5] demonstrated positive results in the use of gait as a biometric measure. A gait signature was extracted, but not automatically, using computer vision techniques and produced a high correct classification rate on a small database of subjects. However, the techniques used in [5] had inherent problems which would be likely to affect more general use of the technique, especially on a larger database. These are discussed in this section. Novel vision techniques have been developed specifically to overcome these problems and their motivation, as well as their implementation, are described. Further experimentation shows how these novel techniques can extract and describe gait, and results are presented showing how they can be used to recognise people by their gait. Furthermore, the new technique extracts the gait signature automatically from the image sequence, without human intervention, one of the major aims of this work.
3.1. Previous work
The study performed in [5] described a novel model-based approach to gait recog-nition, using the notion of gait as a periodic signal to create a gait signature. The lower limbs were modelled as two inter-connected pendula and gait was considered as the motion of these pendula.
This model-based approach uniquely gave a signature which could be directly re-lated to the original image sequence. However, images were analysed singly, without reference to the whole sequence. As such, the technique would be unable to handle occlusion, except by interpolation such as by least squares.
Although the extracted hip rotation patterns in [5] concurred with those presented in medical research [22,23], the idea of gait as a periodic function was not reflected in the use of a polynomial to model the motion of the thigh. Any periodic signal, with period T, can be represented by a Fourier series (FS). The motion of the thigh is better represented as an FS rather than by polynomial fitting to the extracted data. Also, greater noise immunity can be achieved when extracting temporal features in a sequence of images by including the entire sequence in the evidence gathering pro-cess. [24] described a Velocity Hough transform (VHT) technique that enables the concurrent determination of structural and motion parameters of moving parametric shapes in an image sequence. Essentially, the VHT includes motion within the para-metric model. The polar representation of a circle radiusrwith co-ordinatesx0,y0in the first frame and moving with horizontal and vertical velocity,vx and vy, respec-tively, hasxandy co-ordinates at timetas
xðtÞ ¼x0þrcosðhÞ þtvx; ð2Þ
yðtÞ ¼y0þrsinðhÞ þtvy; ð3Þ
wherehis an index to points on the circleÕs perimeter. Votes are accumulated in a 5-dimensional accumulator (x0; y0; vx; vy; r) from edge images of each image in the sequence. The accumulator maximum corresponds to the best estimates of each of the parameters describing the moving circle. The VHT was demonstrated to have superior properties in low to moderate noise compared with a separately applied HT. By combining VHT techniques with the FS representation of the hip rotation, a feature-based human gait model can be extracted from a sequence of images. This feature-based model has a high fidelity to the data, with a clear analytic justification. Evidence gathering using the VHT offers greater immunity to noise and occlusion, and produces a maximum likelihood estimate of the model parameters. By modelling the hip rotation as an FS, the gait signature described in [5] can be extracted directly, without intervention.
3.2. Modelling gait
3.2.1. Motion model of the thigh
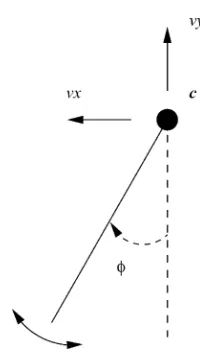
The structural model of the thigh presents the edge point values of the model at any time instant. Fig. 5 shows the model of the thigh used for temporal evidence gathering. The motion of the model of the thigh is described by the displacement functionscxðtÞandcyðtÞ, which control the movement of the hip, and the inclination
/ðtÞwhich controls the thigh rotation. [23] state thatÔduring walking the pelvis re-mains relatively level.ÕTherefore, the vertical velocityvyðtÞis described by the aver-age vertical velocityVy only,
vyðtÞ ¼Vy; ð4Þ
whereVy reflects the constant slope of the walking surface. The vertical displacement
cyðtÞof the hip can be modelled as
cyðtÞ ¼Vyt: ð5Þ
The horizontal motion of the pelvis has two main influences: the average ground speed and the transverse rotation (about they-axis) of the hip. The transverse ro-tation of the hip is characterised by the graph in Fig. 6, which was obtained from [22]. Even though the mean is not zero, reflecting bias on the measurement process, the entire cycle can be observed to be sinusoidal in nature. Accordingly, using a simple cosine to represent the influence of the transverse rotation, the horizontal velocityvxðtÞcan be described by
vxðtÞ ¼VxþAcosðx0tþwÞ; ð6Þ
whereVxis the average velocity,Ais the amplitude, andwis the phase of oscillation, respectively, and x0is the angular velocity of the gait cycle. Using standard trigo-nometric relations,Acosðx0tþwÞcan be represented in a more simple form as:
Acosðx0tþwÞ ¼Acosx0tcoswAsinx0tsinw ð7Þ
[image:14.544.225.325.450.627.2]¼acosx0tbsinx0t; ð8Þ
where
a¼Acosw ð9Þ
and
b¼Asinw: ð10Þ
This actually simplifies later parameterisation in evidence gathering as the quanti-sation of the phase parameter w2 ½p;p is now spread over two magnitude pa-rameters. These magnitude parameters are more easily quantised as their effect on the displacementcxðtÞ is measured in units of pixels. Integrating Eq. (8) gives the horizontal displacement of the hip, the constant of integration set to guarantee the initial positioncx0(cxð0Þ ¼0) att¼0. The functioncxðtÞis given by
cxðtÞ ¼
b x0
þ Vxt
þ a
x0
sinx0tþ
b x0
cosx0t
: ð11Þ
3.2.2. Structural model of the thigh
The thigh is described by a pointcthat represents the hip joint, or pelvis, and a line passing throughcat an angle/. The pelvis has horizontal and vertical velocities
vxandvy, respectively. These velocities produce the displacement functionscxðtÞand
cyðtÞfrom the initial coordinates of the hip (cx0; cy0), as described in Section 3.2.1. The inclination of the line,/, is governed by the hip rotation model. The coordinates of points on the moving line are given by
rx¼cx0þcxðtÞ ksin/ðtÞ; ð12Þ
ry ¼cy0þcyðtÞ þkcos/ðtÞ; ð13Þ
[image:15.544.177.348.109.244.2]wherecx0andcy0are the initial coordinate values of the hip andkcan take any real value to produce any point on the line. As in the VHT, Eqs. (12) and (13) are used to map edge points in the image space into an accumulator space whose axes are the parameters of interest, namelycx0,cy0,Vx,Vy,a,b,a0,bk, andck. Edge points from the
entire sequence are used, the mapping equations reflecting the time instance of the frame in which the edge points are in. Related edge points in different frames cast votes for the same parameter values, the ones relating them together.
3.2.3. Creating a gait signature
For a constant walking speed, the hip rotation/ðtÞis a periodic function with pe-riod T. An FS can represent any periodic signal with fundamental frequency
x0¼2p=T. For a real periodic signal, the FS representation can have the form
xðtÞ ¼a0þ2
X1
k¼1
Rfakejx0ktg: ð14Þ
The function/ðtÞin Eqs. (12) and (13) can be modelled by the FS in Eq. (14). As such, the inclination of the thigh is represented by a series of harmonics, as consistent with observations from earlier medical studies [2] and the earlier model-based ap-proaches to gait description. Also, Fourier series expansions of experimental data of actual human locomotion have been used as a basis in modelling human figure behaviour with emotions for animation purposes [30]. The method developed in [30] defined a functional model based on the Fourier series expansion of joint data from actual human behaviour. An extensive variation of movements could be generated from this functional model. For instance, using the functional models for a normal walk and aÔtiredÕwalk, a parameters2 ½0;1is used to interpolate between the two models to produce a walk with different degrees ofÔtiredness.ÕExpressing exagger-ated behaviours is achieved through extrapolation (jsj>1) of the two models. Similarly to [2], [30] found that the number of harmonics required to model the joint motions were usually three, and at most seven—Ôhuman locomotions are charac-terised with a small number of Fourier coefficients.Õ
Using the rectangular form ofak ¼bkþjck in Eq. (14) gives an expression for
/ðtÞ;
/ðtÞ ¼a0þ2
XN
k¼1
½bkcoskx0tcksinkx0t; ð15Þ
whereN is the number of harmonics. This equation reflects the periodic nature of the hip rotation.
In [5] a gait signature was constructed from the frequency components of the hip rotation. As this is a periodic signal, its Fourier Transform (FT) is a train of impulses at the harmonics of the fundamental frequency. The amplitude of these impulses is given directly from the coefficientsak of the FS representation:
XðjxÞ ¼ X 1
k¼1
2pakdðxkx0Þ: ð16Þ
XðjxÞ ¼ X 1
k¼1
2pdðxkx0Þ½bkþjck: ð17Þ
From Eq. (17), the magnitude and phase components of the hip rotation pattern can be found from the FS coefficientsbk andck;
jXðjxÞj ¼2p X
1
k¼1
dðxkx0Þ
ffiffiffiffiffiffiffiffiffiffiffiffiffiffi b2
kþc2k
q
; ð18Þ
argðXðjxÞÞ ¼ X 1
k¼1
dðxkx0Þtan1
ck
bk
: ð19Þ
The feature extraction process generates values for the FS coefficientsa0,bk, andck. As such, using Eqs. (18) and (19), the gait signature can be directly extracted from the evidence gathering method: there is now no need to apply separate Fourier analysis. Accordingly, the frequency-based signature is derived directly from the whole image sequence using a model-based approach, avoiding the problems in-herent in the earlier formulation.
3.3. Implementing a VHT to extract a gait model
3.3.1. Reduced gait model extraction by VHT and SHT
A VHT was implemented to extract the gait model described in Section 3.2. Each edge point in each frame of a sequence produced a set of possible initial coordinates
ðcx0;cy0Þfor a given range of values of the remaining parameters. Eqs. (12) and (13) produced this set of initial coordinates. The functionscxðtÞ,cyðtÞ, and/ðtÞ(Eqs. (11), (5) and (15), respectively) in Eqs. (12) and (13) were formed using the values of the remaining parameters, given the timet of the frame of the current edge point. The cells in the accumulator space that corresponded to each parameter combination for the given edge point were incremented. The axes of the accumulator space were the parameters of the model.
Angeloni et al. [2] showed that the magnitude of the frequency information of the hip rotation pattern had no significant terms above 5 Hz. As such, a full de-scription of the hip rotation can be achieved with a fifth-order FS. The full gait model would have the 11 parameters for the hip rotation model, six for the pelvic model and a final parameter for the gait cycle period T. Implementing a VHT to extract this model would require an 18-dimensional accumulator space. With cur-rent technology, this would be impractical to create and search, even for a small number of possible values for each parameter. Table 1 lists the parameters along with the equations in which they are used. The hip has average velocities Vx and
Vy in the x and y directions, respectively. The horizontal motion of the hip has a sinusoidal influence whose magnitude and phase is controlled by parameters a
For the purposes of testing, a reduced gait model was used; a first-order FS was used for the hip rotation model, reducing the model to 10 parameters. [7] described a method to reduce the storage space required by conventional Hough transforms that is directly applicable to the VHT. The accumulator space can be reduced to two 2-dimensional spaces, one representing the cx0cy0accumulator and the other for data storage. The range of values for the remaining ‘search’ parameters were combined exhaustively. For a given combination of these parameters, each frame in the se-quence was then analysed in turn. Edge points from each frame incremented cells in the 2D accumulator indexed by values for the initial coordinates ðcx0;cy0Þ for the current combination of the remaining parameters. For any combination of the search parameters an edge point, at a given time instance, is mapped onto a line in thecx0cy0-plane. BresenhamÕs line drawing algorithm [4] was used to cast the votes in the accumulator space. Once all the frames had been processed, the accumulator space was searched for a peak. A second 2D accumulator was used to store the peak value and the values of the parameters that related to it. The peak in the first space was compared with the peak in the second at the same coordinatesðcx0;cy0Þ. If the new peak was greater, the parameter information and peak height in the second ac-cumulator space was updated to that of the newer peak. The approach naturally se-lects the largest object, as usual in evidence gathering, though the accumulator space could be weighted so as to cause selection of a different feature. Note that with this technique, instances of the model that have the same initial coordinatesðcx0;cy0Þ can-not be found, as one will overwrite the others (though this can be avoided in imple-mentation). This method offered a reduction in storage space of the accumulator, from a 10-dimensional space to two 2-dimensional spaces (for the reduced model). There was negligible effect on the computation time since to create the first 2D accu-mulator space the 10-dimensional parameter space must be exhaustively searched.
[image:18.544.100.476.127.254.2]In order to provide a basis for comparison, a technique based on extant work was used. As described in [24], the VHT demonstrates greater noise immunity compared with the traditional temporal feature extraction method, the Hough Transform Tracking (HTT) method. For a given feature, the HTT method applies the SHT Table 1
Parameters of gait model and the equations they are used in
Parameters Equation
Vy cyðtÞ ¼Vyt
Vx,a,b c xðtÞ ¼
b x0
þ Vxt
þ a
x0
sinx0tþ
b x0
cosx0t
cx0 rx¼cx0þcxðtÞ ksin/ðtÞ
cy0 ry¼cy0þcyðtÞ þkcos/ðtÞ
a0,bk,ck
/ðtÞ ¼a0þ2
XN
k¼1
½bkcoskx0tcksinkx0t
to each frame in a sequence to extract the static parameter values the feature at the time instances given by each frame. The temporal parameters are calculated from the static parameters by interpolation. The next section compares the performance in noise of the VHT and HTT when applied to extract the human gait model described earlier.
3.3.2. Performance in noise
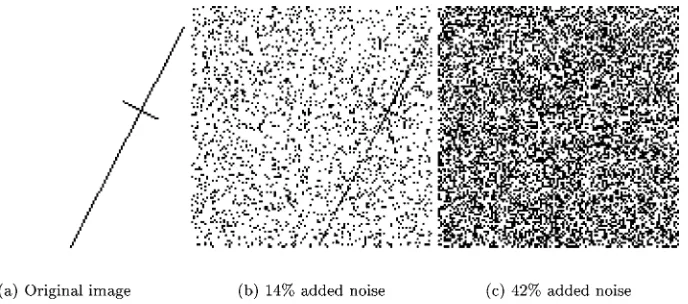
A sequence of synthetic images was produced using the reduced gait model, and a VHT was implemented to extract the gait model parameters. An example is shown in Fig. 7(a) where the long line indicates the position of the simulated leg. The short line is for display only, depicting the position of the hip. Varying amounts of uniformly distributed, black and white noise were added to the sequence, and the model was extracted using both VHT and HTT techniques. The noise was added randomly to each image in the sequence such that each image had the same amount of noisy points, but in different positions. Fig. 7 shows examples of uniformly distributed, black and white noise added to an example image with levels of 14% and 42%. In the latter case it is impossible to determine the line in the static image by human vision.
The VHT to extract the reduced human gait model was implemented as described in Section 3.3.1. A restricted range of values for each parameter was used in order to maintain the computational time at an acceptable level. The HTT was performed by applying the SHT to each image in a given sequence, using established performance constraints [31]. The parametersqand/of the most prominent line extracted from each frame, along with the time valueti for that frame, were used to calculate the parameters of the human gait model. Least-squares analysis was used to fit this data to the model.
[image:19.544.94.438.475.627.2]The extracted model parameters were compared against the actual values of the parameters used to produce the synthetic images, giving a Euclidean distance metric to quantify the performance of the extraction technique. Since all of the parameters
did not have the same quantisation in the VHT implementation, the Euclidean dis-tance metric could not be calculated merely as the root of the sum of squared differ-ences in each set of extracted parameters. For example, a difference of unity in the value of initialxcoordinate cx0 would not be as significant as that same difference in the value of harmonic weightb1. As such, the difference for each parameter value was normalised by dividing it by its quantisation value as used in the VHT. There-fore, the Euclidean distanceDbetween each model instance is given by
D¼
ffiffiffiffiffiffiffiffiffiffiffiffiffiffiffiffiffiffiffiffiffiffiffiffiffiffiffiffiffiffiffi XP1
i¼0
xiyi
qi
2
v u u
t ; ð20Þ
wherePis the number of parameters in the human gait model,xiandyirepresent the
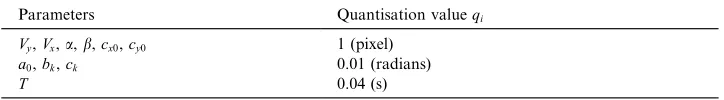
ith parameter as extracted by the VHT and HTT, respectively, andqiis the quan-tisation of the ith parameter. Table 2 lists the quantisation values for each param-eter. Note that these values were determined through experimentation to give the most satisfactory results. In this way, the Euclidean distance D given by Eq. (20) represents the distance in accumulator space. For instance, a value ofD¼50 for two given extracted models implies that their parameters were an average distance of 50 cells apart in the accumulator space. Using the quantisation values given in Table 2, this distanceD¼50 produces a 50 pixel difference in values for the initialx -coor-dinatecx0, or a difference of 0.5 radians (28.6°) in the harmonic weightb1.
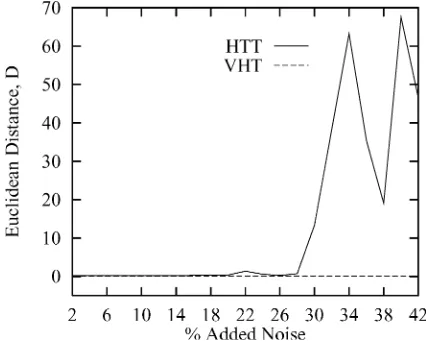
[image:20.544.100.462.591.641.2]Fig. 8 shows the performance of the VHT and the HTT techniques in extracting the model parameters from the synthetic images with noise levels of 2%, 5%, and then from 10% up to 42% in 2% steps. As Fig. 8 demonstrates, the VHT moving fea-ture extraction method found the exact parameter values for the gait model even in noise levels of 42%, wherein the static image of Fig. 7(c) the line could not be seen. The performance of the HTT deteriorated at around the 30% level of noise. The ex-tracted parameter values for the gait model were found to be progressively further away from the actual values as the noise level was increased above 30%. The ex-tracted model parameters for the 34% case were found to be quite far from the actual values, compared to the distances for noise levels immediately above and below. This appears due to the random process in which the noise was added, leading to there being a line extracted in one of the images that was sufficiently out of place to effect the least squares analysis to produce more distant parameter values. Similarly, the comparatively small distance for the 38% case was due to the added noise affecting the line extraction to find lines not too distant from the original. The least squares analysis was able to produce parameter values that were not as erroneous as for
Table 2
Quantisation values used in the VHT and GA implementations
Parameters Quantisation valueqi
Vy,Vx,a,b,cx0,cy0 1 (pixel)
a0,bk,ck 0.01 (radians)
the surrounding levels of noise. This demonstrates the dependence of the HTT meth-od on the structural information in every the frame of a sequence—one image with missing data will mislead the extraction of the model parameters. It can also be viewed to demonstrate practical advantage since the noise gives a varying back-ground. Clearly, the VHT technique focuses better on the moving object and is less distracted by background information.
Like all Hough-based processes, the VHT suffers from a high computational com-plexity and storage cost. For problems of low dimensionality, Hough-based ap-proaches to feature extraction are quick and precise, but it becomes rapidly unfeasible to create and search an accumulator as the number of parameters to es-timate increases. Using the technique for fast contour recognition presented in [7], the storage and peak detection problem was reduced to that of two 2-dimensional accumulator spaces (see Section 3.3.1). The computational complexity remains as an exhaustive search of the parameter space was still required.
3.3.3. Implementation by genetic algorithm
[image:21.544.156.369.107.278.2]Extracting model instances from images is effectively a problem in optimising the defining function of the model for a given set of edge points. A Genetic Algorithm (GA) [8] is an optimisation method that is shown to consistently outperform many other search methods in solving hard optimisation problems. For a satisfactory sized parameter space, the VHT implementation took the order of days to run on a P75 PC. The GA based VHT to extract the human gait model takes approximately 20 min on the same parameter space, offering a speed-up factor of approximately 100. As such, all further experimentation was performed using a GA based implementation. In this GA implementation, each individualÕs chromosome was the binary coding of the parameters of the gait model. Each parameter was represented by n bits which gave an integer index to a position within a specified range. Naturally, the value of n
controlled the resolution for each parameter. The fitness was derived from the num-ber of edge points matching those calculated for the (moving) template described by the current values within the chromosome. The fittest individuals were selected as those that had a greater probability that a spin of a biased roulette wheel would se-lect them. Crossover was set to occur with a probability of 0.7 and mutation with a probability equaling the reciprocal of the maximum population (the effect of which was to complement the mutated bit). New generations were evolved until the stop-ping criterion was satisfied where the stopstop-ping criterion was either when the average fitness had evolved to 95% of the maximum fitness in the population, or when 200 generations had been reached. The final values provided by the GA were used to ini-tiate a fine-grained VHT search.
3.4. Performance factor analysis
Due to the random nature of a GA, repeated trials of a GA on the same data set are not guaranteed to produce the same result. This problem is further compounded if the solution space is complex, containing many local peaks and valleys. Similarly, if the problem is unimodal with a large peak compared to the surrounding space, a GA will also have problems in finding consistent solutions. With the SHT for lines and circles, the complex solution space can be smoothed by correct quantisation of the parameters [31]. Even with this smoothing of the parameter space, it has not been possible to extract consistent results when using a GA to find geometric primitives in images [17]. In the work by [17], trials were repeated 100 times for a given image and the parameters of the extracted shape were calculated as an average of the repeated trials.
Due to the high dimensionality of the gait model, it is not possible to find optimal quantisation values for the various parameters with the methods used by [31]. Also, averaging the parameters determined in repeated trials [17] would not produce a vi-able solution. Due to the complexity of the solution space, the GA is likely to find one of the many false peaks that are due to anomalies present over the entire se-quence, in at least one of the repeated trials. Accordingly, averaging a set of param-eter values would be detrimental in finding an accurate solution.
3.4.1. GA performance for occluded features
A characteristic of the VHT is that it can extract temporal features in scenes where the feature has been occluded. This is attractive in extracting human gait models as the human body is self-occluding in almost all its motions. As such, the GA based VHT for gait analysis, GAVHT, was tested for the presence or absence of this char-acteristic, at increasing levels of occlusion. The experimentation was performed on sequences of edge images of walking subjects. The Canny edge detector with hyster-esis thresholding was used to produce the edge images from the greylevel sequences. The reduced human gait model (Section 3.3) was used in this performance experi-ment. The parameters of the model were quantised with the values given in Table 2. Also, the GA was implemented with a chromosome population of 500.
A major advantage of the VHT method of moving feature extraction over the tra-ditional static, frame-by-frame moving feature extraction is its improved perfor-mance in sequences where the feature has been occluded in some frames. As such, an analysis of the GAVHTÕs performance in extracting the gait model for an oc-cluded subject was performed to verify that this occlusion immunity characteristic of the VHT extraction method had been maintained in its translation to a GA. Fig. 10 shows the extracted model for the unoccluded sequence for subject CM using the GAVHT. The model used only a first-order FS to represent the hip rotation.
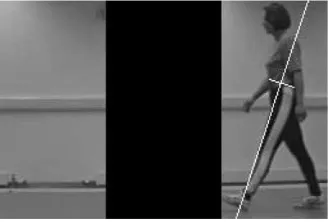
As Fig. 10 shows, the inclination of the hip is tracked throughout the cycle al-though without much precision. This was due to the low order of FS used to model the motion of the hip rotation, but for the purposes of this exercise it was sufficient. The subject CM in Fig. 10 was occluded by simulating a column in the centre of the field of view of the camera, between the subject and the camera. The illusion was created by setting the pixels with the column to zero (black). Fig. 9 shows an example of this process, with the column width set to 90 pixels, representing almost two fifths of the image width.
[image:23.544.182.346.515.626.2]A series of tests was then conducted on the sequence in Fig. 10. The same param-eterisation and initialisation was used in all the tests, with the variable parameter be-tween each sequence being the width of the occluding column. The width was varied from 10 pixels to 150 pixels in increments of 20 pixels. The model parameters ex-tracted by the GAVHT for the occluded sequences were compared against those
extracted from the unoccluded sequence. The performance of the GA for gait anal-ysis in extracting the model from these occluded sequences was measured using the method described in Section 3.3.2. Fig. 11 shows the performance of the GAVHT for the occluded sequences. As the graph in Fig. 11 demonstrates, the performance of the GAVHT as the occluding column is widened remains comparable to its perfor-mance in the unoccluded sequence. The accuracy of the model parameter extraction deteriorates as the column width increases beyond 110 pixels, which represents al-most half the image width. As such, the GA implementation of the VHT for gait analysis is shown to possess improved performance for occluded objects, which is characteristic of VHT techniques for extracting temporal features.
[image:24.544.118.447.103.454.2]in four frames (F6, F7, F8, and F9) of the sequence, and partly occluded in two frames (F5 and F10): accordingly, the feature of interest was missing in 50% of the data available. Even with this amount of missing data, the subjectÕs hip rotation was extracted with the parameter values only a single accumulator cellÕs distance apart from those extracted in Fig. 10, the unoccluded sequence. The initialx -coordi-nate of the hip was also the same as that found in Fig. 10, as well as the horizontal and vertical velocities, Vx and Vy respectively, the period T, and the parameter a. Small discrepancies between the two extracted models occurred in the values of the parameterband the initial y-coordinate. Table 3 summarises the extracted pa-rameter values.
3.5. Recognition results
A CCD array camera on a tripod without a shutter was used to collect data, and its output was recorded on a video recorder. The camera was situated with a plane normal to the subjectÕs path in an environment with controlled illumination. Data collection was performed indoors, with lighting at a constant level. Subjects walked in front of a plain, static background. Each subject wore a special set of trousers that had a stripe down the middle of the outside of each leg. The new technique does not actually rely on the stripe as the front of the leg equally would be ex-tracted. However, the presence of the stripe allows clearer assessment of extraction accuracy. In this way the camera-side leg could be distinguished visually from the other leg at all times. Fig. 13 shows an example image of a walking person used in this study.
Each subject was asked walk past the camera a total of ten times. From these ten sequences, the first and last three were discarded and only the middle four sequences were used for experimentation. In the first few sequences the subject would begetting
comfortablewith the experiment, and in the last few the subject would be anxious to
[image:25.544.181.350.108.246.2]finish the experiment. As such, the middle four sequences were considered to offer the most consistent walking cycles.
Analysis used images between successive heel-strikes of the same foot, ensuring time alignment so that phase information could be compared and that subjects were not recognised by the speed of their walk. In these initial studies, to obtain Fig. 12. Extracted thigh model for subject CM from an occluded sequence, with the occluding column width of 90 pixels.
Table 3
Extracted gait model parameters for unoccluded and occluded sequences of subject CM, from Figs. 10 and 12, respectively
Sequence Hip model Hip rotation model T
a b cx0 cy0 Vx Vy a0 b1 c1
Unoccluded )5 3 219 63 118 1 0 0.16 )0.02 1.12
[image:26.544.101.461.533.587.2]meaningful information about the rotation pattern, it was essential that each subject travelled at a constant velocity. Room was given to allow the subjects to accelerate to a comfortable, constant walking speed before entering the field of view of the cam-era. The video sequences were digitised into the PGM image format. Resolution was reduced by halving the image size to 128128 in order to speed processing.
Recognition analysis using the GAVHT, was initially performed on the walking sequences for ten subjects. Edge images of the sequence were produced by applying the Canny edge detector with hysteresis thresholding to the images. The GAVHT was used to extract a maximum likelihood estimate of the parameters for the thigh model (Section 3.2) in a given sequence. As an initial analysis of the performance of these novel techniques, the gait model extracted from the walking sequences de-scribed the hip rotation with a second-order FS. The full fifth-order FS was not used so as to reduce the complexity of the parameter search space. The parameters of the model were quantised with the values in Table 2, and the GA was again implemented with a chromosome population of 500.
3.5.1. Extracting the gait model
[image:27.544.181.346.107.270.2]Fig. 14presents the extracted thigh model superimposed over the original se-quence of images for subject IM. The inclination of the thigh appears to have been found precisely in the majority of the frames. The model extraction showed less ro-tation than the leg in the first frame of the sequence and then aligned itself with the thigh in the second frame, only to over-shoot in the third. The accuracy was regained in the fourth frame. In frames eight and nine, the estimated motion of the thigh was not sufficiently fast to follow the true motion of the thigh in this part of the gait cycle. This inaccuracy was most likely due to the use of just two harmonics to model the thigh motion. As stated before, the motion of the thigh contains useful harmonic content up to the fifth harmonic. The model extraction in the last frame of the se-quence shows the correct inclination, but the position of the thigh appears to trail
the hip. This was an inaccuracy in the estimation of the horizontal displacement of the hip (see Section 3.2.1) rather than an error due to the hip rotation model. Note that the estimated location of the hip was marked by a line normal to the long line representing the thigh.
Using the parameters of the gait model extracted from the walking sequence, the hip rotation pattern was given by Eq. (15) without the need for curve fitting. Fig. 15 shows the extracted hip rotation pattern for the gait cycle of subject IM shown in Fig. 14. The extracted rotation pattern also compared well with the generalised hip rotation pattern presented in medical research [22].
[image:28.544.116.448.103.472.2]extracted thigh model matches well the expected position of the moving thigh even though the subjectÕs hand was occluding the top of the thigh in the some of the frames of the sequence. In the first frame of the sequence, the extracted inclination appeared to be in advance, but in the second frame the model extraction aligned itself precisely with the leg. A similar pattern occurred in the next two frames, where the model extraction appeared to trail the thigh in the third frame and aligned accurately in the fourth. Frames five, six, and eight showed a precise ex-traction of the thigh, whilst frame seven showed the model to have a greater rota-tion than the leg. In frames nine to eleven, the thigh inclinarota-tion was extracted with precision, but again in frame twelve the extraction described a greater rotation than the thigh.
In Fig. 16, the estimated position of the hip was extracted with accuracy in the first two frames, and then again in the middle four frames. In the remaining frames the hip position appeared to trail the expected location of the hip, which was deemed to be intersection of the front of the stripe with the waist line.
Fig. 17 shows the hip rotation pattern for the sequence in Fig. 16 as described by the extracted parameters of the gait model.
3.5.2. Fourier analysis
[image:29.544.183.343.108.230.2]The frequency information of the hip rotation was extracted directly from the ev-idence gathering process. Eqs. (18) and (19) were used to calculate the magnitude and phase of the frequency spectrum using the FS coefficients. For the gait cycle of subject DC in Fig. 16, a second-order FS was used to model the hip rotation. The magnitude and phase plots for this FS are shown in Fig. 18. Note that the Fou-rier transforms reflect around 0 Hz. From the magnitude plot, it can be seen that in-formation above the second harmonic is meaningless as the magnitude drops to zero at and beyond the third harmonic. Accordingly, fork-nearest neighbour classifica-tion the metric used to calculate the Euclidean distanceDbetween test feature vec-tors and training feature vecvec-tors was based on the components between 0 and +2 Hz. Fig. 19 shows the magnitude and phase plots for the FS describing the hip rota-tion pattern for the gait cycle of subject IM in Fig. 14.
3.5.3. Classification results
[image:30.544.117.447.103.473.2]For the classification analysis, two measures were compared; the Fourier magni-tude and the phase-weighted Fourier magnimagni-tude. Walking sequences for ten subjects were used, each subject having four walking sequences; three training sequences and one test sequence. The measure for each test sequence was compared against those for the training sequences. Thek-nearest neighbour rule was used to classify the dif-ferences in these measures fork¼1 andk¼3. Table 4summarises the correct clas-sification rates (CCR) for the two measures. Unlike the earlier study [5], the nearest neighbour classification led to the same classification performance as the 3-nearest neighbour rule.
Fig. 17. Hip rotation pattern extracted with the thigh model for the sequence in Fig. 16.
Fig. 18. Magnitude and phase plots for hip rotation as described by FS coefficients for gait cycle of subject DC in Fig. 16.
[image:31.544.106.424.468.617.2]Classification analysis showed that the phase-weighted Fourier magnitude offered a better classification rate (100%) than just the Fourier magnitude (80%), verifying earlier work in [5]. This suggests that subjects are recognised not only by flexion, but also by the time when it occurs; both the phase and the magnitude of the oscil-latory motion would intuitively appear to describe a particular pendulum better. Di-rect generation of the Fourier information from the evidence gathering process was possible using the FS coefficients, and as such no further transform processing was required. Using this evidence gathering technique, improved classification rates, of 100% for both k¼1 and k¼3, were achieved compared to those obtained using the computer vision techniques in [5], on the same data being 80% and 90% for
k¼1 and k¼3, respectively.
3.5.4. Statistical analysis
A statistical analysis was performed on the experimental data to establish a basis for the improved classification performance of the phase-weighted Fourier magni-tude metric over the Fourier magnimagni-tude metric. A statistical measure was required that described the distribution of subject, or class, clusters in the feature space. The separationS between due to class means, normalised with respect to class co-variances, was used. The separationSi;j between subjectsiandjis given by
Si;j¼ ½mimj
RiþRj 2
1
½mimj
T
; ð21Þ
wheremiis the mean andRiis the covariance of classi. This measure is the first term of the Bhattacharyya-distance.
The mean signaturemi for each classi is calculated by
mi;k¼ 1
M X
M1
l¼0
xil;k; k¼0;1;. . .;N; ð22Þ
whereM is the number of experiments for classi,N is the number of harmonics (as used in Eq. (15)) andxi is anMN data matrix of signatures for classi. The co-variance matrixRiis given by
Ri¼ 1
M X
M1
l¼0
ðxilmiÞ T
xil
mi
: ð23Þ
[image:32.544.100.457.128.166.2]The data matrix xi for each subject was generated using the Fourier magnitude metric and the phase-weighted Fourier magnitude metric. Figs. 20(a) and (b) illus-trate the separation S as calculated from the Fourier magnitude metric and the Table 4
Overall classification performance
No. of nearest neighbours Magnitude CCR Phase-weighted magnitude CCR
k¼1 80% 100%
phase-weighted Fourier magnitude metric, respectively. The separation was nor-malised to be in the range [0,1]. As Fig. 20 shows, the phase-weighted Fourier magnitude metric demonstrates a greater separation between the mean signature of each subject in the database than the Fourier magnitude metric, as the points are much brighter in Fig. 20(a) than they are in Fig. 20(b).
[image:33.544.115.418.104.266.2]Using the separationS, the average class separation was calculated for both met-rics. Table 5 shows that the phase-weighted Fourier magnitude metric has a greater average distance between subjects than the Fourier magnitude metric. This suggests that a better CCR could achieved using the phase-weighted Fourier magnitude met-ric over the Fourier magnitude metmet-ric, a suggestion that is supported by the classi-fication results in Table 4. The average separation between subjects for a given metric indicates its relative performance to other metrics on a given database. It would be difficult to use this measure to estimate generalisation capability (the size of popula-tion that the metric could perform satisfactorily on) since new subject signatures could naturally lie outside the space defined by the current set of gait signatures. Clearly, since the average distance is larger for the phase-weighted data than it is for the magnitude data, the phase-weighted data would appear to be able to handle a larger population with equal performance (should the signatures fall within the space already defined) since the potential for confusion is much less than for magni-tude data alone. However, the improved CCR of the phase-weighted Fourier
Fig. 20. SeparationSof mean subject signatures, normalised with respect to subject covariances.
Table 5
Average separation between subjects for Fourier magnitude metric and phase-weighted Fourier magnitude metric
Metric Average separation
Fourier magnitude 0.105
[image:33.544.84.446.601.641.2]magnitude signature over the Fourier magnitude signature has been predicted through a statistical analysis of the experimental data.
4. Further work
The aims of the research initially outlined were fulfilled. In this process, several areas were identified for further study. Preliminary experimentation was performed into investigating the extension of the human gait model itself to encompass other limbs. Including the lower legs, or even the torso or arms, into the model has several implications. Firstly, there is the problem of how to handle the ever increasing di-mensionality of the model. GAs offer one solution to the didi-mensionality problem. Also, the relative independence of each limb can be explored to maximise paralleli-sation of the model extraction. Secondly, given the extraction of multiple limbs there exists the problem of how this information can be combined to achieve the best dis-criminatory power in the classification process.
Also, the pre-processing of the images can be investigated for more reliable and accurate extraction of model parameters. Some pre-processing techniques and their potential implications are discussed.
Application of the technique described in Section 3 to a wider database is required to verify and improve the recognition performance. Also, the effects of footwear, running, weight-bearing, and loose apparel (and without stripes) on the classification rate requires study. In this research the data for each subject was obtained in the same session. This is not representative of a practical application and therefore sub-ject data should be obtained on different occasions. This will allow the variability of signatures for a given individual to be assessed to establish possible class bounds. It would also appear worthwhile to assess the potential effect of background, though the simulation tests in noise (Section 3.3.2) have indicated good ability to handle background. Clearly, imagery with multiple moving people will require a new strat-egy to interpret the accumulator space.
The extraction of the human gait model from different camera perspectives of the walking subject must be addressed and evidence gathering techniques for these alter-native view points developed. Work by [3] extracted 3D trajectories of moving ob-jects in a scene. This work assumed all motion to be contained in a given (ground) plane, allowing the 3D trajectories to be tracked with a single camera. Ap-plication of this tracking technique to gait model extraction from varying camera perspectives requires investigation.
4.1. Extending the human gait model
position of the knee, the thigh requires a lengthtl. Similarly, the shin can be given a lengthkl, allowing even further extension to the inclusion of the foot. The extended human gait model is shown in Fig. 21. The motion model for the human gait model remains as described in Section 3.2.1, but with the addition of the knee rotationhðtÞ. As with the hip rotation/ðtÞ, the knee rotationhðtÞcan be modelled by a FS:
hðtÞ ¼a0þ2
XL
k¼1
½bkcoskx0tcksinkx0t; ð24Þ
where L is the number of harmonics used to describe the knee rotation hðtÞ. The structural model for the human gait model requires a slight modification to ac-commodate the addition of the lower leg. An arbitrary pointron the model is now described by
r¼ cðtÞ þkuðtÞ 06k<tl; kðtÞ þkpðtÞ tl6k6tlþkl;
ð25Þ
wheretlandklare the lengths of the thigh and shin, respectively,cðtÞis the position vector of the pelvis,uðtÞis the unit vector of the direction of the thigh, kðtÞis the position vector of the knee,pðtÞis the unit vector of the direction of the shin, andk
can take any real value between 0 andtlþkl. The values ofkðtÞandpðtÞare given by
kðtÞ ¼cðtÞ þtluðtÞ; ð26Þ
pðtÞ ¼ ðsin½/ðtÞ hðtÞ;cos½/ðtÞ hðtÞÞ; ð27Þ
[image:35.544.178.343.420.629.2]where/ðtÞis the hip rotation and hðtÞis the knee rotation.
The GA for gait analysis was modified to extract the extended gait model de-scribed above. Fig. 22 shows this extracted model for subject RW. Both the rotation of the thigh and knee were modelled by second-order FS in the model extraction in Fig. 22. The inclination of the thigh appears to have been precisely extracted throughout the majority of the sequence. Frames four and ten show the thigh extrac-tion to have a greater rotaextrac-tion than perceived for subjectÕs thigh. The rotation of the knee appears to have been extracted with less accuracy. This is especially evident in frames four, five, and seven to nine. This could be due to its dependence on the pre-cision of the thigh extraction. Also, from the medical studies described in chapter 2, the knee rotation characteristically has a rapid and large change in inclination over the latter part of the gait cycle, as it goes into flexion then extension. This behaviour will not have been faithfully reproduced by the second-order FS used to represent the knee rotation in this extraction. The greatest inaccuracies in the model extraction seem to have been in the motion of the pelvis. Slight inaccuracy in the extracted av-erage velocityVx resulted in the model extraction falling behind in the final frames,
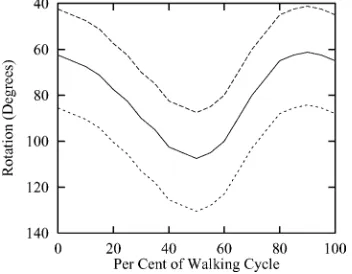

![Fig. 6. Transverse pelvic rotation [22].](https://thumb-us.123doks.com/thumbv2/123dok_us/1007652.615498/15.544.177.348.109.244/fig-transverse-pelvic-rotation.webp)