Benchmarking Ireland’s
Productivity
Introduction to the National Competitiveness Council
The National Competitiveness Council reports to the Taoiseach and the Government, through the Minister for Jobs, Enterprise and Innovation on key competitiveness issues facing the Irish economy and offers
recommendations on policy actions required to enhance Ireland’s competitive position. Each year the NCC publishes two annual reports:
Ireland’s Competitiveness Scorecard provides a comprehensive statistical assessment of Ireland's
competitiveness performance; and
Ireland’s Competitiveness Challenge uses this information along with the latest research to outline the
main challenges to Ireland’s competitiveness and the policy responses required to meet them.
As part of its work, the NCC also:
Publishes the Costs of Doing Business where key business costs in Ireland are benchmarked against costs
in competitor countries; and
Provides an annual Submission to the Action Plan for Jobs, quarterly bulletins on competitiveness and
other papers on specific competitiveness issues.
The work of the National Competitiveness Council is underpinned by research and analysis undertaken by the Strategic Policy Division of the Department of Jobs, Enterprise and Innovation.
The NCC’s Competitiveness Framework
National Competitiveness Council Members
Professor Peter Clinch Chair, National Competitiveness Council
Pat Beirne Chief Executive Officer, Mergon Group
Kevin Callinan Deputy General Secretary, IMPACT Trade Union
Micheál Collins Associate Professor, School of Social Policy, Social Work and Social Justice, UCD
Isolde Goggin Chair, Competition and Consumer Protection Commission
Cathríona Halahan CEO/Managing Director (Ireland), Microsoft
Declan Hughes Assistant Secretary, Department of Jobs, Enterprise and Innovation
Jane Magnier Joint Managing Director, Abbey Tours
Danny McCoy Chief Executive Officer, IBEC
Seán O'Driscoll President, Glen Dimplex Group
Louise Phelan Vice President of Global Operations, Europe Middle East and Africa, PayPal
Dave Shanahan Chief Executive, Adagio Ventures Commercialisation Partners
Martin Shanahan Chief Executive, IDA Ireland
Julie Sinnamon Chief Executive, Enterprise Ireland
Ian Talbot Chief Executive, Chambers Ireland
Jim Woulfe Chief Executive, Dairygold Co-Operative Society Limited
Council Advisers
Brid Cannon Department of Agriculture, Food and the Marine
Patricia Cronin Department of Communications, Climate Action and Natural Resources
Kathleen Gavin Department of Education and Skills
John McCarthy Department of Finance
Conan McKenna Department of Justice and Equality
David Moloney Department of Public Expenditure and Reform
Ray O’Leary Department of Transport, Tourism, and Sport
David Walsh Department of Housing, Planning, Community and Local Government
John Shaw Department of the Taoiseach
Research, Analysis and Administration
Marie Bourke Department of Jobs, Enterprise and Innovation
Eoin Cuddihy 23 Kildare Street, Dublin 2, D02 TD30
Conor Hand Tel: 01 6312121
John Maher Email: [email protected]
Chairman’s Preface
Productivity is a multi-dimensional concept; it reflects our ability to produce more output by better combining inputs, thanks to new ideas, technological innovations and new business models. Measures of productivity growth constitute core indicators for the analysis of economic growth. Productivity growth is the primary way of financing improved living standards, wages and public services.
As set out in our framework for competitiveness analysis, the National
Competitiveness Council considers productivity a crucial component and driver of Ireland’s international competitiveness performance. In 2012 the Council published reports on Irish productivity for the period 1980-2011. Four years on, is important to revisit this work and benchmark Ireland’s performance given the changes that have occurred in the Irish and global economy and the growing importance of productivity as a source of economic growth and
competitiveness.
Global trends suggest that the rate of productivity growth has slowed both in terms of labour productivity and total factor productivity. Closer to home, average euro area and UK productivity growth rates are significantly lower than levels in the United States. Overall, Ireland’s productivity performance is relatively strong and above the Euro area average and levels seen in the UK. However, Ireland’s performance is highly influenced by shifts in the composition of employment and the influence of the FDI sector on output. Increasing productivity across all sectors remains a significant challenge in ensuring growth is sustainable in the long run. Ireland can take advantage of a sizeable competitiveness opportunity if we can avoid the ‘productivity trap’ being experienced by many developed economies.
Just as productivity performance differs between countries, so too it differs between sectors and firms. At sectoral level, growth in the value of output is driven primarily by ‘modern’ Manufacturing and services traded internationally. In Ireland, the performance of modern Manufacturing, ICT and Professional Services is particularly strong, while the contribution from sectors such as Retail and accommodation and food remains low. Equally, divergent firm-level productivity performance directly impacts upon aggregate national performance. OECD research indicates that firms can be classified into three cohorts based on their productivity performance: the globally most productive firms (i.e. global frontier firms); the most advanced firms nationally; and laggard firms. Despite the generally positive trends in Irish productivity performance, the trajectory of Ireland’s growth path is linked to the performance of Ireland’s high-productivity sectors such as ICT and manufacturing where value added is dominated by multinational firms. The narrow base of sectors driving overall productivity performance leaves Ireland vulnerable to external shocks but also serves to highlight the scope for reform. As noted by the OECD, over the next decade, productivity will increasingly be about “working smarter”, rather than “working harder”. The challenges in improving the quantity and quality of human and productive capital, and enhancing total factor productivity are complex and significant, but key to achieving long-run economic growth and rising prosperity. The Government’s enterprise strategy
Enterprise 2025 (EP2025) sets out a target for Ireland to achieve 2-2.5 per cent growth in productivity per annum over the next ten years. The Council welcomes this commitment but considers a range of actions will need to be undertaken to safeguard and enhance the drivers of Ireland’s productivity performance. The challenge will be to ensure that productivity growth is driven by a broad range of sectors.
I would like to conclude by thanking the Council members and advisers for their input throughout the development of this report. I would particularly like to acknowledge the enthusiasm, commitment and expertise of the secretariat for taking on this exceptionally important area of work.
Professor Peter Clinch
Table of Contents
Chairman’s Preface 4
Executive Summary 6
Chapter 1: Why Productivity Matters 8
1.1 Introduction 8
1.2 Recent Policy Developments 9
1.3 Competitiveness and the Determinants of Productivity Growth 10
2 Methodologies, Definitions and Scope 14
2.1. Methodologies 14
2.2. Definitions 16
3. Labour Productivity Performance 2004-2014 19
3.1 Overview 19
3.2 Productivity and the Economic Cycle in Ireland 20
3.3 Changes to Ireland’s Long-run Labour Productivity Performance 22
3.4 Labour Productivity Growth 24
4. Trends in Employment and Hours Worked 2004-2014 26
4.1 Overview 26
4.2 Trends in Hours worked 29
5. Trends in Productivity at Sector level 33
5.1 Overview 33
5.2 Total and Sectoral Output Trends 33
5.3 Trends in Labour Productivity Growth at Sectoral Level 37
5.4 Sectoral Contributions to Business Sector Labour Productivity 39
5.5 Trends in Sectoral Gross Value Added per hour Worked 40
5.6 Focus on Sectors 41
6. Investment and Capital Productivity Trends 54
6.1 Context 54
6.2 Trends in Investment 54
6.3 Capital Productivity Growth 56
7. Multifactor Productivity 58
7.1 Context 58
7.2 Trends in MFP Growth 58
8.1 Context 60
8.2 Labour Productivity by Firm Size 60
8.3 Multifactor Productivity at Firm Level 63
8.4 Productivity and Firm Ownership 64
9. Conclusions and Implications for Policy 69
9.1 Extending Global Connectedness via Trade, FDI, and Participation in Global Value Chains 70
9.2 Facilitating Start-ups and Scaling of Firms 72
Executive Summary
Since its inception in 1997, the National Competitiveness Council has considered productivity a subject of continuous importance. In 2006 and 2012 the Council published reports on Ireland’s productivity performance spanning the period 1980-2011. This report is a benchmarking review of measured productivity performance over the period 2004-2014. The research draws extensively on productivity data by the Organisation for Economic Co-operation and Development (OECD), and examines both the overall performance relative to other countries (primarily the UK, Denmark, the Euro area and US) and the performance of individual sectors within Ireland. The report also considers Ireland’s medium term productivity potential with regard to specific areas of policy focus which have the potential to broaden and deepen Irish productivity growth in the medium term.
Key Findings
Over the decade 2004-2014, productivity growth has slowed in most OECD member states. The decline in
labour productivity growth was underway prior to the crisis, in both manufacturing and business sector services and growth remains subdued.
Ireland is a small open economy and has seen considerable shifts in the composition of economic activity
over the period 2004-2014. Ireland’s labour productivity performance as measured by the OECD is strong in an international context. Starting from a low base, Irish productivity levels now exceed those of many of our peers and key competitors. Ireland’s labour productivity levels have increased but are weakening.
Despite the severity of the economic crisis on output and employment levels, Ireland has continued to
demonstrate strong levels of output and labour productivity (GDP per hour worked). OECD data indicates that in terms of output levels (i.e. GDP per hour worked), Irish labour productivity levels improved considerably in the past five years with average annual growth of 2.7 per cent. Using OECD data, Ireland’s output per hour was $62.02 in 2014, an increase of 21.9 per cent compared with 2004. This represents the fifth highest labour productivity level among OECD member states, after Luxembourg, Norway, the US and Belgium.
Labour productivity growth in Ireland is exceptionally strong. At 3.1 per cent, the growth rate of Irish
(GDP) productivity per hour worked in 2014 exceeded the OECD average (1.5%). In the last decade, Ireland’s gross value added output per hour increased by 20 per cent compared to growth of 10 per cent and 5 per cent in the Euro area and UK respectively. US levels increased by 13 per cent. However, when measured using GNP per hour worked, Ireland’s relative position declines significantly.
Ireland’s productivity performance is heavily influenced by the performance of the Manufacturing and ICT
sectors and the FDI sector. Ireland’s output is more concentrated in Manufacturing and ICT than either the EU or the US. Within Manufacturing, output is dominated by chemicals, electronics and ICT where productivity measures are difficult to interpret due to the activities of multinational corporations. Ireland’s financial sector is important but appears to be underperforming, relative to productivity performance before the crisis. Again methodological issues make it difficult to assess its productivity performance.
At sector level, labour productivity growth between 2004 and 2014 was driven primarily by strong
productivity growth in Manufacturing, ICT and Professional Services. The broad Food and Agriculture, Forestry and Fishing sector and the traditional Wholesale, Retail, Accommodation and Food services sector have not experienced similar productivity growth. The fall in employment (and thus hours worked) in these labour intensive sector affected the aggregate productivity figures, particularly over the
2008-2010 period when significant hours worked in construction were shed.Over the period 2004-2014 Irish
There is significant divergence at sectoral level in terms of output per hour. The contribution of an individual sector to overall productivity growth is dependent on its productivity growth rate, and its share of total value added and hours worked. In 2014, output per hour worked in Ireland was highest in the ICT (€133) and manufacturing (€81) sectors, and lowest in construction (€12) and agriculture (€9).
Manufacturing accounts for approximately a third of productivity growth in Ireland. The relative
contribution of ICT is also strong and the financial services and Professional Services sectors also made positive contributions to business sector productivity growth in Ireland. Taking the period as a whole, the significant negative contribution (-0.7 percentage points) of the Wholesale, Retail, Transport,
Accommodation and Food sector to Irish productivity growth is notable and in contrast to the trend in the other selected countries, particularly in the UK.
Comparing the performance of sectors across Ireland, higher value-added sectors outperform smaller
sectors in per-hour productivity, even bearing in mind the caveats about the use of value-added statistics in certain sectors.
Assessing productivity in terms of value added per person employed, firm size appears to matter. In most
countries there is a significant productivity gap between micro, small and medium-sized firms compared to large firms. In Ireland, labour productivity amongst micro firms in the manufacturing sector was 60 per cent less than that of larger firms; the gap between medium and small firms compared to large firms was 84 per cent and 66 per cent respectively. The gap is also pronounced in the Irish services sector.
Labour productivity metrics only partially reflect the actual productivity of labour. Reflecting the
slowdown in investment and capital services growth since 2004, capital productivity growth has been negative or minimal in Ireland and in all of the countries considered in this report. As a percentage of total economy gross fixed capital formation, the share of investment in intellectual property products has increased from 13 per cent in 2004 to 26.8 per cent in 2014.
Multifactor productivity (MFP) reflects the overall efficiency with which labour and capital inputs are used
together in the production process. Prior to the crisis, MFP growth in most OECD countries contributed strongly to productivity growth. Post crisis, MFP growth decelerated.
The most important policy considerations for increasing productivity identified by institutions such as the
OECD, IMF and European Commission, include sound macroeconomic fundamentals, a regulatory environment favourable to enterprise and start-ups, trade, access to finance, education and training and knowledge and physical infrastructure.
Increased measurement challenges in calculating GDP and the complexity of value added complicate the
process of calculating accurate productivity estimates. Such estimates require precise evaluation of output, capital, and labour metrics. The development of national data to track productivity at sectoral level in Ireland would be welcome. In addition, productivity in the public sector is as important to economic performance as the productivity of the private sector. While benchmarking the sector is a complex task, the absence of data hinders analysis of productivity performance across the total economy.
While it is difficult to directly impact national productivity performance through one simple reform path,
Chapter 1: Why Productivity Matters
1.1 Introduction
National competitiveness is a broad concept that encompasses the diverse range of factors that support the ability of firms in Ireland to achieve success in international markets, in a way that provides Ireland’s people with the opportunity to improve their living standards and quality of life. Put succinctly, sustainable
improvements in quality of life are dependent on competitiveness as this sustains economic growth. As a small open economy, growth is highly dependent on the performance of firms in international markets. In addition, the capacity of firms trading domestically to compete with imports is important. Both are a function of the competitiveness of the business environment and the range of inputs to the production process.
National competitiveness and the productivity performance of an economy are closely related, particularly for small open economies. Productivity is both an indicator and a driver of competitiveness. It is an indicator of competitiveness, because in market economies (particularly small open economies such as Ireland), regardless of the method of measurement, goods and services will only be produced – and hence labour will only be productive – when there is demand for the goods and services. Productivity is a driver of national competitiveness, as it enables firms based in Ireland to compete successfully in international markets by facilitating output to be produced in a more efficient and effective manner. Productivity is about getting more from available resources of capital and labour, and is therefore the source of long run economic growth. Improving the levels of labour and capital productivity enables enterprises to improve their efficiency and profitability. At the macro level, high levels of productivity facilitate higher wages while at the same time ensuring competitiveness.
Ultimately, productivity growth depends on the performance of individual firms which is largely beyond the direct control of policy makers. However, many of the resources that enterprises draw on to maximise productive capability come from the surrounding competitiveness environment, including for example, a sound macroeconomic environment, the education attainment and skills base of the labour force, transport and communications networks, science and technology, capital investment, competition and regulation policies and access to finance. In the long-run, productivity is the primary determinant of improvements in national living standards relative to other countries and of its economic growth.
Historically, two key dynamics drove economic growth across OECD economies; an expanding labour force and rising productivity. Growth in the labour force was fuelled by population growth and increasing labour force participation. In the longer term, while people are living longer than ever before, they are having fewer children. This means the proportion of working-age people will decline. Faster productivity gains are necessary to compensate for the waning of demographic tailwinds. After a long period during which Europe was
narrowing the productivity gap with the US, since 1995 that gap has widened steadily and shows no signs of narrowing. Europe’s average economic growth rate, both pre and post crisis, has been lower than the US. Much of this has been attributed to differences in business structures, lower levels of R&D and investment in
intangible assets, market barriers, and insufficient use of ICT1. Cumulatively, these factors make the European
operating environment for enterprise relatively less competitive and hamper productivity growth. As noted by the Conference Board, “the widespread weakness in productivity growth among major European countries points to an inability to translate technology and innovation to productivity growth, weak demand and low investment as well as an increased negative impact of structural rigidities in labour, capital, and product
markets”2.
Productivity is a measure of output produced per unit of input, and improvements in this regard are generally regarded as the ultimate engine of long run economic growth. While increases in the level of the capital stock (e.g., through higher investment) or in the supply of labour can expand the output capacity of an economy in the short run, for mature or close-to-frontier economies such as Ireland, the potential contribution to growth from these sources is declining. Contributions from additional capital investment are affected by diminishing returns and technical change, and labour supply is running up against demographic constraints and potential skills mismatches. The challenges in improving the quantity and quality of human and productive capital, and enhancing total factor productivity (through technological change, innovation and the application of
competition policy) are complex and significant but key to achieving sustainable competitiveness resulting in economic growth, jobs and improved living standards.
1.2 Recent Policy Developments
For the past decade, productivity growth has been subdued in most OECD countries. The global slowdown in productivity growth has been attributed to a mix of cyclical factors such as low investment in physical capital, in a context of weak global demand and structural factors such as inefficient markets, low levels of innovative
start-ups and skills mismatches. Recent research by the OECD3 also suggests a possible link between declining
productivity and rising income inequality as growing productivity dispersion across firms contributed to widening of the wage distribution. Ultimately improving levels of labour and capital productivity enable enterprises to increase their efficiency and profitability, and enhance the ability of countries to maintain international competitive advantage and sustainably improve living standards.
From a policy perspective, there is increased emphasis nationally and internationally on the role of and drivers
of productivity as a means of facilitating economic growth. At national level, in 2015, the Government
published Enterprise 2025, a strategy which sets out a range of cross sectoral initiatives designed to support the enterprise sector. Enterprise 2025 aims to enhance our relative competitiveness, leverage existing comparative advantage in key sectors, address structural issues in the economy, enhance the capacity of enterprises to innovate and improve productivity. In this regard, a key target of the strategy is to deliver 2-2.5 per cent productivity growth per annum in Irish companies. In addition, Foodwise 2025, the Government’s strategic plan for the development of agri-food sector over the next decade sets out how the profitability and viability will be driven by productivity improvements, particularly the adoption and application of innovative processes and technologies.
At European level, while the EU is far from a homogeneous entity in terms of productivity, performance, Europe’s average economic growth rate has been lower than the US partly due to a productivity gap. The prolonged slowdown in global productivity has been subject of considerable debate across advanced economies in recent years. Much of this is attributed by the European Commission to differences in business structures, lower levels of R&D investment, single market barriers, and insufficient use of information and communications technologies. In addition, higher costs (particularly energy), infrastructure pressures, and fewer available sources of finance make the European operating environment for enterprise relatively less competitive. Arising out of the 2015 report “Completing Europe's Economic and Monetary Union”- (the Five President’s Report), the European Commission has published a Council Recommendation on Euro-area National Productivity Boards to systematically track developments and inform the national debate in the field of productivity and competitiveness.
The OECD has had a longstanding focus on productivity: the OECD’s 2015 Economic Survey of Ireland
recommended that Ireland develop a stronger whole-of-government productivity agenda. In addition, in 2015, building on its extensive datasets and research in the area of productivity, the OECD launched a Global Forum
on Productivity4 (GFP) to foster international co-operation between public bodies with responsibility for
promoting productivity-enhancing policies.
Recognising the importance that productivity plays as the key driver of longer term competitiveness and prosperity is essential. In this regard, the prominence accorded to productivity performance in Enterprise 2025 (EP2025) is to be welcomed. While the policy mix that best supports robust and broader based productivity growth varies between countries the Council welcomes the renewed policy focus on productivity at international level.
1.3 Competitiveness and the Determinants of Productivity Growth
Research and analysis of the underlying components of economic performance indicates a wide range of factors are particularly critical for determining the rate of productivity growth at national and firm level. Many of these factors reflect the competitiveness policy inputs and essential conditions set out in the NCC’s competitiveness framework.
Macroeconomic stability and fiscal policy
A stable macroeconomic environment is conducive to investment by firms seeking to introduce new products, to adopt new production methods, or to undertake organisational changes that can lead to higher productivity growth and more efficient use of resources. Regarding fiscal policy, personal and corporate tax policy are particularly important to Ireland as a small open economy. Tax is an important consideration in investment decisions by firms, both in terms of corporate tax and the rate of return firms can expect in Ireland vis-à-vis other environments and the incentives for individuals to work. The structure of tax policy is important in that
the tax burden has an impact on productivity. OECD research5 suggests that the tax burden on individuals,
particularly highly skilled individuals has a much stronger impact on productivity growth than the tax burden on firms. A particularly negative effect is found for tax structures with a heavy weight on distortionary taxes (including direct taxes on income and profits), which affect the choices of households and firms with respect to the level and composition of their (human and physical) capital investment and discourage entrepreneurship.
Institutional effectiveness, competition and regulation
The institutional environment is determined by the legal and administrative framework within which individuals, firms, and governments interact to generate wealth. The quality of institutions, regulation and competition has a strong bearing on the factors which enhance productivity growth. It influences investment decisions and the organisation of production and plays a key role in the ways in which societies distribute the benefits and bear the costs of development strategies and policies. Removing rigidities in product market
regulation can support productivity growth, particularly in heavily regulated sectors.6 Competition and
competitive markets support productivity in three main ways. First, within firms, competition acts as a
4 http://www.oecd.org/global-forum-productivity/
disciplining device in terms of resource allocation, placing pressure on the managers of firms to become more efficient. Secondly, competition ensures that more productive firms increase their market share at the expense of the less productive. These low productivity firms may then exit the market, to be replaced by higher productivity firms. Thirdly, and perhaps most importantly, competition drives firms to innovate, coming up with new products and processes which can lead to step-changes in efficiency.
Investment in physical and knowledge based capital
Investment in physical capital – machinery, equipment and buildings matters. The more capital that firms have at their disposal, generally the better they are able to do their jobs, producing more and better quality output. The availability of competitively priced world-class economic infrastructure (e.g. energy; telecoms; transport – road, public transport, airport, seaports; waste and water) and related services is also critical to support productivity growth. A significant body of research underscores the positive relationship between investment
in high-quality public infrastructure and economy-wide productivity. Research by the IMF7 suggests that a 1
percentage point of GDP increase in investment spending would increase the level of output by about 0.4 percent in the same year and by 1.5 percent after four years. Investment and growth in OECD economies is increasingly driven by knowledge based capital (KBC). Three types of KBC can be distinguished:
1. Computerised information (software and databases);
2. Innovative property (patents, copyrights, designs, trademarks); and
3. Economic competencies (including brand equity, firm-specific human capital, networks joining
people and institutions, and organisational know-how that increase enterprise efficiency).
The development and diffusion of innovative products, services and processes provides the platform for productivity growth and is thus an important driver of competitiveness. While research and development is the main source of new technologies and productivity growth in the long run, the concept of innovation is a broad one encompassing a wide range of activities in addition to R&D, such as organisational changes, training, testing, marketing and design. At firm level, more intensive innovative activity is associated with higher productivity growth. Economy-wide productivity and employment gains are generated when
innovations are diffused and widely adopted; meaning the strengthening of technology diffusion mechanisms represents a key policy challenge. Effective innovation activity facilitates an increase in the productivity and turnover of innovating firms. From a policy making perspective, the key issue is to foster a supportive environment for investment in innovation and technology adoption. As noted by the OECD, synergic investments in R&D, skills, organisational know-how (i.e. managerial quality) and other forms of
knowledge-based capital enable economies to absorb, adapt and reap the full benefits of new technologies8.
Productivity growth also entails sufficient investment in R&D, by both the public and private sector; the presence of high-quality scientific research personnel and institutions; collaboration between universities and industry; and advanced business processes and practices. Analyses of policies which support innovation suggest that when R&D spending or patent applications increase, labour productivity and multi-factor
productivity rise in a statistically significant manner9. In order to create a supportive framework for R&D
activity, an economy needs a well-developed risk capital market, a good system to protect intellectual property rights and adequately resourced efficient education and research support systems. =
Talent and skills
Talent and skills complement physical capital, and are needed to take advantage of investment in new technologies and organisational structures. Increasing educational attainment levels and labour quality is
associated with large increases in productivity10. Evidence suggests that positive labour quality growth
contributes significantly to growth in labour productivity with approximately a third of labour productivity growth attributable to improvements in labour quality. ECB research suggests that the main drivers of improved labour quality are tertiary education and labour market experience. While acknowledging that other (not measured) factors, such as quality of education are likely to also matter, the results suggest that policies designed to promote growth in euro area human capital should be geared towards an increase in educational
attainment and increased on-the-job training both of which matter for productivity growth11. Research12
suggests that an important factor accounting for differences in productivity is variations in management practices. For example, in the Manufacturing sector, managerial quality differs significantly between countries and Ireland scores relatively poorly, particularly when compared to the US, Japan and Germany. Increasing managerial quality in Manufacturing in Ireland to the best practice levels observed in the US could potentially
boost manufacturing productivity by over ten per cent13.
Skills mismatch is associated with lower aggregate labour productivity. The OECD estimates that
approximately 25 per cent of workers report a mismatch between their skills and those required to do their job. A better use of talent could translate in to as much as a 10 per cent higher labour productivity in some
economies14. A greater focus on collaboration between industry and education and training providers is
important for reducing mismatches between demand and supply for skills and improving productivity performance. Higher investment in basic research and policies that promote firm-university collaboration are found to be effective tools that increase the capability of countries to absorb external knowledge and technologies and increase productivity. Results from OECD firm-level micro data suggest that more R&D collaboration between universities and firms reduces the productivity gap between the less productive and
most productive firms (Andrews et al., 2015)15
.
Entrepreneurship, trade and access to finance
In most countries there is a divergent productivity performance at sectoral and national level between the most productive enterprises and the long tail of relatively poorly performing firms with low or no productivity growth. There is evidence that suggests a firm’s rate of growth, job creation, and export activity is related
more directly to the age of the business than to its size16. New firms are therefore especially relevant for
expanding productivity performance. New start-ups, particularly in ICT, are more inclined to engage in more radical innovations which enhance productivity than incumbents who tend to adopt a more incremental approach. A continuous flow of new business start-ups that can survive and thrive in international markets strengthens the productivity base not only through the creation of new businesses, products and services but also by stimulating improved performance in existing businesses. More than half of productivity growth at the industry level has been attributed to new entrants. From a policy perspective therefore, facilitating
entrepreneurship, start-ups and firms of scale must be seen as the dynamo of productivity growth in the long run.
10 OECD, The Future of Productivity, 2015
11 ECB, Growth in Euro area labour quality, Working Paper 575, 2006
12 Bloom, N. et al, Management Practices Across Firms and Countries, National Bureau of Economic Research, 2012 13 Ibid
14 OECD, The Future of Productivity, 2015
An economy’s ability to sustain productivity growth through learning from the global frontier will depend on enhanced global trade and international investment. It has long been recognised that trade can be a spur to productivity growth. Trade allows greater specialisation in activities where a country or a firm has a
comparative advantage. Access to a larger market allows firms to benefit from economies of scale, generating larger volumes of activity without increasing the number of people employed or other inputs in the same proportion. Firms which are more heavily exposed to international competition benefit from a larger market and have a stronger incentive to innovate and find efficiency improvements than businesses which are more sheltered in domestic markets. A recent working paper by IMF staff estimates that a 1 percentage point
decline in input tariffs is estimated to increase total factor productivity by about 2 percent17.
Access to competitively priced sources of finance for investment is also essential to facilitate enterprises establish and expand their operations, invest in productivity enhancing infrastructure and skills and to
ultimately survive and scale. A recent ECB working paper suggests that financial constraints significantly lower productivity growth with the effect particularly pronounced in innovative sectors and for small and micro sized
firms18.
Firm sophistication
Firm sophistication concerns two elements that are intricately linked: the quality of a country’s overall business networks and the quality of individual firms’ operations and strategies. These factors are especially important for countries at an advanced stage of development when, to a large extent, the more basic sources of productivity improvements have been exhausted. The quality of a country’s business networks and supporting industries, as measured by the quantity and quality of local suppliers and the extent of their interaction, is important for a variety of reasons. When companies and suppliers from a particular sector are interconnected in geographically proximate groups, i.e., clusters, efficiency is heightened, greater
opportunities for innovation in processes and products are created, and barriers to entry for new firms are reduced. Individual firms’ advanced operations and strategies (branding, marketing, distribution, advanced production processes, and the production of unique and sophisticated products) spill over into the economy and lead to sophisticated and modern business processes across the country’s business sectors. The speed and pervasiveness of technology diffusion, absorption and use throughout the economy is particularly important for productivity. OECD research suggests that frontier technologies do not immediately diffuse to all firms. Instead, they are first adopted by national frontier firms, and only diffuse to laggards once they are tested by the leaders and adapted to country specific circumstances. As a technologically advanced economy, domestic innovation, as opposed to imitation, increases in importance for Ireland.
17 IMF Working Paper, Reassessing the Productivity Gains from Trade Liberalization, 2016
2 Methodologies, Definitions and Scope
2.1. Methodologies
Measures of productivity are important barometers of the competitiveness of firms, sectors and economies. Productivity is defined as a ratio between the output volume and the volume of inputs. In other words, it measures how efficiently production inputs, such as labour and capital, are being used in an economy to produce a given level of output. Accurately measuring productivity is a complex task. In deriving estimates of productivity at national, sector, industry or firm level, both output and input data need to be assessed. There are a number of ways to quantify and assess productivity performance. In general, productivity may be considered in terms of single and multi-factor productivity measures. Single factor measures are those where output is considered in relation to a single measure of input, such as, labour or capital. Multifactor productivity measures relate output to a number of inputs, for example, capital, labour and intermediate inputs, such as, energy and business services. The variables involved such as output, value-added, hours worked and changes in capital stock are conceptually complicated. In addition, the data sources tend to use a mix of administrative, survey and national accounts data.
While national accounts are the preferred source for productivity measurement, a caveat with the available
figures from an Irish perspective is that they tend to be based on Gross Domestic Product (GDP)19, which can
be particularly problematic for measuring economic activity in highly globalised economies such as Ireland. Revisions to the 2015 National Income and Expenditure accounts in July 2016 led to an upgrade of the 2015 GDP growth to 26.3 per cent and GNP to 18.7 per cent. These revisions, which are in line with ESA2010 and BPM6 methodology, are largely related to relocation of multinational companies to Ireland and the resulting larger net exports contributions.
Various commentators have stated these revised figures are not reflective of actual economic activity taking place in Ireland. Instead, these developments reflect the statistical ‘on-shoring’ of economic activity
associated with an increase in the size of the Irish capital stock arising from corporate restructuring and balance sheet reclassification in the multinational sector, and also growth in aircraft leasing activity. As a result, National Accounts data now include a very significant amount of activity carried out elsewhere, but formally recorded as part of Irish GDP and GNP. Consequently, metrics derived from these measures, such as GDP per hour worked require careful consideration, in particular when undertaking international comparisons. A number of sources of data exist on international productivity developments that cover Ireland, however unlike other jurisdictions (e.g. the UK’s Office of National Statistics), an authoritative set of national statistics at the domestic level is not produced in Ireland. (See Box 2.1). The Conference Board’s Total Economy Database (TED), Organisation for Economic Co-operation and Development (OECD), Eurostat and European Central Bank (ECB) provide estimates of annual data covering Gross Domestic Product (GDP), employment, hours worked, and using these it is possible to estimate productivity performance. However, across all of these datasets issues arise regarding base years, price deflators, currency and exchange rates, constant and current prices and disaggregation of performance by economic activity and hours worked. As outlined in Figure 2.1.1 there are discrepancies between international productivity datasets in terms of measurements, base years and definitions used.
Figure 2.1.1 GDP per hour worked, Ireland 2004-2014
Source OECD, Eurostat, ECB, Conference Board/TED
Figure 2.1.1 shows that while the trends in GDP per hour worked for the total economy are similar, the absolute value can vary significantly depending on the data source used.
Table 2.1.1: GDP per Hour Worked by Source (2013) GDP Per Hour Worked by Source 2013 Value
OECD, Current Prices in USD 64.1
OECD, Current Prices, in euro 52.5
OECD, Constant Prices, in USD 60.1
Eurostat, Constant Prices, in euro 48.8
ECB, Constant Prices, in euro 50.7
Conference Board, 1990 Prices, in USD 31.5
Conference Board, 2014 Prices, in USD 63.3
Source OECD, Eurostat, ECB, Conference Board/TED
Table 2.1.1 illustrates the scale of variation in data and how the absolute value of GDP per Hour Worked for the total economy in one year varies significantly depending on the source used. When the sources of labour productivity are adjusted to a common currency and rebased to a common year there is a considerable degree of consistency as to the overall trend output. The choice of measurement in terms of base year and currency presents issues for Ireland. Previously, the Council assessed Ireland’s labour productivity performance by sector using EU-KLEMS data. The absence of compatible sector level data from the EU KLEMS project means that it is not possible to update the 2012 report using the same methodology and data source. The OECD compiles productivity statistics based on information provided by National Statistical Institutions to monitor and model the economic performance of member countries and has set out a comprehensive theoretical background on how best to define and measure productivity in its Productivity Manual. The OECD’s data is presented annually in its Compendium of Productivity Indicators. As all OECD productivity measures are constructed with a view to maximising international comparability and are based on national accounts data, this report therefore draws extensively on the OECD’s long standing experience in the field.
0 10 20 30 40 50 60 70
2004 2005 2006 2007 2008 2009 2010 2011 2012 2013 2014
G
DP
p
er
hou
r work
ed OECD Dollar Current
OECD Current Euro OECD Dollar Constant Estat Euro Constant ECB Euro Constant
2.2. Definitions
The following section sets out the main definitions used throughout this report drawing on the OECD’s Measuring Productivity Manual.
Output
Output is a key methodological consideration of particular relevance at sectoral and firm level. Productivity analysis distinguishes between productivity measures that consider movements of output in terms of gross output and those which use a gross value-added concept. Measures of output include total economic output, gross domestic product and value added; inputs include labour and capital. Gross Domestic Product (GDP) and Gross Value Added (GVA) are both compiled from National Accounts data based on a common conceptual framework which almost all OECD countries follow in the compilation of their accounts. GVA is the value of output less the value of intermediate consumption (i.e., the difference between the value of goods and services produced and the cost of raw materials and other inputs used in production). It is a measure of the contribution to GDP made by an individual producer, industry or sector. The choice is largely dependent on whether the productivity measure relates only to primary inputs (such as labour and capital) or intermediate inputs (such as materials, energy and business services). In general the OECD concludes that when only primary inputs are involved then GVA should be used as this does not include intermediate consumption.
Labour productivity
Measures of labour productivity show how productively labour is used to generate gross output or value added. Expressed as a ratio, it represents the volume of output produced per unit of labour input. Labour productivity may be calculated in terms of either output per person employed (Gross Domestic Product and Value Added) or output per hour worked. The OECD define hours worked as “Hours actually worked reflect regular hours worked by full-time and part-time workers, paid and unpaid overtime, hours worked in additional jobs, excluding time not worked because of public holidays, annual paid leaves, strikes and labour disputes, bad weather, economic conditions and other reasons”. Labour input is defined as total hours worked by all persons engaged in production i.e. employees plus self-employed, broken down by sector. The OECD consider labour input is most appropriately measured as the total number of hours actually worked, this is, effectively used in production, whether paid or not (System of National Accounts 2008).
Capital productivity
Capital productivity is a measure of how effectively capital is used to generate output or value added. Capital productivity reflects the combined influence of labour, intermediate inputs, technical change, and efficiency change, economies of scale, capacity utilisation and measurement errors. It is defined as the ratio between the volume of output, measured as GDP, and the volume of capital input, defined as the flow of productive services that capital delivers in production, i.e. capital services. Capital services refer to the flow of productive services provided by an asset used in production. Capital services reflect a (physical) quantity, and are considered the appropriate measure of capital input by the OECD.
Multifactor productivity
effects of (imperfect) competition and measurement errors. In simple terms therefore, if labour and capital inputs remain unchanged between two periods, any changes in output reflect changes in MFP.
Sectoral data
Macro level productivity data is supplemented with a range of benchmarks of key sectors broken down by NACE Rev. 2 classification. Data are provided for the total economy and individual sectors.
A –Agriculture, Forestry and Fishing
C – Manufacturing
F – Construction
G– I Wholesale and Retail trade; repair of motor vehicles and motorcycles; H – Transportation and
storage; I – Accommodation and food service activities;
J – Information and communication (ICT);
K – Financial and insurance activities;
M – Professional, scientific and technical activities; N-Administrative and Secretarial support activities
Activities that are generally often provided by non-market producers such as public sector activities are excluded. According to the OECD “this reflects the fact that non-market activities are measured on a sum-of-costs approach in current prices, with an implicit imputation made for labour productivity growth (usually
zero) for volume estimates, together with an assumption of zero net operating surplus”20. The analysis of Irish
productivity trends at sectoral level in this report draws on the OECD and complimentary CSO datasets.
International comparisons
To facilitate international comparisons of labour productivity levels over time, GDP in national currency and at current prices are converted to a common currency by the OECD (US dollars), using constant (2010)
Purchasing Power Parities (PPPs). In productivity analysis there are advantages and disadvantages in using either the current or constant PPP approach. The OECD considers that in comparing differences in
productivity growth across countries, the constant PPP approach is best applied as this method ensures the price structure is constant and changes in output are determined by changes in volume rather than price as prices do not vary over time. It should be noted that in the analysis of sectors set out in Chapter 5 that data on output per hour at sectoral level is only presented for Ireland. This is because the OECD provides international comparisons of indices and growth rates of sectoral productivity but not the levels. This is due to the absence
of reliable industry-level PPPs, which are needed to carry out cross-country comparisons.Subject to data
availability, in this report, Ireland’s national productivity performance from 2004 to 2014 and at the sectoral level is considered, drawing extensively on OECD productivity and national accounts data. Where possible, and subject to data availability, Ireland’s performance is compared with the following:
The Euro area 19 as a key trading partner and representative of Ireland’s economic peer group;
The US, as the source of much inward and outward direct investment, an important trading partner and
traditional global leader in productivity growth;
The UK, as a key trading partner and competitor for foreign direct investment;
Denmark, as a relatively small but globalised small advanced European economy.
A number of sources of data exist on international productivity
developments (OECD, Conference Board, EU KLEMS), however
unlike other jurisdictions (e.g. the UK ONS), an authoritative set
of national statistics at the domestic level is not produced in
Ireland
Box 2. 1: Irish Productivity Data
In depth analysis of Ireland’s performance is severely limited by the absence of comprehensive, sectoral level and firm level data. Evidenced based policy making relies on the availability of data to identify issues, devise
responses and assess progress.
In the Council’s 2015 Competitiveness Challenge, the Council recommended that the potential to develop and publish a comprehensive productivity dataset should be explored by the CSO. Such an exercise should consider measures of labour (both overall and on a per hour worked basis), capital and total factor productivity. Data is required for both productivity levels and growth rates, and data should be disaggregated to the degree possible to identify sectoral trends. Such a dataset should draw on existing CSO data.
3. Labour Productivity Performance 2004-2014
3.1 Overview
This chapter outlines Ireland’s national labour productivity levels and growth rates from 2004 – 2014 with reference to the US, UK, Denmark and Euro area.
In terms of Irish economic growth Figure 3.1.1 shows the economy in the period 2004-2014 can be considered in three distinct phases, a domestically driven surge of growth in the period 2004-2007, a severe decline 2008-2011 and recovery 2012-2014. The effects of the global economic and financial crisis on economic growth were felt in all of the countries below but the effect was particularly pronounced in Ireland where GDP decreased faster and more deeply than the countries considered in this report. In Ireland GDP growth decreased from 5.5 per cent in 2007 t0 -2.1 per cent in 2008 and -5.6 per cent in 2009. Growth returned in 2010 -2012 but was moderate and accelerated in 2013/2014.
The recovery in GDP growth per annum in the years 2013 and 2014 was particularly strong in an international
context. As set out previously by the Council21, over the course of the recession net exports (the value of a
[image:19.595.78.513.427.695.2]country's total exports minus the value of its total imports) were the primary positive driver of Irish growth. Following some volatility in 2012 and 2013, in 2014 the drivers of growth became more balanced with a noticeable increase in the contribution made by investment. In 2014, the Irish economy grew by 5.2 per cent. Economic growth was 2.8 per cent and 2.4 per cent in the UK and US respectively. In contrast growth in Denmark and the Euro area was considerably more subdued at 1.3 per cent and 0.9 per cent respectively.
Figure 3.1.1 GDP annual growth rate Ireland and selected countries, 2004-2014
Source OECD
21 National Competitiveness Council, Ireland’s Competitiveness Scorecard 2015 -7
-6 -5 -4 -3 -2 -1 0 1 2 3 4 5 6 7
2004 2005 2006 2007 2008 2009 2010 2011 2012 2013 2014
G
DP
Annu
al
G
row
th
ra
te
(%
)
3.2 Productivity and the Economic Cycle in Ireland
The factors driving productivity growth over time are difficult to measure and growth can be cyclical and counter cyclical depending on the drivers of economic growth in individual countries. The economic cycle and more generally trends in the composition of value added and employment – can have a significant effect on measured productivity levels. This is particularly relevant for understanding the apparent improvement in
Ireland’s productivity performance. Previous NCC research22 set out how the downturn in the economic cycle
[image:20.595.81.507.310.560.2]has affected Ireland’s productivity trends in a number of guises. From 2007 to 2011 the total hours worked in the Irish economy fell by nearly 17 per cent, while output declined by 9 per cent. If the total hours worked in an economy declines by more than output, the economy realises a productivity gain. At a sectoral level, the fall in employment (and thus hours worked) in the labour intensive and relatively low productivity Construction sector affected the aggregate productivity figures, particularly over the 2008-2010 period when significant hours worked in construction were shed.
Figure 3.2 .1 Growth in GDP, GDP per hour worked and employment, Ireland 2004-2014
Source OECD
Figure 3.2.1 shows that at the tail-end of the Celtic Tiger (2004-2007), strong economic growth (>5%) was driven by increased domestic consumption was accompanied by employment growth (>4%), there was however, limited labour productivity growth. Over the period 2004-2008, GDP per hour worked was less than 2 per cent; well below productivity growth rates at the end of the nineties and start of the decade. Over the course of the recession (2009-2011) as output and employment growth collapsed, labour productivity growth increased at a strong rate. Since the recession (2008-12), productivity growth weakened as employment began to increase. Despite this positive trend in productivity performance, the impact of the composition of employment on productivity growth should be noted. In particular in Ireland’s case, the collapse in the labour
22 NCC, Irelands Productivity Performance 1980-2011, 2012 -8
-6 -4 -2 0 2 4 6 8
2004 2005 2006 2007 2008 2009 2010 2011 2012 2013 2014
Annu
al
p
erc
enta
ge
c
ha
ng
e
intensive Construction sector and Ireland’s growing base of multinationals in high value added sectors (particularly in the Pharma and ICT sectors ) disguises to a degree underperforming sectors and boosts Ireland’s per capita productivity levels .
Figure 3.2.2 shows in an OECD context Ireland had the third highest labour productivity output among EU states in 2014, after Luxembourg, when measuring productivity using GDP per capita. Using the OECD’s measure in USD, constant prices, 2010 PPP, Irelands output per capita was $46,855 in 2014, an increase of 6.5 per cent on 2010 and 21.9 per cent increase compared with 2004. In 2014 Irelands GDP per capita was 92 per cent of the United States level. Over the period 2004-2014, Ireland had the seventh highest increase in output in the OECD, behind Korea, Estonia, Slovakia, Poland, Chile and Hungary. While Irish levels remain above the Euro area, Ireland’s relative performance is less impressive if considered in terms of GNP.
Figure 3.2.2 Output per capita (GDP) USD, constant prices, 2010 PPP, selected countries, 2004, 2010 and 2014
Source OECD
Over the period 2004-2014 growth in output has been subdued in most OECD countries. The global slowdown in productivity has been attributed to a mix of cyclical factors such as low investment in physical capital, (in a context of weak global demand) and structural factors such as inefficient markets, low levels of innovative start-ups and skills mismatch. Productivity in the Euro area is considerably lower than in the United States and Ireland. As Figure 3.2.2 shows, the productivity level in the Euro Area, was just 84 percent of the US level and 77 per cent of the Irish level in 2014. This differential in productivity has remained constant over the past ten years. Within the Euro area, there is large variation in productivity growth rates between economies. This reflects different states of the economic cycle, employment structure, and labour market and the intensity of ICT and capital investment.
The gap between European productivity growth levels and US growth has been attributed to differences in business structures, lower levels of R&D and capital investment, market barriers and regulation, and insufficient use of information and communications technologies. In addition, higher costs (particularly energy), infrastructure pressures, and fewer available sources of finance make the European operating environment for enterprise relatively less productive. The widespread weakness in productivity growth among
0 10000 20000 30000 40000 50000 60000 70000 80000 90000 Lux em bour g No rw ay Sw itz er lan d U ni te d S ta te s Ire land N eth er la nd s A us tr alia Sw ede n A us tr ia G er m any Cana da D enm ar k Ic el and Ire la nd (G N P) Be lg ium U ni te d K ing do m Fi nl and Fr an ce O
ECD EA 1
9 Jap an EU 2 8 K ore a N ew Z ea la nd Ital y Sp ai n Is ra el Cz ec h R ep ub lic Slov en ia Slov ak R ep ub lic Por tug al Es ton ia G re ec e H ung ar y Pola nd La tv ia Ch ile Tur ke y M ex ico US D, c ons ta nt pri ce s, 2 01 0 PP Ps
major European countries points to an inability to translate technology and innovation to productivity growth, weak demand and low investment as well as an increased negative impact of structural rigidities in labour, capital, and product markets. France and Germany have higher productivity levels than the Euro Area average at 97 and 94 percent of the United States, respectively, while economies such as Spain and Italy only reach 77 percent and 76 percent, respectively. UK productivity is significantly below the levels recorded in Ireland and the US, as well as other large economies such as France and Germany.
Figure 3.2.3 GDP per capita, constant prices, 2010 PPP, Ireland and selected countries 2004-2014
Source OECD
In the long-run, productivity is the primary determinant of improvements in national living standards relative to other countries. Growth in GDP per capita is a core indicator of economic performance and commonly used as a broad measure of average living standards or economic well-being despite some recognised
shortcomings.
As shown in Figure 3.2.3, Ireland’s GDP per capita levels have been second only to the US over the period 2004-2014. In the years 2004-2007, GDP per capita grew in all of the countries above. However, Irelands GDP per capita increased at a much more significant level increasing 10.3 per cent to $48,324 compared to rates of 6 per cent in Demark, the UK and Euro area and 5 per cent in the US. Between 2008 and 2009 this increase in Irish GDP per capita was completely eroded as GDP per capita decreased to $43,247 but remained significantly above the Euro area average. On the back of stronger economic and employment growth, Irish incomes per capita began to increase rapidly in 2013/2014. In 2014 GDP per capita (€46,822) was well above the Euro area average (+37%) and the annual percentage growth rate of GDP per capita was well in excess of the US, UK, Denmark and the Euro area average.
3.3 Changes to Ireland’s Long-run Labour Productivity Performance
Having started from a low base, Irish productivity levels exceed those of many of our peers and key
competitors. In historical terms the transformation has been profound. To set the current data in a historical 30000
35000 40000 45000 50000 55000
2004 2005 2006 2007 2008 2009 2010 2011 2012 2013 2014
G
DP
p
er
Ca
pi
ta
US
Dol
la
r C
ons
ta
nt
PP
P
20
10
context, in 1970, GDP per hour worked in Ireland was $12.81 compared to $24.30 in Denmark, $19.37 in the UK and $31.06 in the US. In the eighties, and early nineties, productivity in Ireland was significantly below levels in the UK, the Euro area, Denmark and the USA. The gap began to narrow in the mid-nineties and early
[image:23.595.82.514.211.478.2]noughties as Ireland has strong export led economic growth. As set out in Figure 3.3.1 the differential began to narrow further during the period 2004-2014 with a particularly strong surge occurring over the course of the recession.
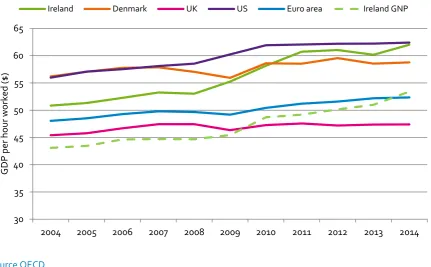
Figure 3.3.1 GDP per hour worked, USD, constant prices, 2010 PPPs, Ireland and selected countries 2004-2014
Source OECD
Source OECD
By 2014, Ireland’s per hour productivity levels were above the figures for the Euro area average, the UK and Denmark. In addition, the productivity gap between Ireland and the US narrowed substantially, particularly in the period 2008-2011. As measured by GDP per hour worked, productivity in Ireland has converged to the EU and US averages. Ireland went from being approximately 9 percent below the US in 2004 to the same level by 2014.
A concern with these figures is that they are based on GDP, which may include some pricing activities by multinational corporations. Using GNP figures, which measures income to Irish citizens rather than output, brings Ireland’s productivity performance more into line with other countries. In short, despite the impact of the recession, Ireland has continued to perform relatively strongly in terms of productivity growth. Ireland went from approximately two-thirds of the output per hour of the rest of the EU and the US during the 1980s to almost the same level by 2014. As Figure 3.3.1 outlines, GNP per hour productivity figures indicate that although recent growth rates have been impressive in absolute terms, Ireland’s productivity in terms of GNP per hour worked while above the UK and Euro area remains well below that of Denmark and the US.
30 35 40 45 50 55 60 65
2004 2005 2006 2007 2008 2009 2010 2011 2012 2013 2014
G
DP
p
er
hou
r work
ed
($
)
3.4 Labour Productivity Growth
Figure 3.4.1 Annual growth in GDP per hour worked, constant prices
Source OECD
Figure 3.4.1 shows the annual figures for labour productivity growth in output per hour worked – the key determinant of rising living standards in Ireland and selected economies over the period 2004-2014. As the chart shows, annual growth in productivity is volatile reflecting the various stages of the business cycle. However, the overall trend in Ireland as highlighted by the linear trend has seen productivity growth average around 2 per cent per annum over the last decade.
In Ireland, growth slowed from above 4 per cent between 1995 and 2003 to less than 1.6 per cent per annum in 2004 and 2005. It dipped to -0.4 per cent in 2008 before recovering strongly in the period 2009-2012. Labour productivity growth has slowed considerably in the last decade in Denmark, the UK, US and Euro area. The slowdown was in evidence pre crisis and the decline in productivity growth was particularly pronounced in Denmark and the UK. Ireland’s labour productivity growth rates remain relatively strong in an international context.
Some of Ireland’s gains, however, have arisen as a result of the impact of the recession on the labour market. Over the period 2008- 2012 the economy was contracting and national income and employment declining, as construction investment and domestic demand fell from the unsustainably high levels of previous years. The intensity of the economic downturn was exacerbated by unprecedented national and international economic difficulties, particularly in the banking and financial sectors. The structure of employment changed
significantly and quickly as a result of the recession. CSO QNHS data shows that over the period Q2 2008-Q2 2011, total employment decreased by 13.4 per cent, from 2,146,400 to 1,857,600. In this period over a quarter of a million jobs were lost, with over half of the jobs lost were in construction. At a sector level, the largest declines in employment occurred in labour intensive sectors Construction 57%) agriculture 27%), industry (-18%), Professional Services (-13%), Wholesale and Retail (-13%) and accommodation and food (-11%).
-3 -2 -1 0 1 2 3 4 5 6
2004 2005 2006 2007 2008 2009 2010 2011 2012 2013 2014
Annu
al
p
erc
enta
ge
c
ha
ng
e
Table 3.4.1 Annual growth rate in GDP per hour worked, constant prices, selected countries 2004-2014
2004 2005 2006 2007 2008 2009 2010 2011 2012 2013 2014 Median
Denmark 3.3 1.5 1.3 0.2 -1.5 -1.9 4.8 -0.1 1.7 -1.7 0.4 0.4
Ireland 1.6 0.9 1.8 1.9 -0.4 4.2 5.3 4.4 0.5 -1.4 3.1 1.8
UK 2.3 0.8 2.0 1.6 0.0 -2.3 2.0 0.6 -0.8 0.4 0.2 0.6
US 2.6 2.0 0.8 1.0 0.8 2.9 2.8 0.2 0.2 0.0 0.3 0.8
Euro area 1.1 1.0 1.6 1.0 -0.3 -1.0 2.5 1.5 0.8 1.2 0.3 1.0
Source OECD
Table 3.4.1 shows the trend in annual per hour labour productivity growth over the period 2004-2014. In 2004, Ireland’s growth rate was above the euro area average but below the rates observed in the UK, US and
Denmark. Ireland’s growth rate increased at a particularly high rate in the period 2009-2011. In 2014, at 3.1 per cent, Ireland recorded the highest growth rate in the OECD and the rate was considerably above the rate observed in Demark, the UK and US.
Figure 3.4.2 GDP per hour worked, total economy, percentage change at annual rate selected periods
Source OECD
Figure 3.4.2 shows that the average annual rate of growth23 productivity growth in the US, UK, Denmark and
Euro area counties has been below 2 per cent both in the run up to and particularly during and after the economic and financial crisis in 2008. Irish productivity grew at 2.3 per cent growth over the period 2009-2014. Ireland recorded a slight decline of 0.1 per cent on 2001-2007. Productivity growth increased in the Euro area from 1 per cent to 1.2 per cent. However, productivity growth declined in Denmark, the US and the UK. The decline in productivity was particularly pronounced in the UK (a decline from 2 per cent in the period 2001-2007 to 0.5 per cent in 2009-2014) and in the US where growth declined from 2 per cent to 0.75 per cent over the same period. Productivity growth has been subdued in most OECD countries over the decade
23 The average annual growth rate (AAGR) is the arithmetic mean of a series of growth rates. 0
0.5 1 1.5 2 2.5 3
Ireland Euro area Denmark United States United Kingdom
Pe
rc
enta
ge
c
ha
ng
e
at
annu
al
ra
te
4. Trends in Employment and Hours Worked 2004-2014
4.1 Overview
[image:26.595.79.508.257.521.2]Understanding the drivers of productivity growth at the total economy level requires an understanding of the contribution that each sector makes in terms of employment and hours worked. Following a most dramatic transition from boom to bust, one cannot consider Irish productivity trends without reference to the changing composition of employment in the midst of the unprecedented national and international economic crisis. Looking at international comparisons of the composition of employment at sectoral level a number of features of Ireland’s labour market over the period 2004-2014 are evident.
Figure 4.1.1 Percentage share of total employment by sector, Ireland and selected countries 2004 and 201424
Source OECD
Figure 4.1.1 shows that the share of total Irish employment in agriculture while declining remains high relative to the Euro area average. The proportion employed (10.9%) in construction in 2004 was significantly above Denmark, the UK and the Euro area in 2004 but at 7 per cent is now similar to international averages. High value added sectors such as financial services, real estate and ICT account for relatively small proportions of total numbers employed.
ICT as a share of total employment has increased in Ireland and elsewhere but accounts for less than 5 per cent of total employment. The share of employment accounted for by Professional Services in Ireland has
increased over the decade and at 10.3 per cent in 2014 is similar to Denmark but lower than the UK (16%) and Euro area (13%). The share of total employment in the services sectors (Retail, food, transport and storage) is highest in Ireland (28.4%). The growth in share of Irish public services employment is notable accounting for 25 per cent of total employment in 2014 compared with 20.8 per cent in 2004 and is now higher than the euro
24 Data not available for the US 0%
10% 20% 30% 40% 50% 60% 70% 80% 90% 100%
Ire
la
nd
2
00
4
Ire
la
nd
2
01
4
D
en
m
ar
k
20
04
D
en
m
ar
k
20
14
UK
20
04
UK
20
14
Eu
ro
are
a
20
04
Eu
ro
are
a
20
14
Other Service Activities Public Administration Professional and Scientific, Administrative and Support Real Estate
Financial and Insurance ICT
Wholesale, Retail, Transport, Accomodation and Food Construction
are average but below Denmark and the UK. As is the case across the OECD the composition of employment in Ireland over the period 2004-2014 is notable for the increasing share of total employment accounted for by the services sector and the declining numbers employed in industry.
[image:27.595.84.513.252.499.2]Across the OECD, shifting patterns of comparative advantage and the process of structural and technological change mean that employment in the traditionally high productivity Manufacturing sector has been declining with employment growth increasingly concentrated in the services s