Companies at present compete in terms of their sup-ply chains (SC), not merely through their production processes. A supply chain is defined as the sequence of activities involved in the life cycle of a product, from the moment it is designed and conceived until its distribution and consumption (Blanchard 2010). These activities include the raw materials procure-ment, production processes in the company, and the product storage, distribution, and commercializa-tion to final costumers. Similarly, several actors are involved in these activities.
The participation of these actors in the SC and their interaction are worth being studied due to their impact on the company’s performance. Therefore, the supply chain management (SCM) has aroused as a source of the competitive advantage and means to improve the performance of companies. However, even though it is recognized that these actors do play a key role in the SC, the literature has not yet man-aged to completely specified how and why they affect the performance of companies (Zhao et al. 2015).
Since the SCs represent a competitive advantage, their efficiency must be maximized and a great amount of research has focused on the identification of the critical success factors, and (Soin 2004) identified fourteen, using the factor analyses, including work-force, flexibility, agility, communication, regional infrastructure, and government participation. These success factors are viewed as independent variables, and must always be considered to improve the ef-ficiency or the SC performance, which is in turn considered as the dependent variable.
With the identification of these success factors, the companies usually wonder about a key strategy to improve the performance of their SCs. Nevertheless, no consensus has yet been achieved on the matter and some researchers have advised organizations to redesign the role and processes in the SC as well as to reduce the cycle time, to synchronize logistics processes with the consumer demand, to coordinate and simplify logistics decisions, to be transparent with the SC information, and to define the goals and
The impact of human resources on the agility,
flexibility and performance of wine supply chains
Jorge L. GARCIA-ALCARAZ
1*, Aide A. MALDONADO-MACIAS
1,
Juan L. HERNANDEZ-ARELLANO
1, Julio BLANCO-FERNANDEZ
2,
Emilio JIMENEZ-MACIAS
2, Juan C. SAENZ-DIEZ MURO
21Department of Industrial Engineering and Manufacturing, Autonomous University of Ciudad
Juarez, Ciudad Juarez, Chihuahua, México
2Department of Electrical Engineering, University of La Rioja, Logroño, La Rioja, Spain
*Corresponding author: [email protected]
Garcia-Alcaraz J.L., Maldonado-Macias A.A., Hernandez-Arellano J.L., Blanco-FernandezJ., Jimenez-Macias E., Saenz-Diez Muro J.C. (2017): The impact of human resources on the agility, flexibility and performance of wine supply chains. Agric. Econ. – Czech, 63: 175–184.
Abstract: Th e research propose s a structural equation model (SEM) that integrates four latent variables: human resources skills, fl exibility, agility, and the economic supply chain (SC) performance for wineries that together include fi fteen ob-served variables. Th e data was obtained from 64 surveys applied to managers in the wineries in La Rioja, Spain. Direct, the indirect and total eff ects are analysed to prove six hypotheses that relate the aforementioned latent variables. Th e results indicate that the skills of human resources are a source of fl exibility and agility in the supply chain for wineries in La Rioja and thus a direct and indirect source of economic performance.
indicators of the SC performance in conjunction with other members (Li et al. 2010).
To reduce the SC cycle time, for instance, it is said that companies must count with employees highly trained in different skills. Moreover, these organiza-tions must rely on the effective communication with all SC members and seek an appropriate regional infra-structure with proper routes, airports, rail networks, and communication services, so they can ensure the fast movement of their materials and finished prod-ucts. All these conditions would guarantee a greater agility and faster deliveries to customers and would thus bring greater economic benefits to the companies. Wine has its own SC and this is the most important industry in La Rioja, Spain, it is the object of study due to a number of activities that make it unique due to the special conditions required for the transport and storage.
Statistics of La Rioja wine
As a major and important agricultural product of La Rioja, wine is managed through the Regulatory Board (RB) of Denominación de Origen Rioja, a governmen-tal institution that in addition to certifying the wine, it also generates and diffuses statistics concerning the product. For instance, according to the RB, the productive vineyard surface of La Rioja in 2012 was 61 840 ha, which represented 253.44 millions of litres of wine produced. Moreover, the board also stated that in 2013, a total of 195.48 million of litres of Rioja wine were sold, 138.68 million of which were destined to the domestic consumption and 56.800 million were exported to the United Kingdom, Germany, the United States, Switzerland and Sweden.
Wine for domestic consumption in La Rioja is mainly distributed for two sectors by the food sector, repre-senting 49.5% of the sales for the national consump-tion. Similarly, it is worth mentioning that in 2014, La Rioja relied on 233 winemakers, 28 cooperatives, and 132 wine harvesters. Th is demonstrates the importance of wine industry for the autonomous region of La Rioja.
THEORY, HYPOTHESES AND MODEL PROPOSSED
Human resources in SC
Human resources are key indicators of the success of companies. For instance, the parameters and metrics
in the production system highly depend on them, and they constitute a universal value in enterprises and must be adequately managed. Human factors are also considered a critical aspect for a successful SC since all managers, supervisors, and operators of production lines are involved (Lengnick-Hall et al. 2013).
Numerous works have studied the impact of human factors in production systems, although they have usually and were mainly focused on manufacturing industries. However, wine has its own SC and it also needs to be studied. A recent research addressing this critical human resource element in SC of the authors (Alfalla-Luque et al. 2015) introduced a list of 28 factors that affected the integration of a SC and defined that the most significant among these were the managerial commitment and human resources. However, an effective communication in the organi-zational structure is also an important element, but it can only be achieved by human resources.
The authors also pointed out human resources as a crucial factor for the successful performance of the SC, since they are responsible for every strategy im-plemented in it (Lengnick-Hall et al. 2013). Therefore, to some extent, the success or failure of SCs could be ascribable to them and their commitment impacts in more areas that just the SCs. Another important aspect to consider about human resources is the qualifications of employees, because education, skills, and abilities to hold a certain position add flexibility to the supply chain and prevent delays in the delivery of finished products, since highly educated and trained staffs is able to make efficient and fast decisions.
Understanding the complete role of human factors within a SC may be challenging, since every employer may manage different activities and makes a wide range of different decisions, all having certain effect on the SCs.
SC agility
Since several companies must achieve a greater agil-ity throughout their supply chains, two of the main concerns are how to measure it and which elements can increase it. In the case of the wine industry, agil-ity is important since agricultural products require a special care when being stored and a fast transport to ensure their quality. Such activities are also the results of the skills of human resources. As for the existing indicators to measure agility, Lin et al. (2006) have based on the fuzzy logic modelling.
As far as the wine supply chain is concerned, it is important to identify the speed at which companies are able to adapt to the changes in demand from the customers, the ability to customize the requested product, the production cycle time, and the capacity to offer fast deliveries to the customers, since, as any agricultural product, wine is delicate. Therefore, the wineries that manage to succeed in these activities would surely benefit from a competitive advantage and increased performance, which would bring them greater economic benefits.
As a contribution to the following discussion, the following hypothesis is proposed.
H1: Human Resources Skills in wineries have a direct and positive impact on the SC Agility.
SC flexibility
Flexibility is perhaps the most important measure of the SC performance. It is known as the speed at which a supply chain adapts to and executes new strategies and production programs in order to support the market changes or the modifications in products and diverse factors can help achieving the SC flexibility. The most important of them is human resources and for instance, (Blome et al. 2014a) studied the impact of the knowledge of operators and supervisors on the SC flexibility, and (Lengnick-Hall et al. 2013) emphasized on human resources as a source of the competitive advantage for the company manage-ment. The authors also concluded that the companies had to learn to employ their human resources skills correctly to gain flexibility. Similarly, other authors have reported the importance of human factors in the SC Flexibility and the need of specific metrics to monitor it (Das 2011).
Another source of the SC flexibility is associated with information technologies implemented along the production process (Jin et al. 2014), because they can inform of the ongoing material flow and work in process. Moreover, they promote a fast
commu-nication with suppliers outside the company. Still, these technologies also require specialized human resources skills. For this reason, the following hy-pothesis is proposed.
H2: Human Resources Skills in wineries have a direct and positive impact on the SC Flexibility. It is also stated that the SC flexibility for making modifications in the design of products and production processes is reflected on the amount of agility from the companies to offer on time deliveries (Das 2011). Hence, a third hypothesis can also be formulated. H3: SC Flexibility to make changes in production
processes has a direct and positive impact on the SC Agility in wine companies.
SC performance and its metrics
A performance attribute is a group of metrics used to express a competitive strategy. It is also the ability of the SCs to deliver on time and quality the products and services in the precise amount, thus minimizing costs (Böhm et al. 2007). Several types of metrics are considered for the SC depending on the area that needs to be measured. In their work Hassini et al. (2012) mentioned the use of metrics for the marketing performance, politics and regulations, movement of materials, product development, production process capacity, procurement and operations, transport and logistics, as well as the environmental and social metrics.
A more simplified classification, however, can be the one that separates the economic metrics, envi-ronmental metrics and social metrics described by Searcy et al. (2007). However, the financial perfor-mance in the SC is the ultimate goal of companies and thus stands out as the most significant metric. Such financial performance concerns the economic output of companies, usually included in business models, and it indicates the accomplishment of economic goals for organizations such as the sales growth, profitability, and inventory turnover. Cash flow is the traditional economic measure of the financial performance.
the elements of financial performance (Gunasekaran et al. 2004).
Every company must measure the economic ef-fectiveness of its SC to be aware of the economic situation and to be able to implement plans of its continuous improvement. Such measurements may depend on several aspects, such as the skills of hu-man resources. This allows for the proposal of the following working hypothesis:
H4: Human Resources Skills have a direct and posi-tive impact on the SC Economic Performance of wineries.
Another source of a successful SC economic per-formance is the agility or the speed at which the organizations adjust to the uncertainty of demand. Any company capable of quickly adapting to changes is likely to benefit from a larger group of costumers and this must be a major characteristic of wineries at present. Hence, in order to contribute to this discus-sion, the following hypothesis is proposed
H5: SC Agility of wineries has a direct and positive impact on the SC Economic Performance. Even though the SC agility is essential, businesses also need to analyse their SC flexibility. It has been stated that such flexibility must be monitored from the phase of the SC design and several models based on different approaches have been proposed to evalu-ate flexibility in SC. Still, the most convenient way to measure it is perhaps through an economic approach (Seebacher and Winkler 2015). Flexibility in the SC can be the result of several elements, such as the information technologies, raw material suppliers, the relationship that the companies maintain with these suppliers and human resources (Blome et al. 2014b). For this reason it is possible to consider the following hypothesis:
H6: SC Flexibility has a direct and positive impact on the SC Economic Performance in wine companies.
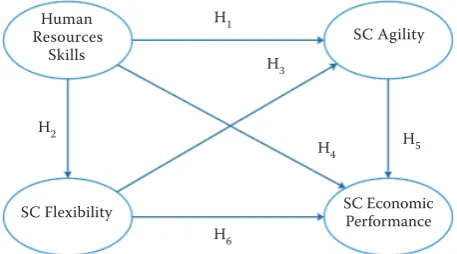
Figure 1 depicts the relationships previously pro-posed. The methodology used to evaluate and tests such relationships is described in the following section.
METHODOLOGY
The methodology employed for this research to evaluate the relations of the hypotheses previously proposed involves the design of a data collection instrument – a questionnaire – to identify the vari-ables concerning the skills of human resources, agility, flexibility and economic benefits obtained in a SC. The questionnaire is administered to active managers in wineries. A statistical analysis is then carried out, and conclusions are drawn based on the findings. Such methodological procedure consisted of several stages described below.
Survey development
The questionnaire is designed based on the litera-ture reviewed to find the main observable variables of each of the four latent variables of this research, which are depicted in Figure 1. It is found that the latent variables Human Resources Skills contained three items, while the SC Agility included four items. Also, the latent variable SC Flexibility is composed of six items, and the latent variable SC Economic Performance included two items. Such organization is described as follows:
Human Resources Skills: Education and skills of human resources, Availability of human resources in the region, Level of experience and competence of human resources (Lengnick-Hall et al. 2013).
SC Flexibility: Set-up times of machinery and equip-ment, Employment contracts, Multifunctional work-ers, Quick adaptability to demand, Quick adjustment of inventories, Quick changes in the product design (Seebacher and Winkler 2015).
SC Agility: Low cycle time, Low Lead time, Fast response to customers, High level of product cus-tomization (Mourtzis and Doukas 2014).
SC Economic Performance: Increase in sales, More cash flow sales (Zhao et al. 2015).
[image:4.595.63.292.608.735.2]The questionnaire is composed of two sections. The former focused on the demographic information and the latter evaluated the information about the four latent variables and their items depicted in Table 1. Moreover, a response and judges’ validation are first carried out to ensure a proper understanding of the
Figure 1. Proposed model Human
Resources Skills
SC Agility
SC Flexibility SC Economic
Performance H1
H3
H4 H5
items. A preliminary questionnaire is administered to managers and academics working in wine industries of La Rioja, Spain.
The questionnaire had to be answered on a Likert-based scale focused on subjective assessments. The lower value (1) indicated that the item or activity is never executed or the benefit is never obtained. On the other hand, the highest value (5) implied that the item or activity is always executed or the benefit is always obtained in that winery. In the validation process, blank spaces are included for the evaluators to mention other specific items for the latent vari-ables or benefits gained that are not included in the questionnaire.
Data collection
The sample is stratified and focused on winer-ies located in La Rioja, Spain. The questionnaire is administered in the form of face-to-face interviews with the winery managers after a scheduled appoint-ment. When a first meeting is not possible, a second is proposed fifteen days later. After three impossible meetings, the interview is discarded.
Data capture and questionnaire validation
Data screening is also performed to detect the miss-ing values in items, which are then replaced by the median values, since the data is obtained through an ordinal scale. However, a maximum of 10% of missing values is allowed for every item. Furthermore, the values in the database are also analysed to detect the outliers or extreme values. A standardization process is executed for every item, considering a standard-ized value as an outlier if its absolute value is higher than 4 (Kaiser 2010).
Additionally, the discriminant validity is measured by the average variance extracted index (AVE) and the minimum acceptable cut-off value is 0.5. As for the convergent validity, the AVE and correlations among the latent variables are used. Finally, it is important to measure collinearity among the latent variables, since a high collinearity could make the inverse ma-trix estimation very difficult. The full collinearity VIF (variance inflation factor) value is used and the maximum cut-off value is set to 3.3 (Petter et al. 2007). Finally, the predictive validity is measured with two indexes. The Q-squared coefficient is used as a non-parametric measure, while the R-squared coefficient is employed as a parametric measure. It is suggested
that the Q-squared coefficient must be higher than zero and, preferably, similar to the R-Squared values.
Descriptive analysis
After the validation process is performed for every dimension, a univariate analysis is carried out to identify the measures of the central tendency and deviation in items. On the one hand, the median or 50th percentile is obtained as a measure of central
tendency. High values of the median indicated that the item is always present or the benefit is always obtained, while lower values indicated that the item is not present or the benefit is not obtained. On the other hand, the interquartile range or IR (differ-ence between 75th percentile and 25th percentile)
is obtained as a deviation measure. High values in the IR of an item indicated a little consensus among the respondents concerning the importance of such item, while low values indicated a little dispersion of data and therefore a greater consensus among the respondents.
Structural equation model
In order to prove the hypotheses stated in Figure 1, the model is evaluated using the Structural Equation Modelling (SEM) technique. The SEM model is ex-ecuted on the WarpPLS 5.0® software since its main algorithms are based on the Partial Least Squared (PLS) and four model fit indices are analysed: the average path coefficient (APC), the average R-squared (ARS), the average variance inflation factor (AVIF), and the Tenenhaus goodness of fit index, recommended by (Ketkar and Vaidya 2012) in the supply chain research. The P-values of APC and ARS are analysed to de-termine the efficiency of the model. The maximum cut-off P-value established is 0.05, which means that the statistical inferences are made with 95% of the confidence level, testing the null hypotheses that the APC and ARS equalled 0, versus the alternative hypotheses that the APC and ARS are different from 0. As for the AVIF index, values lower than 5 are desirable, while the Tenenhaus index values should be higher than 0.36 (Kock 2013).
are analysed to determine the significance of every effect, considering the null hypothesis stating that the effect value equalled 0, versus the alternative hypoth-esis stating that the effect value is different from 0.
RESULTS
Sixty-four valid questionnaires were obtained af-ter the survey administration from June to October 2014 in the wineries of La Rioja, Spain. The results obtained are described below.
Questionnaire validation
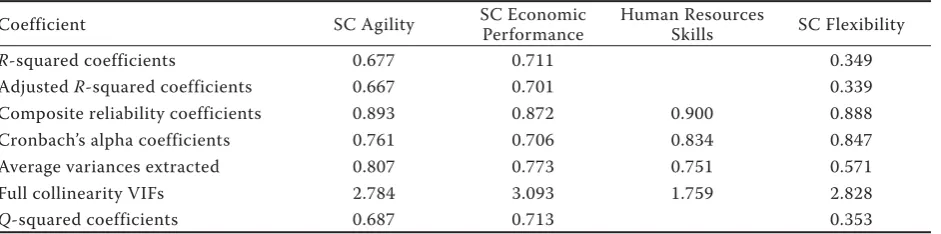
Table 1 illustrates the indices obtained after the validation of every latent variable analysed in the model. It can be observed that the R-squared and Adjusted R-squared values are all higher than 0.02, which indicates that the latent variables have predic-tive validity from a parametric perspecpredic-tive. Similarly, the Q-squared values demonstrate predictive valid-ity from a non-parametric perspective. Besides, the values of these three indices are similar.
Also, the values of the Cronbach’s alpha and the composite reliability indexes for every latent variable were higher than 0.7, which proves internal valid-ity. As for the convergent validity, all indexes in the latent variables analysed showed values higher than 0.5. Finally, all indexes of variance inflation show values lower than 3.3 in all latent variables analysed. Therefore, there are no collinearity problems.
Based on all values obtained, the descriptive analysis of the items of latent variables can be performed and the structural equation model can be interpreted.
Descriptive analysis
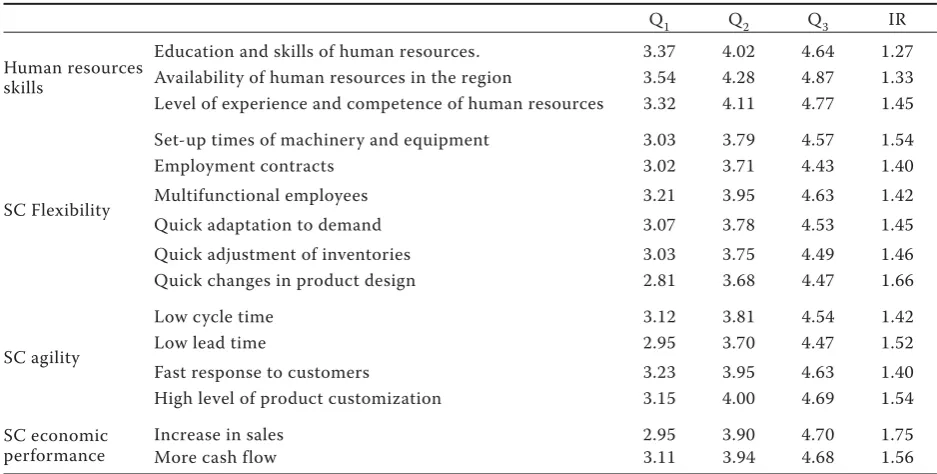
Table 2 shows the descriptive analysis of items included in every latent variable. First (Q1), second
(Q2), and third (Q3) quartile values are indicated as well as the interquartile range (IR) values.
According to Table 2, the item with the highest median or the second quartile (Q2) value for the latent variable Human Resources concerns their availability within the region. In fact, higher edu-cation institutions in La Rioja offer specialization courses or programs related to enology. It must also be observed that within this same category or latent variable, all items show median values higher than 4, which indicates that the skills of human resources are always present.
As for the latent variable SC Flexibility, Multi-functional Employees is the item with the highest median value. Being multifunctional allows workers to hold several positions in the SC and ensures its flow. None of the items of this category or no latent variable show values equal to or higher than 4.
As for the elements of the latent variable SC Agility, high levels of the product customization show the highest median value, which is also higher than 4. This indicates that, according to the respondents, being able to offer customized products and quickly respond to the needs of the customers is essential. Finally, as far as the latent variable SC Economic Performance is concerned, although increasing sales are important, the major goal is to increase the cash flow, since it represents financial benefits and eco-nomic utility for companies.
Structural equation model
[image:6.595.65.536.640.757.2]Figure 2 introduces the structural equation model evaluated in this research with the methodology previously described. Every relationship between variables shows a beta (b)– and a P-value for the statistical significance test. Moreover, every de-pendent latent variable possesses an R-squared value indicating the amount of variance explained by independent latent variables. The parameters
Table 1. Validation indexes of the questionnaire
Coefficient SC Agility SC Economic Performance Human Resources Skills SC Flexibility
R-squared coefficients 0.677 0.711 0.349
Adjusted R-squared coefficients 0.667 0.701 0.339
Composite reliability coefficients 0.893 0.872 0.900 0.888
Cronbach’s alpha coefficients 0.761 0.706 0.834 0.847
Average variances extracted 0.807 0.773 0.751 0.571
Full collinearity VIFs 2.784 3.093 1.759 2.828
obtained and the efficiency indexes employed for the model are described below.
Efficiency indexes of the model
Indexes must first be evaluated to determine the efficiency of the model. Afterwards, the results from the analysis can be interpreted. Efficiency indexes for this model are the following:
– Average path coefficient (APC) = 0.479, P < 0.001 – Average R-squared (ARS) = 0.579, P < 0.001 – Average adjusted R-squared (AARS) = 0.569,
P < 0.001
– Average block VIF (AVIF) = 1.886, acceptable if ≤ 5, ideally ≤ 3.3
– Tenenhaus GoF (GoF) = 0.648, small ≥ 0.1, medium ≥ 0.25, large ≥ 0.36
The APC, ARS, and AARS indexes show P-values lower than 0.001. Hence, in the general terms, the model has predictive validity. Such inference can be made with 99% confidence level. Similarly, the AVIF value is lower than 3.3, the maximum cut-off value, which indicates that the model does not have collinearity problems. Finally, the Tenenhaus index of goodness of fit shows a value higher than 0.36. The model therefore is statistically suitable and the effects between variables can be analysed.
Sum of direct effects
Direct effects allow for the validation of hypotheses initially proposed. Based on the results obtained, is it possible to state the following conclusions:
H1: There is enough statistical evidence to point out that Human Resources Skills in wine companies have a direct and positive impact on the SC Agility. When the first latent variable increases its standard deviation by one unit, the standard deviation of the second latent variable rises by 0.284 units.
H2: There is enough statistical evidence to declare that Human Resources Skills in wineries have a di-rect and positive impact on the SC Flexibility, since when the former increases its standard deviation by one unit, the standard deviation of the latter also increases by 0.291 units.
[image:7.595.62.531.112.349.2]H3: There is a sufficient statistical evidence to state that SC Flexibility to make changes in production processes has a direct and positive impact on the
Table 2. Descriptive analysis of items included in the latent variables analysed
Q1 Q2 Q3 IR
Human resources skills
Education and skills of human resources. 3.37 4.02 4.64 1.27
Availability of human resources in the region 3.54 4.28 4.87 1.33 Level of experience and competence of human resources 3.32 4.11 4.77 1.45
SC Flexibility
Set-up times of machinery and equipment 3.03 3.79 4.57 1.54
Employment contracts 3.02 3.71 4.43 1.40
Multifunctional employees 3.21 3.95 4.63 1.42
Quick adaptation to demand 3.07 3.78 4.53 1.45
Quick adjustment of inventories 3.03 3.75 4.49 1.46
Quick changes in product design 2.81 3.68 4.47 1.66
SC agility
Low cycle time 3.12 3.81 4.54 1.42
Low lead time 2.95 3.70 4.47 1.52
Fast response to customers 3.23 3.95 4.63 1.40
High level of product customization 3.15 4.00 4.69 1.54
SC economic performance
Increase in sales 2.95 3.90 4.70 1.75
More cash flow 3.11 3.94 4.68 1.56
Figure 2. Evaluated model Human
Resources Skills
SC Agility
SC Flexibility SC Economic
Performance
β = 0.617 (P < 0.01) β = 0.284
(P < 0.01)
β = 0.323 (P < 0.01)
β = 0.577 (P < 0.01) β = 0.591
(P < 0.01)
R2= 0.68
R2= 0.71
[image:7.595.62.291.589.737.2]SC Agility of wineries, since when the first latent variable increases its standard deviation by one unit, the standard deviation of the second latent variable rises by 0.617 units.
H4: There is not enough statistical evidence to state that Human Resources Skills have a direct and positive impact on the SC Economic Performance of wine companies, since the P-value is higher than 0.05. H5: There is enough statistical evidence to affirm that the SC Agility has a direct and positive impact on the SC Economic Performance of wineries, since when the former increases its standard deviation by one unit, the standard deviation of the latter latent variable increases 0.577 units.
H6: There is a sufficient statistical evidence to de-clare that the SC Flexibility has a direct and positive impact on the SC Economic Performance. When the first latent variable increases its standard deviation by one unit, the standard deviation of the second latent variable also increases by 0.323 units.
In the analysis of direct effects, it was also found that certain latent variables were affected by others. Thus, it is convenient to decompose the R-squared values of such affected latent variables. Therefore, the SC Agility has an R-squared value R2 = 0.68, which is
explained in 0.188 units by Human Resources Skills and 0.492 units by the SC Flexibility.
Similarly, the latent variable SC Economic Perfor-mance shows an R-squared value R2 = 0.71; 0.469
originates from SC Agility, while 0.241 comes from SC Flexibility. This demonstrates that the SC Agility is highly significant for the SC Economic Performance, since it shows the highest value.
Sum of indirect effects
Figure 2 shows that certain independent latent variables have an effect on other ones through a third latent variable, also called the mediator variable. These kinds of effects are known as indirect effects and are depicted in Table 3. It can be observed that
all indirect effects between the latent variables are statistically significant, since all P-values are lower than 0.05.
Hypothesis 4 (H4) was rejected when analysing the direct effect between Human Resources Skills and the SC Economic Performance. However, in such relation the former latent variable does have significant indi-rect effects on the latter through the mediator latent variables SC Agility and SC Flexibility. The sum of such indirect effects is 0.565 units.
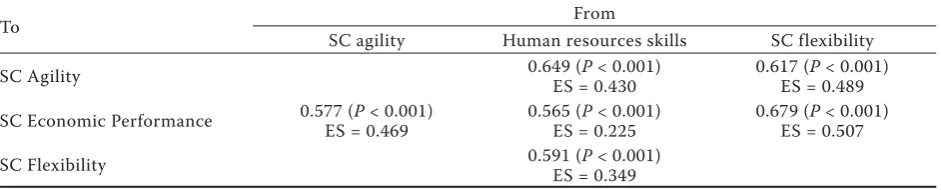
Total effects
The total effects are the sum of direct and indirect effects. For the model evaluated in this research, such effects are illustrated in Table 4, where it can be observed that they are all statistically significant, since the P-value is lower than 0.05 in all cases.
Similarly, for every dependent latent variable, the table shows the effect size (ES) or fraction of their variance explained by independent latent variables. All beta values or effects are higher than 0.5 and can be considered high. Therefore, there are high effect sizes. The SC Flexibility causes the highest effect size over the SC Economic Performance. It has a value of 0.507, which indicates that the first latent variable can explain up to 50.7% of the variability of the second latent variable.
[image:8.595.306.531.113.196.2]Moreover, the latent variable Human Resources Skills causes effects on all other latent variables since it was considered as the one upon which all the remaining
Table 4. Sum of total effects
To From
SC agility Human resources skills SC flexibility
SC Agility 0.649 (ES = 0.430P < 0.001) 0.617 (ES = 0.489P < 0.001)
SC Economic Performance 0.577 (P < 0.001) ES = 0.469
0.565 (P < 0.001) ES = 0.225
0.679 (P < 0.001) ES = 0.507
SC Flexibility 0.591 (P < 0.001)
ES = 0.349
ES = Effect Size
Table 3. Sum of indirect effects
To
From Human resources
skills SC flexibility
SC Agility 0.365 (P < 0.001) ES = 0.242 SC Economic
Performance
0.565 (P < 0.001) ES = 0.225
0.356 (P < 0.001) ES = 0.266
[image:8.595.64.535.646.741.2]latent variables depend. Thus, it was located on the left side of the proposed model.
CONCLUSIONS AND INDUSTRIAL IMPLICATIONS
Based on the findings obtained from the evalua-tion and interpretaevalua-tion of the model, the following conclusions can be established.
Six hypotheses were initially proposed for the model, five of which were accepted.
According to the size of the impact of the latent variable Human Resources Skills on the latent variable SC Flexibility, which is 0.591, it can be stated that most SC flexibility in wine companies is due to the skills and abilities of human resources.
It is usually thought that Human Resources Skills have an impact on the SC Economic Performance. This is correct, although such impact is not direct but rather indirect; it is given through the mediator variables SC Agility and SC Flexibility. Moreover, since human resources are the basis of SC Flexibility, the collaboration of both universities and government institutions is necessary to support the workforce in the development of such skills.
The dependent latent variable SC Agility is for 68% explained by the Human Resources Skills and SC Flexibility, since its R-squared value is R2 = 0.68.
On the one hand, Human Resources Skills are re-sponsible for 0.188 of the explained variance, while the SC Flexibility explains 0.489 units. Thus, when analysing the size effect values, it was concluded that the SC Flexibility in wine companies is essential to achieve the SC Agility outside of them. This means that the managers and administrators must seek to build flexible organizations that can make quick changes in design, cope with the sudden and changing demands of customers, and to rely on highly trained and multifunctional workers that could execute any activity within the SC and prevent the stoppage of material flow along the production processes.
The SC Economic Performance is 71% explained by the SC Agility and SC Flexibility, since its R-squared value is R2 = 0.71. On the one hand, the SC Agility
explains 0.469 of such variance. On the other hand, the SC Flexibility is responsible for 0.242. This dem-onstrates that the SC Agility is crucial for the La Rioja wineries in order to quickly adapt to the cus-tomer demands and to survive in such competitive environment.
Acknowledgements
The authors wish to thank the Autonomous Univer-sity of La Rioja for the support provided to Dr. Jorge Luis García-Alcaraz during his academic stay in that institution. Similarly, the authors are thankful to the National Council of Science and Technology of Mexico for its support in the development of the Thematic Network: Optimization of Industrial Processes, under the award number 260320.
REFERENCES
Alfalla-Luque R., Marin-Garcia J.A., Medina-Lopez C. (2015): An analysis of the direct and mediated effects of employee commitment and supply chain integration on organisational performance. International Journal of Production Economics, 162: 242–257.
Blanchard D. (2010): Supply Chain Management Best Prac-tices. 2nd ed. John Wiley & Sons.
Blome C., Schoenherr T., Eckstein D. (2014a): The impact of knowledge transfer and complexity on supply chain flexibility: A knowledge-based view. International Jour-nal of Production Economics, 147, Part B: 307–316. Böhm A.C., Leone H.P., Henning G.P. (2007): Industrial
supply chains: Performance measures, metrics and benchmarks. In: Valentin P., Şerban A.P. (eds): Computer Aided Chemical Engineering, 24: 757–762.
Das K. (2011): Integrating effective flexibility measures into a strategic supply chain planning model. European Journal of Operational Research, 211: 170–183. Gligor D.M., Esmark C.L., Holcomb M.C. (2015):
Perfor-mance outcomes of supply chain agility: When should you be agile? Journal of Operations Management, 33–34: 71–82.
Gunasekaran A ., Patel C., McGaughey R .E. (2004): A framework for supply chain performance measure-ment. International Journal of Production Economics, 87: 333–347.
Hassini E., Surti C., Searcy C. (2012): A literature review and a case study of sustainable supply chains with a focus on metrics. International Journal of Production Economics, 140: 69–82.
Jin Y., Vonderembse M., Ragu-Nathan T.S., Smith J.T. (2014): Exploring relationships among IT-enabled shar-ing capability, supply chain flexibility, and competitive performance. International Journal of Production Eco-nomics, 153: 24–34.
Ketkar M., Vaidya O.S. (2012): Study of emerging issues in supply risk management in India. Procedia – Social and Behavioral Sciences, 37: 57–66.
Kock N. (2013): Using WarpPLS in e-collaboration stud-ies: What if I have only one group and one condition. International Journal of e-Collaboration, 9: 1–12. Lengnick-Hall M.L., Lengnick-Hall C.A., Rigsbee C.M.
(2013): Strategic human resource management and supply chain orientation. Human Resource Management Review, 23: 366–377.
Li Y., Kramer M.R., Beulens A.J.M., van der Vorst J.G.A.J. (2010): A framework for early warning and proactive control systems in food supply chain networks. Com-puters in Industry, 61: 852–862.
Lin C.-T., Chiu H., Tseng Y.-H. (2006): Agility evaluation using fuzzy logic. International Journal of Production Economics, 101: 353–368.
Mourtzis D., Doukas M. (2014): Design and planning of manufacturing networks for mass customisation and personalisation: challenges and outlook. Procedia CIRP, 19: 1–13.
Petter S., Straub D., Rai A. (2007): Specifying formative constructs in information systems research. MIS Quar-terly, 31: 623–656.
Rexhausen D., Pibernik R., Kaiser G. (2012): Customer-facing supply chain practices – The impact of demand and distribution management on supply chain success. Journal of Operations Management, 30: 269–281. Searcy C., McCartney D., Karapetrovic S. (2007):
Sustain-able development indicators for the transmission system of an electric utility. Corporate Social Responsibility and Environmental Management, 14: 135–151.
Seebacher G., Winkler H. (2015): A capability approach to evaluate supply chain flexibility. International Journal of Production Economics, 167: 177–186.
Sherehiy B., Karwowski W., Layer J.K. (2007): A review of enterprise agility: Concepts, frameworks, and attrib-utes. International Journal of Industrial Ergonomics, 37: 445–460.
Soin S.S. (2004): Critical Success Factors in Supply Chain Management at High Technology Companies. University of Shouthern Queensland, Australia, 2004.
Zhao G., Feng T., Wang D. (2015): Is more supply chain integration always beneficial to financial performance? Industrial Marketing Management, 45: 162–172.