Differential antimicrobial peptide gene expression patterns during early
chicken embryological development
Kieran G. Meade
a, Rowan Higgs
b, Andrew T. Lloyd
a, Seamus Giles
c, Cliona O’Farrelly
a,*
aComparative Immunology Group, School of Biochemistry and Immunology, Trinity College Dublin, Dublin 2, Ireland bMolecular & Cellular Therapeutics, Royal College of Surgeons in Ireland, Dublin 2, Ireland
cSchool of Medicine and Medical Science, Conway Institute for Biomolecular and Biomedical Research, University College Dublin, Belfield, Dublin 4, Ireland
1. Introduction
Newly hatched chickens are immediately confronted with both pathogenic and commensal microorganisms that were not encountered in ovo via both the omnivorous diet and the local environment [1]. Colonisation with some bacterial species can also have major implications for the agricultural industry and human health [2,3]. However, the first few days post-hatch are char-acterised by immune system immaturity as cellular components of the adaptive response are in a naive state and therefore slow to respond to infectious agents [4], leading to increased early mortality in environments of high pathogenic challenge. Although developing chicks receive maternally derived antibodies via the egg yolk, albumin and fluids of the egg, these are a finite and diminishing resource as development proceeds.
Innate components of the immune system detect pathogen associated molecular patterns (PAMPs) by means of pathogen
recognition receptors (PRRs), including Toll-like receptors (TLRs). Soluble mediators of the innate immune system including antimicrobial peptides (AMPs) can activate cells and lead to development and coordination of subsequent immune responses [4]. AMPs are evolutionarily ancient and abundant effector components of the innate immune arsenal in many species of eukaryotes [5,6], and endowed with antimicrobial, chemotactic and immunomodulatory properties [7,8]. The two major families of AMP genes in the chicken are
b
-defensins (with three disulphide bridges, and previously referred to as gallinacins [9]) and cathelicidins (CTHL), which are longer peptides with two bridges. The avianb
-defensin (AvBD) gene family consists of 14 genes (AvBD1–14), which are densely clustered in a single 85 kb region on chromosome 3 [9], and the cathelicidin gene family off our members; CTHL1,CTHLB1,CTHL2andCTHL3[10,11] , spanning 5 kb on chromosome 2.Antimicrobial peptide expression is normally associated with the innate immune response to pathogenic challenge. However, constitutive AMP expression suggests that certain tissues have the ability to resist microbial infection prior to, or without stimulating, an inflammatory cell influx. Early AMP expression after birth has been demonstrated in a number of species, including humans, in the absence of clinical disease. Expression of both
b
-defensins and A B S T R A C TThe adaptive immune system is not completely developed when chickens hatch, so the innate immune system has evolved a range of mechanisms to deal with early pathogenic assault. Avian b-defensins (AvBDs) and cathelicidins (CTHLs) are two major sub-classes of antimicrobial peptides (AMPs) with a
fundamental role in both innate and adaptive immune responses. In this study, we demonstrate distinct expression patterns ofi nnate immune genes including – Toll-like receptors (TLRs) ( TLR2,TLR15 and
TLR21, but not TLR4), the complete repertoire of AvBDs, CTHLs and both pro- and anti-inflammatory
cytokines ( IL1B,IL8,IFNGandIL10) during early chicken embryonic development. AvBD9was significantly increased by over 150 fold at day 9; and AvBD10 was increased by over 100 fold at day 12 in the abdomen of the embryo, relative to day 3 expression levels ( P<0.01). In contrast, AvBD14 was preferentially expressed in the head of the embryo. This is the first study to demonstrate differential patterns of AMP gene expression in the sterile environment of the developing embryo. Our results propose novel roles for AMPs during development and reveal the innate preparedness of developing embryos for pathogenic assault in ovo, or post-hatching.
* Corresponding author. Tel.: +353 1 8963175; fax: +353-1-6772400. E-mail address: [email protected] (C. O’Farrelly).
cathelicidins in the tracheal aspirates of newborn children [12] and in human meconium [13] are thought to contribute to initial microbial colonisation and the development ofi ntestinal home-ostasis after birth [14]. Furthermore, expression of the cathe-licidin gene ( CRAMP – shown to be 10–100 fold greater in neonatal mice than in the adult), is thought to provide an important compensatory neonatal innate immune defence mechanism [15].
In chickens, a study of the enteric immune system in the 1st week post-hatch suggested that the gut is protected by a functionally sufficient innate immune system and showed elevation of
b
-defensin mRNAs on day of hatch, subsequently declining in the 1st week ofl ife [1]. This study was among the first to demonstrate increased expression of defensin genes con-comitant with bacterial colonisation and to speculate on the ‘‘innate preparedness’’ of the chicken innate immune system post-hatch. Although responsiveness of the innate immune system to Salmonella infection has been demonstrated in 1-day-old birds [16],Salmonella enteriditis routinely contaminates eggs[3] and the ability of the chick to counter such an assault in ovois unknown. In addition, the chicken reproductive tract is often contaminated with pathogenic bacteria leading to the production ofi nfected eggs, which can occur during oviposition, originating from the reproductive organs or externally through the eggshell [17]. The contamination rate off orming eggs has been shown to be higher than in laid eggs [18] leading to the suggestion that bacteria were killed by ‘‘factors’’ in the eggs such as antibodies or antibacterial enzymes. The factors that underpin the ability of the developing chick to counter bacterial assault have not been previously identified. In this study we used quantitative real time RT-PCR to detect and measure the expression ofi nnate immune genes which may shed light on the antimicrobial and/or alternative roles of specific AMPs during chicken embryogenesis.2. Materials and methods
2.1. Chick embryo culture
Thirty fertilized chick eggs (Cobb strain, from Celbridge Hatchery, Kildare, Ireland) were incubated at 38 8C and 65–75% relative humidity in a forced air incubator for up to 12 days. At each experimental timepoint – 0, 3, 6, 9 and 12 days (D) post laying, six eggs were removed and opened. Each embryo was then removed from the shell, washed and immediately flash frozen in liquid nitrogen for later processing.
2.2. RNA extraction and quality control
Total RNA was extracted from each embryo using a combined TriReagent1, DNase treatment and Qiagen RNeasy 1 method (Qiagen Ltd.:http:///: www.qiagen.com ) according to the manu-facturer’s instructions. At day 12, the embryo was divided into head and abdomen regions to facilitate processing and timely RNA extraction. This also enabled crude determination of gene expression localisation in the embryo. After day 12, the embryos were too large for whole embryo expression to be but an average of differential expression in many tissues, so the focus in this study was on differential gene expression during early embryogenesis (up to and including day 12 of development). RNA integrity and yield were assessed using an Agilent 2100 Bioanalyzer (Agilent Technologies: www.agilent.com ). Apart from at day 0, where no RNA was recovered, the two-step method for extraction described above - produced RNA of high yield and quality (ratios of 18S to 28S ribosomal RNA averaged >1.8).
2.3. cDNA synthesis, primer design and quantitative real time PCR (qRT-PCR)
Two micrograms of total RNA from each sample was reverse transcribed into cDNA with oligo-dT primers using a SuperScript TM
III first strand synthesis SuperMix kit according to the manufac-turer’s instructions (Invitrogen Ltd.: www.invitrogen.com ). Primers for real time qRT-PCR were designed, to be intron-spanning, using Primer3 software [19] and commercially synthesized (Invitrogen Ltd.). Details for the TLR, cytokine and AMP gene-specific primer sets are available on request. Each reaction was carried out in duplicate in a total volume of 25
m
l with 2m
l of cDNA (40 ng/m
l), 12.5m
l 2 PCR master mix (Stratagene Corp.: www.stratagene.com ), and 10.5m
l primer/H 2O. Optimal concentrations of primers were determined bytitrating 100, 300 and 900 nM final concentrations of the forward and reverse primers. Real time qRT-PCR was performed using an MX3000P 1 quantitative PCR system (Stratagene Corp.) with the following cycling parameters: 95 8C for 10 min followed by 40 cycles of 95 8C for 30 s, 60 8C for 1 min and 72 8C for 30 s followed by amplicon dissociation. Resulting PCR amplicons were separated on 2% agarose gels to confirm the amplification of distinct bands and to assess the expression of each gene at day 3 after laying ( Fig. 1). GeNorm, a tool that facilitates the comparison of gene expression changes for a number of potential normaliser genes in all experimental samples, was used to select the most stable gene for the calculation of relative expression changes [20]. Data from qRT-PCR, carried out for each putative normaliser gene on all embryo samples over the entire developmental timecourse, were analyzed using the GeNorm package. GeNorm calculates a gene expression stability measure ‘ M’ for a control gene as the pairwise variation for that gene with all other tested control genes. The tested genes are then ranked in order of decreasing M values or increasing mRNA expression stability. Primer efficiencies were also calculated using a standard curve, and the results are shown in Table 1.
2.4. Data presentation and analysis
Based on the GeNorm analyses, the Ribosomal Protein L7 gene (RPL7) was selected as the normaliser gene. The 2 DDCt method
[image:2.595.304.553.500.704.2]was used to determine median fold changes in gene expression
[21] and expression levels at day 3 after laying were used as calibrators to generate the graphs shown in Figs. 2 and 4. Box-plots, a standard data visualisation tool are used to display differences between time points without making any assumptions of the underlying statistical distribution. The spacings within the box indicate the degree of dispersion (range and inter-quartile distance) and skewness in the data. Box-plots show the median value, which is more representative than the mean in data sets where gene expression responses can be highly variable. Statistical comparisons were performed using non-parametric Mann–Whit-ney U-tests as implemented in version 5.01 of StatView (SAS Institute Inc. Cary, NC, USA) with a P value <0.05 considered significant ( Table 2).
2.5. Bioinformatics analyses
All sequence alignments were carried out using ClustalW 1.83 using default parameters [22]. The phylogenetic tree ( Fig. 3) was constructed using the neighbor-joining algorithm implemented in Mega 2.1 [23]. Analysis of predicted transcription factor (TF) binding sites in gene promoter regions was performed using MATINSPECTOR software [24].
3. Results
3.1. Experiment-specific normaliser gene
Expression profiles in the present study were generated using data derived from quantitative real time PCR which is a sensitive and accurate technique, routinely used for high-throughput gene expression analysis. Despite the sensitivity of the platform, however, reliable results can only be attained through careful selection of a stable endogenous normaliser or ‘housekeeping’ gene which is increasingly realised as critical to the accurate analysis of relative gene expression changes [25–28] . This is of particular importance in infection timecourse studies where traditionally used genes such as ACTB and GAPDH are often found to be differentially expressed [29]. Even in the absence ofi nfection, large variation in the expression levels of commonly used normaliser genes has been demonstrated in human foetal tissue [30], and therefore it was important to identify a stable normaliser gene for the particular physiological conditions inherent in the present study.
We carried out a systematic survey of gene expression variation using five candidate normaliser genes ( ACTB,GAPDH,28S,RPL7, and
LDHA) and established that Ribosomal Protein L7 (RPL7) was the gene with most stable expression over the developmental time-course, with an M value of 0.58 (lower M value indicates increasingly stable gene expression across all samples). In contrast to this, the most variable of the putative qRT-PCR normaliser genes was 28S rRNA with an M value of 1.161 ( Table 1). In a study of human gene expression, RPL7was among the 47 genes listed to be expressed at similar levels across 11 foetal tissues, which supports our choice of normaliser gene for this study [30]. It is important also to calculate the efficiency of amplification for each set of primers [31] to enable accurate calculation of gene expression changes. The efficiencies of each primer pair was calculated from a Table 1
GeNorm was used to calculate gene expression stability values (highest ‘ M’ value indicates the least stable gene) combined with primer PCR amplification efficiency analysis, highlighted RPL7as the most reliable normaliser gene for qRT-PCR gene expression analysis across the developmental timecourse.
Gene symbol Percentage efficiency Mvalue
28S rRNA 100 1.161
GAPDH 197 0.720
ACTB 84 0.654
RPL7 93 0.583
[image:3.595.42.563.467.728.2]LDHA 106 0.617
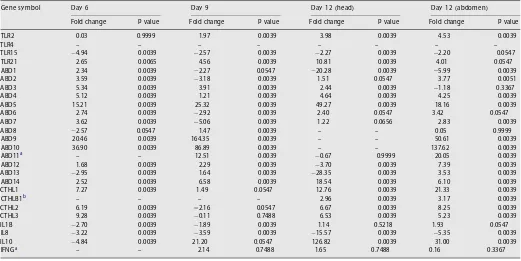
Table 2
Median fold change in gene expression across the developmental timecourse ( n= 6 per timepoint) relative to expression at day 3 (values in bold are significant at P<0.05).
) n e m o d b a ( 2 1 y a D ) d a e h ( 2 1 y a D 9 y a D 6 y a D l o b m y s e n e G
Fold change Pvalue Fold change Pvalue Fold change Pvalue Fold change Pvalue
TLR2 0.03 0.9999 1.97 0.0039 3.98 0.0039 4.53 0.0039
TLR4 – – – – – – – –
TLR15 4.94 0.0039 2.57 0.0039 2.27 0.0039 2.20 0.0547
TLR21 2.65 0.0065 4.56 0.0039 10.81 0.0039 4.01 0.0547
ABD1 2.34 0.0039 2.27 0.0547 20.28 0.0039 5.99 0.0039
ABD2 3.59 0.0039 3.18 0.0039 1.51 0.0547 3.77 0.0051
ABD3 5.34 0.0039 3.91 0.0039 2.44 0.0039 1.18 0.3367
ABD4 5.12 0.0039 1.21 0.0039 4.64 0.0039 4.25 0.0039
ABD5 15.21 0.0039 25.32 0.0039 49.27 0.0039 18.16 0.0039
ABD6 2.74 0.0039 2.92 0.0039 2.40 0.0547 3.42 0.0547
ABD7 3.62 0.0039 5.06 0.0039 1.22 0.0656 2.83 0.0039
ABD8 2.57 0.0547 1.47 0.0039 – – 0.05 0.9999
ABD9 20.46 0.0039 164.35 0.0039 – – 50.61 0.0039
ABD10 36.90 0.0039 86.89 0.0039 – – 137.62 0.0039
ABD11a – – 12.51 0.0039 0.67 0.9999 20.05 0.0039
ABD12 1.68 0.0039 2.29 0.0039 3.70 0.0039 7.39 0.0039
ABD13 2.95 0.0039 1.64 0.0039 28.35 0.0039 3.53 0.0039
ABD14 2.52 0.0039 6.58 0.0039 18.54 0.0039 6.10 0.0039
CTHL1 7.27 0.0039 1.49 0.0547 12.76 0.0039 21.33 0.0039
CTHLB1b – – – – 2.96 0.0039 3.17 0.0039
CTHL2 6.19 0.0039 2.16 0.0547 6.67 0.0039 8.25 0.0039
CTHL3 9.28 0.0039 0.11 0.7488 6.53 0.0039 5.23 0.0039
IL1B 2.70 0.0039 1.89 0.0039 1.14 0.5218 1.93 0.0547
IL8 3.22 0.0039 3.59 0.0039 15.57 0.0039 5.35 0.0039
IL10 4.84 0.0039 21.20 0.0547 126.82 0.0039 31.00 0.0039
IFNGa – – 2.14 0.7488 1.65 0.7488 0.16 0.3367
standard curve across a 5 point dilution series from 5–80 ng cDNA, and results shown in Table 1.
3.2. Innate immune gene expression at day 3 of development
Baseline innate immune gene expression varied between genes but was, in general, consistent for each of the six embryos at day 3 after laying. The strongly expressed
b
-defensin genes at day 3 of development were AvBD5, AvBD7,AvBD9 and AvBD10, whereasAvBD11was not expressed. Similarly CTHL1,CTHL2andCTHL3were all expressed at day 3, but CTHLB1was not. Expression of both Toll-like receptors and cytokines was low at this timepoint. Gene expression for the 27 genes analysed in this study is shown in
Fig. 1.
3.3. Differential early patterns of
b
-defensin gene expressionTo determine the changes in gene expression during early embryological development, differential gene expression was subsequently analysed across the first 12 days of the develop-mental timecourse, using qRT-PCR. Each gene showed significant changes in expression, with profiles suggestive of developmental regulation. Relative gene expression changes are detailed in
Table 2 and shown grouped according to magnitude off old
change in Fig. 2A.
Eleven of the thirteen AvBDs expressed at day 6 after laying were significantly increased relative to expression at day 3, whereas only AvBD13 was significantly decreased in expression (Fig. 2A; P<0.01). AvBD5,AvBD9 andAvBD10 were increased by the greatest magnitude (15, 20 and 36 fold, respectively). Nine days after laying, 10 out of 14 AvBDs are significantly increased relative to day 3 including AvBD5(25 fold), AvBD9(164 fold), AvBD10 (86 fold) and AVBD11 (12 fold) ( P< 0.01). Conversely, AvBD2,AvBD6
and AvBD7 are significantly decreased in expression relative to expression at day 3, and at a lower magnitude of between 2 and 5 fold (Fig. 2A; P< 0.01).
3.4. Localisation of
b
-defensin gene expressionAt day 12 of development due to the significant increase in embryo size, AMP gene expression was comparable between the head and the abdomen of the embryo, and localisation of expression was detected. Of the four
b
-defensins with increased gene expression in the head relative to day 3 ( AvBD3,AvBD4,AvBD5and AvBD14), AvBD5 was the most significantly increased in expression, with a 49 fold increase ( P<0.01). AvBD1,AvBD12 and
AvBD13were significantly decreased in expression (by 20, 3 and 28 fold, respectively) in the head of the embryo, relative to expression at day 3 (P<0.01).
Expression of 10
b
-defensin genes was significantly increased in the abdomen of each embryo at day 12 relative to expression at day 3. These include AvBD2,AvBD4,AvBD5,AvBD7,AvBD9,AvBD10,AvBD11, AvBD12, AvBD13 and AvBD14. The most significant increases detected were AvBD9 (50 fold), AvBD10 (137 fold) and
AvBD11 (20 fold) ( Fig. 2A; P< 0.01). AvBD1 was the only gene decreased in expression in the abdomen by almost 6 fold ( Fig. 2A;
P< 0.01).
Three
b
-defensins – AvBD4,AvBD5andAvBD14 were expressed in both sections of the embryo. Equivalent increases in expression was detected in both the head and abdomen of the embryo forAvBD4 (4 fold; P< 0.01), whereas preferential expression in the head was evident for others. AvBD5 showed significant increased expression of 49 fold in the head region, compared against 18 fold in the abdomen, whereas AvBD14was significantly increased by 18 and 6 fold in the head and abdomen, respectively; P<0.01 (Fig. 2A). Expression of AvBD8, AvBD9 and AvBD10 genes was restricted to the abdomen of the embryo at day 12 after laying.
3.5. Differential expression of cathelicidin genes
Whole embryo gene expression profiling was also performed for the four known avian cathelicidin genes ( CTHL1,CTHLB1,CTHL2
andCTHL3) across the developmental timecourse. CTHLB1was the only member of the gene family found not to be expressed at day 3 of development ( Fig. 1). Six days after laying, expression of CTHL1,
CTHL2and CTHL3was significantly increased by between 6 and 9 fold (P< 0.01). Expression levels were reduced at day 9, subsequent to which they increase again ( Fig. 2B). In contrast to the expression of the other three members of this gene family,
CTHLB1 was not expressed until day 9.
All four cathelicidin genes were significantly increased by day 12 after laying, with no significant evidence of preferential expression in either the head or the abdomen of the embryo (Fig. 2B). CTHL1gene expression was increased by 12 and 21 fold,
CTHLB1by 3 fold in both, CTHL2by 6 and 8 fold, and CTHL3by 6 and 5 fold in the head and abdomen of the embryo, respectively (P<0.05; Table 2 andFig. 2B).
3.6. Correlation between AMP gene expression, genomic positioning and phylogenetic relatedness
The close evolutionary relationship among
b
-defensin and cathelicidin family members means that the genomic positioning and degree of phylogenetic similarity may aid the interpretation of gene expression patterns. A transcriptional shift in the expression levels for AvBD2,AvBD4,AvBD6andAvBD7and the cathelicidin genes was evident at day 9 of development ( Fig. 2A and B). Whereas expression levels for each of these genes increased at day 6, it was significantly reduced at day 9 and subsequently increases again at day 12 after laying relative to day 3. AvBD2,AvBD6, andAvBD7are positioned together in the middle of the gene family cluster [9] suggesting possible coordinated expression of contiguous genes. Furthermore, AvBD6 andAvBD7, which exhibit similar expression profiles across the developmental timecourse ( Fig. 2A) are recent tandem gene duplicates ( Fig. 3). Similarly, the expression pattern ofAvBD3,AvBD4,AvBD5andAvBD14 are similar, and all of which are positioned at the right end of the gene family cluster on chromosome 3, indicating that the regulation of these genes may be under the control of similar promoter elements.
The expression of the four cathelicidins also correlates closely with their phylogenetic relationships. The expression profile of
CTHL1,CTHL2, andCTHL3genes follows a similar profile across the developmental timecourse, whereas expression of CTHLB1 shows a very different pattern of expression, perhaps reflective ofi ts more distant evolutionary relationship ( Fig. 3).
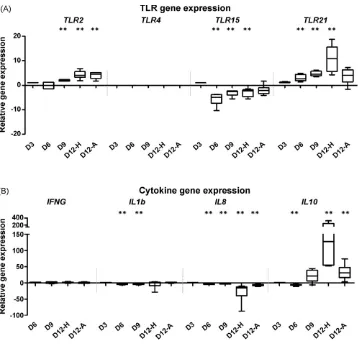
3.7. Differential expression of TLR genes
The expression of established ( TLR2 and TLR4) and recently discovered ( TLR15 and TLR21) TLR genes was also measured in
chicken whole embryo RNA across the developmental timecourse. Relatively low levels of TLR2 and TLR15 l expression were detected ( Fig. 4A, P< 0.05) whilst expression of the novel
TLR21gene, was highest in the head of the embryo at day 12 after laying (10 fold, P< 0.01). Only weak amplification of TLR4 was detected in some embryos at day 3 ( Fig. 1), but was expressed in pooled chicken caecum samples used as a positive control (data not shown).
3.8. l expression of cytokine genes
The expression of three important proinflammatory cytokine genes was profiled across the developmental timecourse. Small but significant changes were detected in both IL8 and IL1B gene expression at various time points ( P<0.05; Fig. 4B). The only significant changes in gene expression for these cytokines were reductions in the levels of expression across the timecourse. Expression of IFNG was detected only at low levels across the timecourse, and was not significantly y expressed (Table 2 andFig. 4B). Overall, these results suggest that there was no active inflammation in the embryos, and are indicative of a pathogen-free environment.
Expression of the anti-inflammatory cytokine IL10was reduced in the whole embryo at day 6 of development, in comparison to levels at day 3 ( 4 fold, P<0.01). Subsequently at day 9, a 21 fold increase in relative IL10 gene expression was detected ( Fig. 4A). Expression levels of IL10continue to significantly increase by 127 fold and 31 fold in the head and the abdomen of the embryo, respectively, relative to day 3 levels ( P< 0.01).
4. Discussion
The immune system of the chick is an invaluable model for studying basic immunology and has made seminal contributions
to some fundamental principles [32]. As a result, it is now known that the immune system in poultry, like that of mammals, has developed several defence strategies to cope with a wide spectrum of pathogens [33,34] . Despite the multiple immunodefensive mechanisms present in eggs – AMPs in eggshell [35], iron depleted and lysozyme-rich egg white, and antibodies in yolk [3,36,37] , eggs do become contaminated during oviposition in the reproductive tract of the hen or from external bacteria that cross the shell
[17,18] . AMP expression in the embryological development of
other species has been studied: human amnion epithelial cells have been found to express
b
-defensin 3, which was induced in response to LPS and peptidoglycan, [38], suggesting a role for AMPs in defence during embryonic development. In addition, cathe-licidin ( CRAMP) gene expression was detected in mouse embryos at day 12 of development [39]. However, the antimicrobial mechan-isms that protect the developing embryo and newly hatched chick are ill-defined [14].To address this, expression of TLRs, AMPs and cytokine genes during early chicken embryogenesis was analysed. Of the 26 single gene expression studies carried out, 25 genes were expressed at some stage across the developmental timecourse and from the total 100 pairwise gene expression comparisons, 72 were significant at
P<0.05, indicating that these innate immune genes are di eren-tially regulated during embryogenesis ( Table 2). Increased AMP gene expression was the general trend during embryogenesis. Interest-ingly a transition to lower expression both of a number of both
b
-defensins ( AvBD2,AvBD4,AvBD6andAvBD7) and all four cathelicidin genes was evident day 9 of development, the significance of which remains unclear. Theb
-defensins with the greatest magnitude in expression changes were AvBD5,AvBD9,AvBD10andAvBD14, which ranged from 15 to 164 fold increases at various stages of development ( Table 2). The recently characterised cathelicidin gene family, includes CTHLB1 [10,11], which is not expressed until after the transcriptional shift at day 9, and was subsequently expressed in both the head and abdomen of the embryo. This finding contrasts with the previously shown expression restricted to the epithelium of the bursa of Fabricius [10] suggesting either alternative functions of this AMP, or a wider range of expression early in development that becomes restricted on maturity. Overall, these results are suggestive of the developmental regulation of AMPs in early chick embryogen-esis, as has been observed in sheep, where it was thought to compare with anatomical di erentiation and reflect physiologic adaptations to extra-uterine life [40].The preferential localisation of gene expression to the head or the abdomen of the chicken embryo may indicate cell-type specificity in expression of AMPs. A recent study has shown expression of porcine
b
-defensin 1 was only present in tongue of newborn piglets, as distinct from a wider panel of tissues in 4–5-week-old pigs [41]. It was therefore o nterest to examine the correlation between this early localisation ofb
-defensin expres-sion during embryogenesis and the tissue specific expresexpres-sion patterns observed in earlier studies [42,43] . In a similar context,AvBD3, AvBD4 and AvBD5 have been consistently found to be expressed in the tongue [43–45] , which correlates with the localisation of expression of these AvBDs to the head of the embryo in this study. These three genes also lack the first untranslated exon common in other AVBDs [44] and cluster together at the end of the chromosome thus supporting a role for coordinated regulation of syntenic genes. Furthermore, we predict that AvBD14, will be similarly expressed in the tongue, due to the preferential expression of this gene in the head of the embryo and its genomic positioning alongside AvBD3, AvBD4, and AvBD5. In contrast, expression patterns of AvBD8,AvBD9 andAvBD10, show localisa-tion of expression to the abdomen of the embryo, correlating with the wider tissue expression panel detected in other studies [42,43] . Fig. 3.Phylogenetic tree of avian b-defensin (AvBDs) and cathelicidin (CTHL) genes,
l binding of transcription factors to promoter regions of AMP genes are likely to determine, at least in part, the kinetics of l expression detected in this study. Multiple sequence alignment of the 14
b
-defensin gene promoter regions showed high sequence diversity and in silico analysis predicted a mean of 172 putative transcription factor binding sites (TFBSs) within each 1000 bp promoter gene region. Only the tandem duplicates, AvBD6and AvBD7 showed homology in the upstream region, reflecting their close evolutionary history. The high number of predicted TFBS likely reflects the importance of tight regulation of AMP expression during the immune response and potentially during development. The c-Rel subunit of NF
k
B is predicted to bind to the upstream region of the highly expressed genes – AvBD5,AvBD9andAvBD10, suggesting that expression of these genes is inducible, in agreement with recent studies [46]. NKX homeodomain factors are one of the most common TF families predicted to bind to the promoter region of all AvBDs, except AvBD6 andAvBD14. This TF family have been shown to regulate ventral neural patterning during mammalian as well as chicken development [47]. Although this supports our hypothesis of pleiotropic roles for AvBDs during embryogenesis, in the absence of additional information (e.g. single nucleotide polymorphisms) or methods for laboratory confirmation of binding, the role of specific TFs in controlling AvBD expression in the developing chicken embryo could not be ascertained at this stage.
It seems likely that the general trend o ncreased AMP expression represents a mechanism to protect both the embryo
and the newly hatched chick from pathogenic assault. AvBD11, a peptide with broad antimicrobial efficacy [46] was recently found it to be one of the most abundant proteins in the vitelline outer membrane of the egg [48], suggestive of an important immuno-logical function. The expression of AvBD11(previously been shown to be restricted to the thymus [45]), was significantly increased during embryogenesis, which supports a role for AvBD11 in immunoprotection of the embryo in ovo. However, the lack of TLR2,
TLR15and proinflammatory cytokine induction strongly suggests a pathogen-free environment in ovo. Therefore, the induction of AMPs is more likely to represent a preparatory mechanism to protect the newly hatched chick, rather than a response to in ovo
infection. Furthermore, the lack o nflammation coupled with the absence of TLR4 gene expression suggests that AMP gene regulation in early embryogenesis is not being induced by LPS, a cell wall component of Gram-negative bacteria, including Salmo-nella. Lysozyme, a major protein component of eggs, is known to bind and detoxify LPS [49], and its presence may compensate for the absence of TLR4 in the event o nfection in ovo.
[image:7.595.124.482.62.406.2]inflammatory cytokine gene – IL10, which localizes to the head of the embryo and may be involved in the regulation of AMP expression. Indeed, it appears that an overall anti-inflammatory state is promoted in the head of the developing embryo at day 12, as indicated by increased levels of IL10and decreased levels of IL8. The significance of this has yet to be resolved but may indicate an important stage in the development of the brain.
In summary, we demonstrate the expression of the full complement of two major AMP gene families during early chick embryogenesis, in the absence ofi nfection. Multiple functions have been attributed to AMPs [7,8] and our results suggest that these molecules may play pleiotropic roles during development. However, the differential AMP gene expression patterns detected suggest a primary and direct role for both
b
-defensins and cathelicidins in the protection of chickens from potential pathogenic assault in ovo, and particularly post-hatch. SNPs inAvBD3andAvBD7have been previously associated with resistance toSalmonella infection in broiler chickens [55,56] , and the use of genetic markers for resistance to infection would eliminate many of the current limitations in enhancing immune function [57]. Manipulation of AMP expression levels, via maternal diet for example [58,59] may in future be a mechanism to control the selective colonisation of chickens by particular bacteria and thereby exclude zoonotic agents including Salmonella and Campy-lobacter.
Acknowledgements
The authors would like to thank Fernando Narciandi for technical assistance. This work was funded by the Irish Depart-ment of Agriculture, Fisheries and Food, under the Food Institu-tional Research Measure (grant number: 06RDD486).
References
[1] Bar-Shira E, Friedman A. Development and adaptations ofi nnate immunity in the gastrointestinal tract of the newly hatched chick. Dev Comp Immunol 2006;30(10):930–41.
[2] Sahin O, Morishita TY, Zhang Q. Campylobactercolonization in poultry: sources ofi nfection and modes of transmission. Anim Health Res Rev 2002;3(2): 95–105.
[3] Guard-Petter J. The chicken, the egg and Salmonella enteritidis. Environ Micro-biol 2001;3(7):421–30.
[4] Firth MA, Shewen PE, Hodgins DC. Passive and active components of neonatal innate immune defenses. Anim Health Res Rev 2005;6(2):143–58. [5] Mookherjee N, Wilson HL, Doria S, Popowych Y, Falsafi R, Yu JJ, Li Y, Veatch S,
Roche FM, Brown KL, Brinkman FS, Hokamp K, Potter A, Babiuk LA, Griebel PJ, Hancock RE. Bovine and human cathelicidin cationic host defense peptides similarly suppress transcriptional responses to bacterial lipopolysaccharide. J Leukoc Biol 2006;80(6):1563–74.
[6] Brogden KA, Ackermann M, McCray Jr PB, Tack BF. Antimicrobial peptides in animals and their role in host defences. Int J Antimicrob Agents 2003;22(5): 465–78.
[7] Elsbach P. What is the real role of antimicrobial polypeptides that can mediate several other inflammatory responses? J Clin Invest 2003;111(11):1643–5. [8] Yang D, Biragyn A, Hoover DM, Lubkowski J, Oppenheim JJ. Multiple roles of
antimicrobial defensins, cathelicidins, and eosinophil-derived neurotoxin in host defense. Annu Rev Immunol 2004;22:181–215.
[9] Lynn DJ, Higgs R, Lloyd AT, O’Farrelly C, Herve-Grepinet V, Nys Y, Brinkman FS, Yu PL, Soulier A, Kaiser P, Zhang G, Lehrer RI. Avian beta-defensin nomen-clature: a community proposed update. Immunol Lett 2007;110(1):86–9. [10] Goitsuka R, Chen CL, Benyon L, Asano Y, Kitamura D, Cooper MD. Chicken
cathelicidin-B1, an antimicrobial guardian at the mucosal M cell gateway. Proc Natl Acad Sci U S A 2007;104(38):15063–8.
[11] Xiao Y, Cai Y, Bommineni YR, Fernando SC, Prakash O, Gilliland SE, Zhang G. Identification and functional characterization of three chicken cathelicidins with potent antimicrobial activity. J Biol Chem 2006;281(5):2858–67. [12] Schaller-Bals S, Schulze A, Bals R. Increased levels of antimicrobial peptides in
tracheal aspirates of newborn infants during infection. Am J Respir Crit Care Med 2002;165(7):992–5.
[13] Kai-Larsen Y, Bergsson G, Gudmundsson GH, Printz G, Jornvall H, Marchini G, Agerberth B. Antimicrobial components of the neonatal gut affected upon colonization. Pediatr Res 2007;61(5, Part 1):530–6.
[14] Menard S, Forster V, Lotz M, Gutle D, Duerr CU, Gallo RL, Henriques-Normark B, Putsep K, Andersson M, Glocker EO, Hornef MW. Develop-mental switch ofi ntestinal antimicrobial peptide expression. J Exp Med 2008;205(1):183–93.
[15] Dorschner RA, Lin KH, Murakami M, Gallo RL. Neonatal skin in mice and humans expresses increased levels of antimicrobial peptides: innate immu-nity during development of the adaptive response. Pediatr Res 2003;53(4): 566–72.
[16] Withanage GS, Kaiser P, Wigley P, Powers C, Mastroeni P, Brooks H, Barrow P, Smith A, Maskell D, McConnell I. Rapid expression of chemokines and proin-flammatory cytokines in newly hatched chickens infected with Salmonella entericaserovar typhimurium. Infect Immun 2004;72(4):2152–9.
[17] De Buck J, Van Immerseel F, Haesebrouck F, Ducatelle R. Colonization of the chicken reproductive tract and egg contamination by Salmonella. J Appl Microbiol 2004;97(2):233–45.
[18] Keller LH, Benson CE, Krotec K, Eckroade RJ. Salmonella enteritidis colonization of the reproductive tract and forming and freshly laid eggs of chickens. Infect Immun 1995;63(7):2443–9.
[19] Rozen S, Skaletsky H. Primer3 on the WWW for general users and for biologist programmers. Methods Mol Biol 2000;132:365–86.
[20] Vandesompele J, De Preter K, Pattyn F, Poppe B, Van Roy N, De Paepe A, Speleman F. Accurate normalization of real-time quantitative RT-PCR data by geometric averaging of multiple internal control genes. Genome Biol 2002;3(7) [Research0034].
[21] Livak KJ, Schmittgen TD. Analysis of relative gene expression data using real-time quantitative PCR and the 2(-Delta Delta C(T)) Method. Methods 2001;25(4):402–8.
[22] Thompson JD, Higgins DG, Gibson TJ. CLUSTAL W: improving the sensitivity of progressive multiple sequence alignment through sequence weighting, posi-tion-specific gap penalties and weight matrix choice. Nucleic Acids Res 1994;22(22):4673–80.
[23] Kumar S, Nei M, Dudley J, Tamura K. MEGA: a biologist-centric software for evolutionary analysis of DNA and protein sequences. Brief Bioinform 2008;9:299–306.
[24] Quandt K, Frech K, Karas H, Wingender E, Werner T. MatInd and MatInspector: new fast and versatile tools for detection of consensus matches in nucleotide sequence data. Nucleic Acids Res 1995;23(23):4878–84.
[25] Dheda K, Huggett JF, Chang JS, Kim LU, Bustin SA, Johnson MA, Rook GA, Zumla A. The implications of using an inappropriate reference gene for real-time reverse transcription PCR data normalization. Anal Biochem 2005;344(1): 141–3.
[26] Robert C, McGraw S, Massicotte L, Pravetoni M, Gandolfi F, Sirard MA. Quantification of housekeeping transcript levels during the development of bovine preimplantation embryos. Biol Reprod 2002;67(5):1465–72. [27] De Ketelaere A, Goossens K, Peelman L, Burvenich C. Technical note: validation
ofi nternal control genes for gene expression analysis in bovine polymorpho-nuclear leukocytes. J Dairy Sci 2006;89(10):4066–9.
[28] Dheda K, Huggett JF, Bustin SA, Johnson MA, Rook G, Zumla A. Validation of housekeeping genes for normalizing RNA expression in real-time PCR. Bio-techniques 2004;37(1):112–4. 116, 118–9.
[29] Meade KG, Gormley E, Doyle MB, Fitzsimons T, O’ Farrelly C, Costello E, Keane J, Zhao Y, MacHugh DE. Innate gene repression associated with Mycobacterium bovisinfection in cattle: toward a gene signature of disease. BMC Genomics 2007;8(1):400.
[30] Warrington JA, Nair A, Mahadevappa M, Tsyganskaya M. Comparison of human adult and fetal expression and identification of 535 housekeeping/ maintenance genes. Physiol Genomics 2000;2(3):143–7.
[31] Nolan T, Hands RE, Bustin SA. Quantification of mRNA using real-time RT-PCR. Nat Protoc 2006;1(3):1559–82.
[32] Davison TF. The immunologists’ debt to the chicken. Br Poult Sci 2003;44(1): 6–21.
[33] Scott TR. Our current understanding of humoral immunity of poultry. Poult Sci 2004;83(4):574–9.
[34] Erf GF. Cell-mediated immunity in poultry. Poult Sci 2004;83(4):580–90. [35] Wellman-Labadie O, Lakshminarayanan R, Hincke MT. Antimicrobial
proper-ties of avian eggshell-specific C-type lectin-like proteins. FEBS Lett 2008;582(5):699–704.
[36] O’Farrelly C, Branton D, Wanke CA. Oral ingestion of egg yolk immunoglobulin from hens immunized with an enterotoxigenic Escherichia colistrain prevents diarrhea in rabbits challenged with the same strain. Infect Immun 1992;60(7): 2593–7.
[37] Deignan T, Alwan A, Malone L, Kelly J, O’Farrelly C. Hen egg yolk prevents bacterial adherence: a novel function for a familiar food. J Food Sci 2001;66(1): 158–61.
[38] Buhimschi IA, Jabr M, Buhimschi CS, Petkova AP, Weiner CP, Saed GM. The novel antimicrobial peptide beta3-defensin is produced by the amnion: a possible role of the fetal membranes in innate immunity of the amniotic cavity. Am J Obstet Gynecol 2004;191(5):1678–87.
[39] Gallo RL, Kim KJ, Bernfield M, Kozak CA, Zanetti M, Merluzzi L, Gennaro R. Identification of CRAMP, a cathelin-related antimicrobial peptide expressed in the embryonic and adult mouse. J Biol Chem 1997;272(20): 13088–93.
[41] Elahi S, Buchanan RM, Attah-Poku S, Townsend HG, Babiuk LA, Gerdts V. The host defense peptide beta-defensin 1 confers protection against Bordetella pertussisin newborn piglets. Infect Immun 2006;74(4):2338–52.
[42] Higgs R, Lynn DJ, Gaines S, McMahon J, Tierney J, James T, Lloyd AT, Mulcahy G, O’Farrelly C. The synthetic form of a novel chicken beta-defensin identified in silico is predominantly active against intestinal pathogens. Immunogenetics 2005;57(1–2):90–8.
[43] Lynn DJ, Higgs R, Gaines S, Tierney J, James T, Lloyd AT, Fares MA, Mulcahy G, O’Farrelly C. Bioinformatic discovery and initial characterisation of nine novel antimicrobial peptide genes in the chicken. Immunogenetics 2004;56(3):170–7. [44] Xiao Y, Hughes AL, Ando J, Matsuda Y, Cheng JF, Skinner-Noble D, Zhang G. A
genome-wide screen identifies a single beta-defensin gene cluster in the chicken: implications for the origin and evolution of mammalian defensins. BMC Genomics 2004;5(1):56.
[45] Ma DY, Liu SW, Han ZX, Li YJ, Shan AS. Expression and characterization of recombinant gallinacin-9 and gallinacin-8 in Escherichia coli. Protein Expr Purif 2008;58(2):284–91.
[46] Van Dijk A, Veldhuizen EJ, Kalkhove SI, Tjeerdsma-van Bokhoven JL, Romijn RA, Haagsman HP. The beta-defensin gallinacin-6 is expressed in the chicken digestive tract and has antimicrobial activity against food-borne pathogens. Antimicrob Agents Chemother 2007;51(3):912–22.
[47] Cai J, St Amand T, Yin H, Guo H, Li G, Zhang Y, Chen Y, Qiu M. Expression and regulation of the chicken Nkx-6.2 homeobox gene suggest its possible invol-vement in the ventral neural patterning and cell fate specification. Dev Dyn 1999;216(4–5):459–68.
[48] Mann K. Proteomic analysis of the chicken egg vitelline membrane. Proteo-mics 2008;8:2322–32.
[49] Takada K, Ohno N, Yadomae T. Detoxification ofl ipopolysaccharide (LPS) by egg white lysozyme. FEMS Immunol Med Microbiol 1994;9(4):255–63.
[50] Linde A, Ross CR, Davis EG, Dib L, Blecha F, Melgarejo T. Innate immunity and host defense peptides in veterinary medicine. J Vet Intern Med 2008;22(2): 247–65.
[51] Vora P, Youdim A, Thomas LS, Fukata M, Tesfay SY, Lukasek K, Michelsen KS, Wada A, Hirayama T, Arditi M, Abreu MT. Beta-defensin-2 expression is regulated by TLR signaling in intestinal epithelial cells. J Immunol 2004;173(9):5398–405.
[52] Diamond G, Russell JP, Bevins CL. Inducible expression of an antibiotic peptide gene in lipopolysaccharide-challenged tracheal epithelial cells. Proc Natl Acad Sci U S A 1996;93(10):5156–60.
[53] Selsted ME, Ouellette AJ. Mammalian defensins in the antimicrobial immune response. Nat Immunol 2005;6(6):551–7.
[54] Wu H, Zhang G, Minton JE, Ross CR, Blecha F. Regulation of cathelicidin gene expression: induction by lipopolysaccharide, interleukin-6, retinoic acid, and Salmonella enterica serovar typhimurium infection. Infect Immun 2000;68(10):5552–8.
[55] Hasenstein JR, Lamont SJ. Chicken gallinacin gene cluster associated with Salmonellaresponse in advanced intercross line. Avian Dis 2007;51(2):561–7. [56] Hasenstein JR, Zhang G, Lamont SJ. Analyses of five gallinacin genes and the
Salmonella enterica serovar Enteritidis response in poultry. Infect Immun 2006;74(6):3375–80.
[57] Fulton JE. Selection for avian immune response: a commercial breeding company challenge. Poult Sci 2004;83(4):658–61.
[58] Trebichavsky I, Splichal I. Probiotics manipulate host cytokine response and induce antimicrobial peptides. Folia Microbiol (Praha) 2006;51(5):507–10. [59] Wise MG, Siragusa GR. Quantitative analysis of the intestinal bacterial