DOES IT PAY TO WORK FROM HOME? EXAMINING THE FACTORS
INFLUENCING WORKING FROM HOME IN THE GREATER DUBLIN
AREA
Brian Caulfield
Assistant Professor
Trinity College Dublin
Abstract
Encouraging working from home or telecommuting has long been seen as a means to encourage sustainable mobility. With increase coverage of high-speed Internet access and escalating transport costs, telecommuting has become more attractive than ever. This paper seeks to explore the factors that encourage telecommuting in the Greater Dublin Area (GDA) in Ireland. The research presented in this paper considers how factors such as public transport access, deprivation, industrial grouping, car ownership, household structure and residential density, impact upon the decision to work from home. The paper also seeks to determine the cost savings in terms of travel time saved that those telecommuting enjoy on an annual basis. The findings of this study show a substantial travel time and cost of travel time saving in the GDA. The findings also suggest areas several factors such as broadband Internet coverage, public transport availability and occupation all impact upon the propensity to work from home.
1. Introduction and background
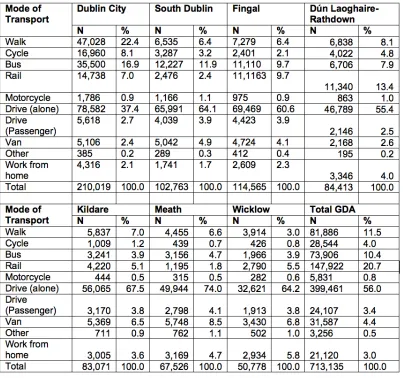
This paper focuses upon the GDA and asks the question what factors impact upon individuals’ decision to working from home. The GDA includes the counties of Dublin, Kildare, Wicklow and Meath and in 2011 had a population of approximately 1.8 million (CSO, 2011). Typically approximately 56% of the total population of the GDA drive to work alone on a daily basis (See Table 2) and car ownership levels in some areas of Dublin County are substantially higher than that of the rest of Ireland (Caulfield, 2012). Over the past number of years policies have been introduced to reduce reliance on driving and encourage modal shift to more sustainable modes of transport. In 2009, the Irish government launched a sustainable travel plan that aimed to reduce car commuting by 20% (Department of Transport, 2009). Some success has been achieved in this area with an increase in cycling in the Dublin but with limited success outside of Dublin (Caulfield, 2014). However, the GDA has a number of problems that were the product of the recent housing boom and as a result the newer housing stock in the GDA tends to have poor public transport access and residents have longer commuting times (Caulfield and Ahern, 2014).
Telecommuting or working from home has been a policy that has been mostly overlooked in Ireland. Given the nature of the low density housing stock in Dublin and the extensive costs in constructing large scale large new public transport systems in the GDA (Caulfield et al, 2013); the research presented in this paper seeks to determine what benefits a policy of working from home could have in the GDA. The research presented in this paper demonstrates the rates of working from home in the GDA and the travel time saved and economic benefits of working from home.
2. Literature Review
Several authors have demonstrated the environmental benefits of telecommuting. Schwanen et al (2011) acknowledge that improvements in technology such as video conferencing, has made the option of telecommuting much more convenient. Henderson and Mokhtarian (1996) conducted pioneering work in this area, measuring the environmental benefits of telecommuting in the Puget Sound region and demonstrated substantial environmental benefits. Mokhtarian and Varma (1998) also found similar reductions in emissions with up to a 21% reduction in carbon dioxide emissions in the study undertaken. Other studies have sought to examine the impacts of telecommuting in relation to distance-travelled reductions. Choo et al (2006) demonstrate that while the distance distance-travelled reductions related to telecommuting in the United States are modest, they can be in some cases be comparable to public transport ridership and as such present a cost efficient means to reduce overall distance travelled. Other studies have examined the potential of telecommuting as a means to reduce energy consumption, in terms of transportation energy, and have shown the ability of this policy to reduce overall energy consumption in the transport sector (Fu et al, 2012; Noland et al, 2006).
Dissanayake and Morikawa (2008) examined the potential impacts of introducing a system of satellite based telecommuting centres on the periphery of cities in the developing world. The results from the analysis conducted showed that vehicle kilometres travelled and thus emissions could be reduced if a system of satellite based telecommuting centres were constructed.
The impacts that information and communications technology (ICT) would have on transportation patterns have been discussed extensively and Golob and Regan (2001) were stern in their view that the advent of ICT was the single biggest revolution to hit the transport sector since the automobile. Therefore it is unsurprising how many studies have sought to determine the relationships between ICT usage and telecommuting and how this is changing our travel patterns (Ren and Kwan, 2009; Calderwood and Freathy, 2014). Alexander et al (2010) found that usage of ICT had a greater impact upon the decision to have a more flexible working schedule than traditional socio-economic factors. This concept is further explored by Alexander and Dijst (2012) as they postulate that profession has a large impact upon the ability to have flexible working arrangements and work at least one day of the week from home. The research presented in this paper presents a case study of working from home in the GDA
3. Methodology and Data
3.1 Data
The data used in this study comes from the 2011 census of Ireland. This dataset is called Place of Work, School or College – Census of Anonymised Records or POWSCAR (CSO,
2011). The 2011 census was conducted on the night of the 10th April 2011. The POWSCAR
dataset contains data on almost 2.8 million people and if they were in education or employment how they travelled to their place of education or employment. The variables taken from the POWCAR dataset are described in Table 1.
The POWCAR dataset was supplemented with a number of other data sources to
determine what factors impact upon the rates of working from home in the GDA. This was
conducted, as the POWCAR data doesn’t contain information on a number of characteristics considered to be important in the probability that an individual would work from home. Each of these variables are related to the areas and not to the households specifically. Meaning that for example while a household is in an area with for example with a high concentration of broadband Internet coverage, it doesn’t mean that this household has a broadband Internet connection. In other words these variables are used as a proxy to measure phenomenon such as the chances of a household having a broadband connection as the specific household data is not available.
variables used to estimate the deprivation index. In the study area the deprivation score takes values ranging from -28 (most deprived areas) to 3 (least deprived areas).
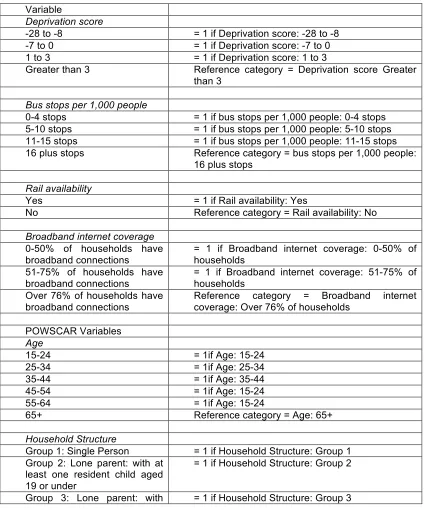
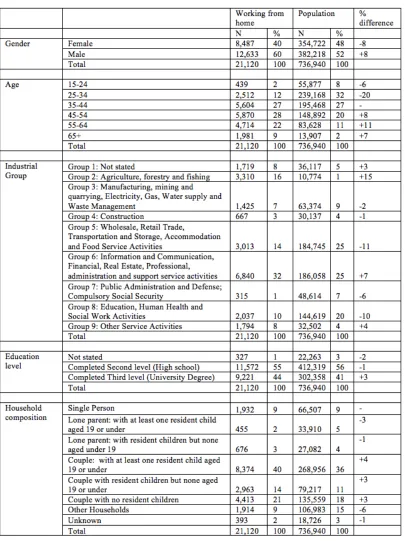
[image:3.595.108.532.258.768.2]Proximity to public transport is also examined to determine if it has an impact upon the decision to work from home. The first set of variables relates to bus availability. This variable is measured in the number of bus stops per 1,000 in each are examined. The rail availability variable takes a binary value in relation to if rail was available or not. The final variable that is related to the area that the individual lives in is broadband Internet coverage. As the POWCAR data does not contain information if a household has a broadband Internet connection data was used that has the average number of households in area with a broadband connection. This data is related to the electoral district and is the percentage of households in that area with a broadband connection, as seen in Table 1 this falls into three categories.
Table 1 Description of variables examined
Variable
Deprivation score
-28 to -8 = 1 if Deprivation score: -28 to -8
-7 to 0 = 1 if Deprivation score: -7 to 0
1 to 3 = 1 if Deprivation score: 1 to 3
Greater than 3 Reference category = Deprivation score Greater
than 3
Bus stops per 1,000 people
0-4 stops = 1 if bus stops per 1,000 people: 0-4 stops
5-10 stops = 1 if bus stops per 1,000 people: 5-10 stops
11-15 stops = 1 if bus stops per 1,000 people: 11-15 stops
16 plus stops Reference category = bus stops per 1,000 people:
16 plus stops
Rail availability
Yes = 1 if Rail availability: Yes
No Reference category = Rail availability: No
Broadband internet coverage
0-50% of households have broadband connections
= 1 if Broadband internet coverage: 0-50% of households
51-75% of households have broadband connections
= 1 if Broadband internet coverage: 51-75% of households
Over 76% of households have broadband connections
Reference category = Broadband internet coverage: Over 76% of households
POWSCAR Variables
Age
15-24 = 1if Age: 15-24
25-34 = 1if Age: 25-34
35-44 = 1if Age: 35-44
45-54 = 1if Age: 15-24
55-64 = 1if Age: 15-24
65+ Reference category = Age: 65+
Household Structure
Group 1: Single Person = 1 if Household Structure: Group 1
Group 2: Lone parent: with at least one resident child aged 19 or under
= 1 if Household Structure: Group 2
resident children but none aged under 19
Group 4: Couple: with at least one resident child aged 19 or under
= 1 if Household Structure: Group 4
Group 5: Couple with resident children but none aged 19 or under
= 1 if Household Structure: Group 5
Group 6: Couple with no resident children
= 1 if Household Structure: Group 6
Group 7: Other Households
Reference category = Household Structure: Group 7
Residential Density
Less than 2,000 people = 1 if Residential density: Less than 2,000 people
2,001 to 50,000 people = 1 if Residential density: 2,001 to 50,000 people
Over 50,000 people
Reference category = Residential density: Over 50,000 people
Car available
One = 1 if Car available: One
Two = 1 if Car available: Two
Three or more = 1 if Car available: Three or more
No car Reference category = Car available: No car
Industrial Group
Group 1: Not stated = 1 if Industrial Group: Group 1
Group 2: Agriculture, forestry and fishing
= 1 if Industrial Group: Group 2
Group 3: Manufacturing,
mining and quarrying,
Electricity, Gas, Water supply and Waste Management
= 1 if Industrial Group: Group 3
Group 4: Construction = 1 if Industrial Group: Group 4
Group 5: Wholesale, Retail
Trade, Transportation and
Storage, Accommodation and Food Service Activities
= 1 if Industrial Group: Group 5
Group 6: Information and
Communication, Financial,
Real Estate, Professional,
administration and support service activities
= 1 if Industrial Group: Group 6
Group 7: Public Administration
and Defense; Compulsory
Social Security
= 1 if Industrial Group: Group 7
Group 8: Education, Human
Health and Social Work
Activities
= 1 if Industrial Group: Group 8
Group 9: Other Service
Activities
Reference category = Industrial Group: Group 9
Education level
Highest level secondary level education
= 1 if Education: Highest level secondary level education
Highest level third level
education
3.2 Modelling Approach
This section of the paper describes the modelling approach used to examine the POWSCAR data and the supplemental data to determine what factors impact upon the probability of an individual living in an area with a high of individuals working from home. A multinomial logit regression model was used in this research to estimate these relationships. Three levels of working from home are examined in the model, the first level was areas with less than 2% of individuals working from home, the second level includes areas with 2-3% of individuals working from home and finally the third level represents areas with 3% or more of individuals working from home. The multinomial logit model takes the following functional form:
Equation 1
logit(p)
=
log
p
1−
p
=
a
+
β
I
+
γ
H
+
e
where p is the probability that event Y occurs (in the case of this study it is the probability
that someone lives in an area with a higher percentage of individuals working from home).
β
I
is the set of individual specific characteristics (these include education, age andoccupation etc.),
γ
H
is the set of household specific characteristics (these include publictransport availability, broadband Internet coverage and household structure etc.). The results estimated from these models are presented in Table 4.
4. Results and analysis
4.1 Overview of those currently working from home
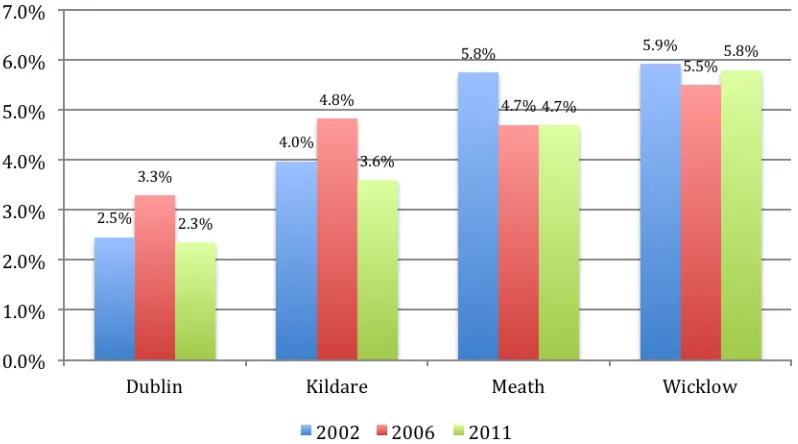
Figure 2 Percentages of individuals working from home 2002-2011
Table 3 Demographics of those working from home in the GDA
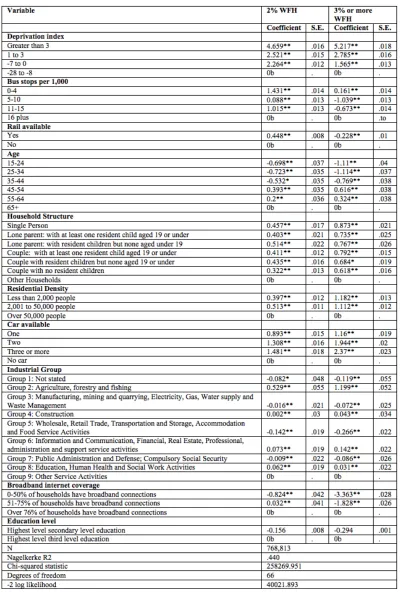
4.2 Multinomial logit model results
living in the second category are more likely to live in an affluent area compared to those in the first category. The next set of variables examines the impacts that access to public transport has upon the likelihood of working from home. The results show that those living in areas with 3% or more working from home are less likely to have good public transport access as they are more likely to have 0-4 bus stops per 1,000 people and not likely to have rail available in their area. In contrast those living in an area with 2% of individuals working from home are likely to have good bus availability and a rail option available.
The next set of variables examined relates to the age profile of those in the different areas and the household structure. The results for the age profiles show that those in areas with high levels of individuals working from home are likely to be in the 45-54 and 55-64 age categories. Household structure is examined in the model to determine what impacts it has upon working from home, the results show that single people and those couples with children under the age 19 were most likely to live in an area with the highest percentage of individuals working from home. The results for the residential density variables shows that areas with the highest levels of working from home were most likely to have low population densities.
The results for the numbers of cars available show that those living in the areas with the highest proportions of those working from home were shown to be most likely to have multiple cars per household. The results for the industrial group show, as one would expect, that those in Group 2 (Agriculture, forestry and fishing) were most likely to live in an area with a high percentage of individuals working from home. The results for industrial group also show that those working in Group 6 (Information and Communication, Financial, Real Estate, Professional, administration and support service activities) were also most likely to live in an area with a high percentage of individuals working from home. The variables that measure broadband Internet coverage rates show, as one might expect, individuals living in areas with higher percentages of those working from home were least likely to live in areas with lower broadband Internet coverage. Finally the education variables show that those with higher levels of education were shown to be most likely to live in areas with higher levels of people working from home.
Table 4 Results of the multinomial logit model
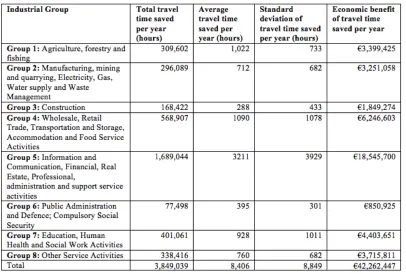
4.3 Commute savings for travel to work
a proxy for the potential travel time for each of those currently working from home. As no travel time is recorded for those working from home it was decided to use other individuals living in the same electoral district and in the same industrial grouping as a proxy for a potential journey time. To estimate this proxy travel time for those working from home the average travel time for each of the eight industrial groups was estimated across the 690 electoral districts in the GDA. It was important to estimate the average travel time by electoral district as it gives the best proxy for a travel time for those that work from home. The average travel time by electoral district and industrial grouping was then calculated and the average travel time in hours for each industrial grouping is presented in Table 5. It should be noted that this is just a proxy for travel time and is the best possible estimate for a potential travel time for those working from home.
The average travel time saved is calculated by multiplying the average travel time by the average 215 working days per year. This approach is also used in McNamara and Caulfield (2011). This then gives the average travel time saving per year. Table 5 also presents the standard deviation of the travel time saving per year. The average annual travel time saving is then multiplied by the numbers of individuals in each industrial group that indicated they work from home to estimate the overall travel time saving. The results shows that those working from home have saved approximately 3.8 million hours of travel time in the GDA. The total travel time saving is then multiplied by the value of travel time in
Ireland (€10.98) (NRA, 2011) to estimate the economic benefit from working from home.
The results show that working from home has an economic benefit, using only travel time
Table 5 The economic and time benefits of working from home
5. Conclusions
Appendix A: Composition of Deprivation Index
[image:14.595.97.476.172.430.2]This section of the paper describes the variables used in the calculation of the deprivation index. For further information on this index pleases see Haase and Pratschke (2012). The deprivation index is comprised variables that can be classified into three categories and are shown in the graph below.
Figure 3 Deprivation Index: Source (Haase and Pratschke, 2012)
References:
Alexander, B., Dijst, M. Professional workers @ work: importance of work activities for electronic and face-to-face communications in the Netherlands. Transportation, 2012, 39, pp 919-940
Alexander, B., Dijst, M., Ettema, D. Working from 9 to 6? An analysis of in-home and out-of-home working schedules. Transportation, 2010, 37, pp 505–523
Calderwood, E., Freathy, P. Consumer mobility in the Scottish isles: The impact of the Internet adoption upon retail travel patterns. Transportation Research Part A. 2014, 59, pp 192-203.
Caulfield., B., Re-cycling a city - examining the growth of cycling in Dublin, Transportation
Research Part A: Policy and Practice, 61, 2014, p216 - 226
Caulfield, B., Bailey, D., Mullarkey, S., Using Data Envelopment Analysis as a public
transport project appraisal tool, Transport Policy, 29, 2013, p74 - 85
Caulfield, B. An examination of the factors that impact upon multiple vehicle ownership: The
case of Dublin, Ireland, Transport Policy, 19, 2012, p132 – 138
Caulfield, B., Ahern, A., The Green Fields of Ireland: The Legacy of Dublin's Housing Boom
and the Impact on Commuting, Case Studies on Transport Policy, 2, (1), 2014, p20 – 27
Central Statistics Office. Census of Ireland, 2011, Dublin
Department of Transport. Smarter Travel: A New Transport Policy for Ireland 2009–2020. DoT, Dublin.
Dissanayake, D., Morikawa, T. Impact of satellite centre-based telecommuting on travel and air quality in developing countries by exploring the link between travel behaviour and urban
form. Transportation Research Part A: Policy and Practice, 42, 6, 2008, pp 883-894
Fu, M., Kelly, A., Clinch, P., King, F. Environmental policy implications of working from home: Modelling the impacts of land-use, infrastructure and socio-demographics. Energy Policy, 2012, 47, pp 416-423
Golob, T, F., Regan, A, C. Impacts of information technology on personal travel and commercial vehicle operations: research challenges and opportunities. Transportation Research Part C, 2001, 9, pp 87-121.
Haase, T., Pratschke, J. The 2011 Pobal HP Deprivation Index for Small Areas. 2012. Dublin.
McNamara, D., Caulfield, B. , Determining the welfare effects of introducing a cap-and-share
scheme on rural commuters, Transportation Research Part D: Transport and Environment,
16, 2011, p547 - 553
Mokhtarian, P., Varma, K. The trade-off between trips and distance travelled in analysing the emissions impacts of centre-based telecommuting. Transportation Research Part D: Transport and the Environment, 3, 6, 1988, pp 419-428
National Roads Authority, Project Appraisal Guidelines, 2011, NRA, Dublin
Noland, R. B., Cowart, W.A., Fulton, L.M. Travel demand policies for saving oil during a supply emergency. Energy Policy, 2006, 34, pp 2994-3005.
Henderson, D., Mokhtarian, P. Impacts of centre-based telecommuting on travel and
emissions: Analysis of the Puget Sound Demonstration Project. Transportation Research
Part D: Transport and Environment, 1, 1, 1996, pp 29-45
Ren, F., Kwan, M. The impact of the Internet on human activity-travel patterns: analysis of gender differences using multi-group structural equation models. Journal of Transport Geography, 2009, 17, pp 440-450.
Schwanen, T., Banister, D., Anable, J. Scientific research about climate change mitigation in
transport: A critical review. Transportation Research Part A: Policy and Practice, 45, 10,