87
Evaluation and Improvement of Chatbot Text Classification Data Quality
Using Plausible Negative Examples
Kit Kuksenok jobpal Ltd. Berlin, Germany [email protected]
Andriy Martyniv jobpal Ltd. Berlin, Germany [email protected]
Abstract
We describe and validate a metric for estimat-ing multi-class classifier performance based on cross-validation and adapted for improve-ment of small, unbalanced natural-language datasets used in chatbot design. Our expe-riences draw upon building recruitment chat-bots that mediate communication between job-seekers and recruiters by exposing the ML/NLP dataset to the recruiting team. Eval-uation approaches must be understandable to various stakeholders, and useful for improving chatbot performance. The metric, nex-cv, uses negative examples in the evaluation of text classification, and fulfils three require-ments. First, it is actionable: it can be used by non-developer staff. Second, it is not overly optimistic compared to human ratings, mak-ing it a fast method for comparmak-ing classifiers. Third, it allows model-agnostic comparison, making it useful for comparing systems de-spite implementation differences. We vali-date the metric based on seven recruitment-domain datasets in English and German over the course of one year.
1 Introduction
Smart conversational agents are increasingly used across business domains (Jain et al.,2018). We focus on recruitment chatbots that connect re-cruiters and job-seekers. The recruiter teams we work with are motivated by reasons of scale and accessibility to build and maintain chatbots that provide answers to frequently asked questions (FAQs) based on ML/NLP datasets. Our enter-prise clients may have up to100Kemployees, and commensurate hiring rate. We have found that al-most 50% of end-user (job-seeker) traffic occurs outside of working hours (Liu, 2019), which is consistent with the anecdotal reports of our clients that using the chatbot helped reduce email and ticket inquiries of common FAQs. The usefulness
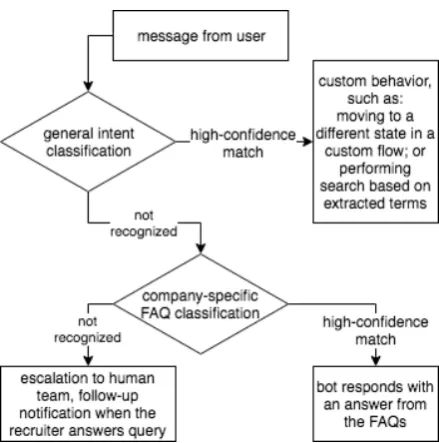
of these question-answering conversational UIs depends on building and maintaining the ML/NLP components used in the overall flow (see Fig.1).
In practice, the use of NLP does not improve the experience of many chatbots (Pereira and D´ıaz, 2018), which is unsurprising. Although
transparency(being “honest and transparent when explaining why something doesn’t work”) is a core design recommendation (DialogFlow,2018), the most commonly available higher-level plat-forms (Canonico and De Russis,2018) do not pro-vide robust ways to understand error and commu-nicate its implications. Interpretability is a chal-lenge beyond chatbots, and is a prerequisite for trust in both individual predictions and the over-all model (Ribeiro et al.,2016). The development of thenex-cvmetric was driven by a need for a quantification useful to developers, as well as both vendor and client non-developer staff.
The nex-cv metric uses plausible negative
examples to perform actionable, model-agnostic evaluation of text classification as a component in a chatbot system. It was developed, validated, and used at jobpal, a recruiting chatbot company, in projects where a client company’s recruiting team trains and maintains a semi-automated conversa-tional agent’s question-answering dataset. Use of ML and NLP is subject to conversation flow design considerations, and internal and external transparency needs (Kuksenok and Praß, 2019). The chatbots do not generate answers, but provide all responses from a bank that can be managed by client staff. Each of about a dozen live chatbots answers about70%of incoming questions without having to defer to a human for an answer. About two thirds of the automated guesses are confirmed by recruiters; the rest are corrected (Fig.3).
Figure 1: Each incoming message from an end-user is subject to (1) a general intent classifier specific to a language; and, if none of the roughly 20 intents are the recognized, (2) a company-specific FAQ classifier. Custom flow affects the specifics of this behavior.
metric and provide its application and data con-text of use. In “Validation Datasets”, we describe the datasets with which this metric has been val-idated. In “Validation”, we provide results from experiments conducted while developing and us-ing the metric for over a year, addressus-ing each of the needs of the metric, which make it a useful tool for multiple stakeholders in the chatbot design and maintenance process.
1. enable data quality improvements (Fig.4)
2. not be overly-optimistic (Fig.5)
3. enable model-agnostic comparison (Fig.6)
We contribute a metric definition, its validation with six real projects over the course of one year (2018.Q2 through 2019.Q1), as well as an exten-sible implementation1 and testing plan, which is described in “Metric Definition” below.
2 Background
Chatbots, or “text messaging-based conversa-tional agents”, have received particular attention in 2010s (Jain et al.,2018). Many modern text-based chatbots use relatively simple NLP tools (Abdul-Kader and Woods,2015), or avoid ML/NLP alto-gether (Pereira and D´ıaz,2018), relying on
conver-1http://github.com/jobpal/nex-cv
sation flow design and non-NLP inputs like but-tons and quick-replies. Conversational natural-language interfaces for question-answering have an extensive history, which distinguishes open-domain and closed-open-domain systems (Mishra and Jain, 2016). ML-based chatbots rely on cu-rated data to provide examples for classes (com-monly, “intents”), and must balance being widely-accessible to many end-users, but typically spe-cialized in the domain and application goal (Ser-ban et al., 2015). In practice, design and devel-opment of a chatbot might assume a domain more focused, or different, than real use reveals.
In the chatbot application context, the training dataset of a text classifier may be modified to im-prove that classifier’s performance. The classes — “intents” — are trained with synthetic data and constituteanticipated, rather than actual, use. Ex-isting general-purpose platforms include this syn-thetic data step as part of design and mainte-nance (Canonico and De Russis, 2018). For ex-ample, when it comes to invocations for a voice agent (Ali et al., 2018), dataset construction en-codes findings about how users might imagine asking for some action: the authors use a crowd-sourcing mechanism to achieve both consistency useful for classification, and reflection of user expectations in the dataset. We adopt a simi-lar approach: enabling domain-experts (recruiters) to maintain the dataset helps map end-user (job-seeker) needs to recruiters’ goals.
Data cleaning is not only relevant to chatbots. Model-agnostic systems for understanding chine learning can help iteratively develop ma-chine learning models (Zhang et al.,2019). De-velopers tend to overlook data quality in favor of focusing on algorithmic improvements in building ML systems (Patel et al.,2008). Feature engineer-ing can be made accessible to non-developers or domain experts, e.g. (Ribeiro et al., 2016). We make use of representative examples in the process that surfaces nex-cv to non-developers; in de-scribing this process in “Metric Application”, we map it to the inspection-explanation-refinement
process employed in (Zhang et al., 2019). En-abling non-developers to perform data cleaning ef-fectively allows developers to focus on model ad-justments and feature engineering.
D´ıaz, 2018). Static analysis and formal verifica-tion may be used with a specified flow (Porfirio et al.,2018). User behavior measurements — both explicit, like ratings or feedback, and implicit, like timing or sentiment — are explored in (Hung et al.,2009). During metric development, we used qualitative feedback from domain-expert users, and key performance indicators (KPIs), such as automatic response rate. Regardless of overall evaluation approach, the use of a classifier as a component in a complex flow demands robust and actionable evaluation of that component.
3 Approach
The nex-cv algorithm selects some classes as plausible sources of negative examples, and then uses those to partition the given dataset into train-ing and test data (Alg.1). Negative examples are useful in chatbot component evaluation: the end-user interaction with a chatbot is open-ended, so the system is expected to encounter input that it should recognize as outside its domain.
Low-membership classes are candidates for be-ing ignored in trainbe-ing and used as negative ex-amples in testing. Two mutually-exclusive varia-tions use theK parameter for cutoff-based nega-tive example selection (Alg.2); and theP param-eter for proportional negative example selection (Alg.2). We focus on three settings, with(K, P)
set to (0,0), (0,0.15), and (5,0). The values were tuned for typical distributions (see “Valida-tion Datasets”), and the(0,0)is a validating mea-sure that is comparable to5-fold CV (see “Metric Definition”).
We assume that low-population classes are all in the same domain as the rest. There may be excep-tions: in some cases a new, small category may be created in response to new questions on an emer-gent topic well outside of the core domain. In our experience, this happens when there is a technical issue elsewhere on the site and the chatbot chan-nel is used as an alternative to escalate the issue. In practice, our system handles this case well, even if the evaluation is less applicable. Such emergent categories either disappear over time: the topic is temporary; or grow: the topic becomes part of the domain.
3.1 System Overview
A chatbot (Fig.2) is based on two datasets (Fig.1), each maintained using a data management tool
Result:(Xtrain, ytrain, Xtest, ytest)
Require dataX, ys.t. xiis the input text that
has gold standard labelyi∀i;
Require label setsLSM, LLGs.t.
LSM∪LLG={yi|y}Require test fraction
0< t <1and functionsplitt(L)which
randomly splits out two listsL1, L2s.t.
|L2|
|L| =tandL1∪L2 =L;
forLj ∈LLGdo
T R, T S=splitt(i|yi ∈y∧yi ==L);
Xtrain, ytrain ←xi, yis.t.i∈T R;
T R, T S=splitt(i|yi ∈y∧yi ==L);
Xtest, ytest←xi, yis.t.i∈T S; end
T RL, T SL=splitt({j|yj ∈LSM});
Xtrain, ytrain ←xi, yis.t.yi ∈T RL;
Xtest, ytest←xi,Øs.t. yi∈T SL;
Algorithm 1:Negative Example Data Provision
(Fig. 3). Traffic varies widely between projects, but is typically consistent within a project. To pro-vide a range: in one quarter in 2018, the high-est traffic chatbot had about2000active users, of which about250(ca. 12%) asked questions. The lowest-traffic chatbot saw˜65weekly active users, of which 15 (ca. 23%) asked questions. In both cases, a small number (2-4) of recruiters were re-sponsible for maintaining the dataset.
The training set of the FAQ portion of each project contains between 1K and 12K training examples across between 100 and 200 distinct classes, usually starting with about50−70classes and creating new classes after the system goes live and new, unanticipated user needs are en-countered. To build classifiers on datasets of this size, we use spaCy (Honnibal and Montani,2017) and fastText (Bojanowski et al.,2016) for vector-ization, with transformation for improved perfor-mance (Arora et al.,2016), and logistic regression with L2 regularization (Pedregosa et al.,2011).
The dataset for shared general intentsis main-tained through the data management tool byjobpal
staff. One such classifier is shared by all compa-nies that use a particular language; projects span English, German, Chinese, and French. About20
profes-Figure 2: Here, the job-seeker’s question receives an immediate answer, based on the ML/NLP classifier. If confidence is too low, chatbot will defer to a human.
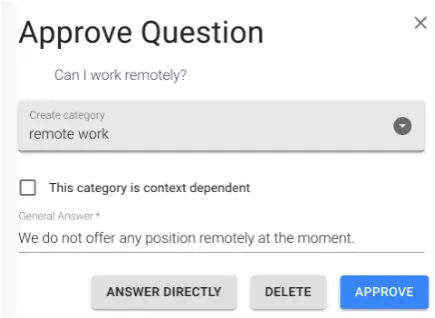
Figure 3: Even if the chatbot responds, recruiters can use a data management tool to review the answer.
sion and city of interest to job-seekers; for exam-ple, statements like ‘I want a [profession] job in [city]‘ and ‘do you have any [profession] open-ings?’ should all resolve to ‘job search’ along with extracted keywords. Lastly, this classifier also identifies very common questions that affect all chatbots2, but which are not in the recruitment domain: e.g., ‘how are you?’ and ‘is this a robot?’. The dialog in Fig. 2shows the FAQ functional-ity of the chatbots, powered by classification using company-specific FAQ datasets (see also Fig. 1).
2
This was another outcome of the case study summarized in Fig.4: we identified four categories of questions that we could anticipate in all projects, but that were not in the ex-pert domain of the FAQ, so we made modifications to the flow, the way the existing classifiers were used, and the gen-eral intents training data, to help keep company-specific FAQ datasets more focused.
[image:4.595.71.289.319.478.2]In most projects, users who ask question ask be-tween 1 and 2 questions. The FAQ functionality is typically an addition to any existing informa-tion displays. Many of our chatbots also feature job discovery, including search and subscriptions. Job search may be triggered by clicking on the button [Look for a job], or writing some-thing like “I would like a[profession]job in
[location]” at almost any point in the flow. If either of location or profession is not specified, the user is prompted, and the responses are used to search current openings, which are then shown. The user may submit application or follow exter-nal links; the user may also ask questions about specific jobs or the employer more generally.
3.2 Metric Definition
The code available online3 provides the evalua-tion implementaevalua-tion, an abstract black-box defi-nition for a classifier, and two strategies to help test an implementation. For integration testing,
CustomClassifier.test()can be used to check consistency of classifier wrapper. For func-tional testing,nex-cvbothK = 0(Alg. 2) and P = 0(Alg. 2) should yield comparable results to5-fold cross-validation.
Result:LSM, LLG
Require dataX, ys.t. xiis the input text that
has gold standard labelyi∀i;
Require cutoff parameterK >0; LSM ={yi |yiiny, occurs< K};
LLG={yi|yi iny, occurs≥K};
Algorithm 2:Cutoff Selection of Plausible Neg-ative Example Classes
In k-fold cross-validation, data is partitioned intoksets of(Xtrain, ytrain, Xtest, ytest)such that
|Xtest|
|Xtrain| = 1/k(let the test fractiont= 1/k), and the training sets do not overlap. Then, each set of training data is evaluated using the correspond-ing test set. Evaluation can include many possible measures: accuracy or F1; representative exam-ples; confusion matrix; timing data; etc.
Innex-cv, test fractiontis a setting (0.2for all reported experiments), and data partitions may overlap. As shown in Alg. 1, representation of high-population classes is enforced. Then, low-population classes are also split using t, and in-cluded either in the training set with their ground
Result:LSM, LLG
Require dataX, ys.t.xiis the input text that
has gold standard labelyi∀i;
Require proportion parameter0≤P <1; LSM ={};
LetQ={yi |yi ∈y}, as queue sorted from
least to most occurring inX;
while |{i|xi∈X∧yi∈LSM}|
|X| < P do
Pop elementLfromQ; LSM ←L;
end
LLG={yi|yiiny, not inLSM};
Algorithm 3:Proportional selection of Plausible Negative Example Classes
truth label; or in the test set as a negative ex-ample. In practice, this results in about t of the data being in training. Some low-population classes in the training set should be included as this is representative of the dataset shape; many low-population classes may affect the classifica-tion and confidence overall, depending on classifi-cation approach. Low-population classes are typ-ically rare or relatively recent topics, so interpret-ing them as plausible negative examples helps to test the classifier, and its measure of confidence.
3.3 Validation Datasets
The seven datasets to which we report having ap-plied the nex-cv metric are in the recruitment domain. Each dataset has about50−200classes, and most have classes with 5-10 members as well as classes with over a hundred. To characterize the content, we trained a classifier on an anony-mous benchmark dataset4 and used it to classify a random recent sample of6K English-language questions.
About 25% of recent end-user queries in En-glish fall into 5 categories: (1) Application Pro-cess; (2) Salary; (3) Professional Growth and
De-4
The clean, anonymized recruitment-domain-specific dataset in English was built by anonymizing and aggregat-ing all FAQ datasets; usaggregat-ing pairwise similarity between cate-gories to group them. For an initial clustering, we used Jac-card index with a minimum of0.09, which balanced the goals of high coverage of example data (74) and reasonable sizes of classes (15examples per class); then, this dataset was sub-ject to iterative data quality improvements as described fur-ther and exemplified in Fig.4until a final set of about800
[image:5.595.311.524.64.380.2]examples over about47categories was developed. This ini-tial domain-specific clustering was performed on English, but has since been extended to other supported languages; the re-sults reported are specific to English, however.
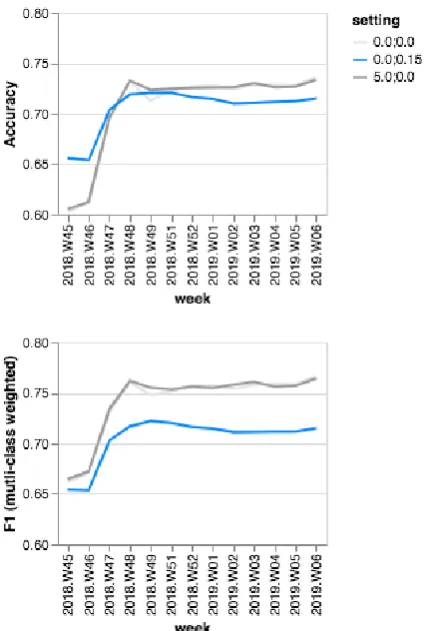
Figure 4: Change in classifier performance as a re-sult of data quality intervention. Averages of daily 10-retry evaluations shown.
velopment; (4) Internships; (5) Contact a Human. Another 25% of end-user queries fall into 14
categories: Application Evaluation; Application Deadline; Application Delete or Modify; How Long to Apply and Hear Back; Qualification; Application Documents; Language Expectations; Thesis; Working Hours; Location; Starting at the Company; Commute; Equipment; Benefits.
as plausible negative examples takes advantage of both the content of the data (closed-domain, with a topic-specific core but a considerable number of additional, outlying topics) and the membership distribution of the classes (a few well-populated ones, and many much smaller classes).
The nex-cv metric may apply in other prob-lems or domains, but we developed and validated it in a series of experiments with six live datasets, in English and German (see Fig.5, of which chat-bot E is also the subject of Fig. 4), in addition to the seventh aggregate anonymous benchmark dataset described above, which was used for the comparison in Fig.6.
4 Validation
The following case studies validate the metric rel-ative to each of three requirements: (1) enable data quality improvements, as in Fig.4, (2) not be overly-optimistic, as in Fig.5, (3) enable model-agnostic comparison, as in Fig.6.
4.1 Metric Application
The goal of usefulness includes interpretability: “provid[ing] qualitative understanding between the input variables and the response... [taking] into account the users limitations in (Ribeiro et al., 2016). Usefulness combines this with actionable support of chatbot design. The users include, in this case, non-developer staff on both vendor and client side: recruiters and project managers.
Through iteration on internal tools, we found that displaying performance information in the form of, “which 2-3 topics are the biggest prob-lem?” was most effective for understanding, com-munication, and action. Over the course of a year, thenex-cv metric informed this analysis. Dur-ing this time, both qualitative feedback and KPIs have validated that it was effective both for trust and for the end-user experience. Theautomation rate KPI — proportion of incoming queries that did not need deferral to a human, but answered immediately, as in Fig. 2— has risen to and re-mained at70−75%across projects mainly5due to data quality support during both design and main-tenance.
5
The data training UI design contributes to data quality; in the months following the intervention shown in Fig.4, the UI was redesigned to address outstanding usability prob-lems, with very positive feedback from domain-expert users. A more in-depth discussion of the role of human factors in human-in-the-loop systems is out of scope for this paper.
In one illustrative project (Fig. 4) the automa-tion rate had become as low as40%. The recruiters responsible for dealing with escalated questions became frustrated to see questions come up that had been asked before. Action needed to be taken, and this project became one of the first case studies for developing the application of nex-cv inter-nally. After intervention, automated response rate rose into the desirable 70s range and remained. The quality improvements were explained and im-plemented by an internal project manager, who pro-actively included client domain-expert users in explanations over calls and emails over what improvements were made and why. Initially, 200
classes were trained with 1Kexamples, with long tail of low-population classes. Following interven-tion, dataset grew by 25% and, despite concept drift risk, did not deteriorate.
To use nex-cv, we aggregate the confusion matrix from theK= 0;P = 0.15setting and rank how confused a pair of categories is. The most confused 2-3 pairs of classes are then the focus of conceptual, manual review in the dataset. Evalu-ation is performed again, producing a new rank-ing that guides the next 2-3 classes to focus on, until the metric falls below an acceptable thresh-old. There are other sources of classification error, but overlap between conceptually related pairs of classes accounts for most of the data quality prob-lems we encounter in the datasets in practice, and are particularly understandable than other forms of error. This relatively simple approach is imple-mented as a Jupyter notebook accessible to non-developers (internal project managers).
Figure 5:Comparison ofnex-cvand Human-Rater Accuracy. The six datasets from pseudonymous chatbots tested had a different number of questions (examples) and categories (classes), as shown in the bottom row. The human-rater estimate of accuracy (top left, blue) is consistently more lenient than any of the automated measures (top right). The(0; 0.15)setting (top right, blue) is not consistently more or less optimistic than the other settings.
[image:7.595.77.518.464.716.2]by project managers to monitor and prioritize data quality improvement tasks.
4.2 Metric is not Overly Optimistic
One of the practical motivations for a new metric was the sense that the existing metrics were too optimistic to be useful to improve chatbot behav-ior in response to overall qualitative feedback. As shown in Fig.4, for example, the typicalF1metric is more optimistic thannex-cv.
As an initial step of validating the metric, we applied it in the case of six under-performing datasets that required some intervention. Fig. 4 shows the differences in data abundance and classifier quality across these six pseudonymized snapshots. Internal QA staff gave the human rating scores by considering whether a question-answer pairs seemed reasonable: they could pick “yes” “no” and “can’t tell”; in most cases, the appropri-ateness was not ambiguous. As shown in Fig.5, the human-rater estimate of quality is consistently more lenient than any of the automated measures. The Chatbot E in this case is the same project as shown in Fig.4, prior to improvements.
Four of the six datasets analyzed had a very big difference between the human estimate of quality and the automated estimate, which, upon inves-tigation, revealed that there were significant con-ceptual overlaps in the classes that the recruiters had trained, and the answers given. So, indeed, the classifier was making surprisingly adequate guesses, but which were very low-confidence. Fol-lowing the intervention described in the previous section, which includes ongoing communication of any outstanding problems by project managers to recruiter teams, this type of error became rare and quickly-addressed.
4.3 Metric can be used for Internal and External Comparison
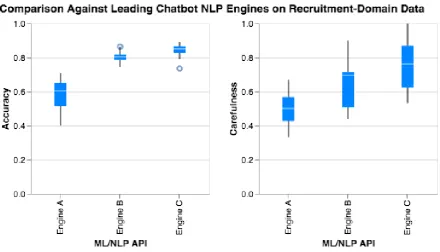
We used thenex-cvmetric to help compare the performance of our classification component with two leading vendors for general-purpose chatbot development. Fig. 6 shows the comparison be-tweenjobpaland 2 leading vendors in the space. The three settings of the metric6were aggregated to provide a plausible range of estimated per-formance. The range of accuracy was signifi-cantly higher for our domain-specific classifier, than those trained using general-purpose tools.
6Where(K, P)are(0,0),(0,0.15), and(5,0), respec-tively, as differentiated in both Fig.4and Fig.5.
Aside from being useful to classify into known classes, the metric must account for fallback or es-calation. This may be modeled as a separate class (as one of the external engines does with the “fall-back” intent), or by relying on confidence scores from classifiers that produce measures of dence (all engines provide some estimate of confi-dence that may be used). The “carefulness” score was included to represent how useful the confi-dence score is for deciding when to decline an an-swer: the number of incorrect guesses that were rejected due to too-low confidence scores divided by total no-answer-given cases (no guess or low-confidence guess).
Fig. 6 shows that the performance of our ML/NLP component on our domain-specific dataset is better than that of two popular general-purpose platforms, both in terms of classifica-tion accuracy, and rate of deferral due to low-confidence answers. This comparison mechanism validates our system relative to existing external services in a way that is interpretable by various internal stakeholders, not only the developer staff.
5 Conclusion
We described and validated the nex-cvmetric, which is a modification of cross-validation that makes use of plausible negative examples from low-population classes in the datasets typical of our application area and domain.
Existing chatbot guidelines leave error handling to the designer: “transparency” is included as an important topic (DialogFlow,2018), but, in prac-tice, why something does not work, and under what conditions, can puzzle designers and devel-opers, not just end-users. We presented on a metric that can be used by a variety of relevant stakehold-ers to undstakehold-erstand, communicate, and improve text classifier performance by improving data quality.
In future work, we aim to explore other text classifier and chatbot evaluation strategies, keep-ing in mind the needs for understandability and transparency in this multi-stakeholder design pro-cess and maintenance practice.
References
Abdullah X Ali, Meredith Ringel Morris, and Jacob O Wobbrock. 2018. Crowdsourcing similarity judg-ments for agreement analysis in end-user elicitation studies. In The 31st Annual ACM Symposium on User Interface Software and Technology, pages 177– 188. ACM.
Sanjeev Arora, Yingyu Liang, and Tengyu Ma. 2016. A simple but tough-to-beat baseline for sentence em-beddings.
Piotr Bojanowski, Edouard Grave, Armand Joulin, and Tomas Mikolov. 2016. Enriching word vec-tors with subword information. arXiv preprint arXiv:1607.04606.
Massimo Canonico and Luigi De Russis. 2018. A com-parison and critique of natural language understand-ing tools.Cloud Computing 2018, page 120.
DialogFlow. 2018. Dialogflow design guide-lines. conversational components - error han-dling. designguidelines.withgoogle.com/ conversation/conversational-components/ er-rors.html. Accessed: 2018-09-02.
Matthew Honnibal and Ines Montani. 2017. spacy 2: Natural language understanding with bloom embed-dings, convolutional neural networks and incremen-tal parsing. To appear.
Victor Hung, Miguel Elvir, Avelino Gonzalez, and Ronald DeMara. 2009. Towards a method for eval-uating naturalness in conversational dialog systems. InSystems, Man and Cybernetics, 2009. SMC 2009. IEEE International Conference on, pages 1236– 1241. IEEE.
Mohit Jain, Pratyush Kumar, Ramachandra Kota, and Shwetak N Patel. 2018. Evaluating and informing the design of chatbots. InProceedings of the 2018 on Designing Interactive Systems Conference 2018, pages 895–906. ACM.
Kit Kuksenok and Nina Praß. 2019. Transparency in maintenance of recruitment chatbots.arXiv preprint arXiv:1905.03640.
Karolina Kuligowska. 2015. Commercial chatbot: per-formance evaluation, usability metrics and quality standards of embodied conversational agents.
Ching-Ju Liu. 2019. Behind the screen: When do applicants approach you? https://jobpal.ai/en/blog/when-do-applicants-approach-you/. Accessed: 2019-05-01.
Amit Mishra and Sanjay Kumar Jain. 2016. A survey on question answering systems with classification.
Journal of King Saud University-Computer and In-formation Sciences, 28(3):345–361.
Kayur Patel, James Fogarty, James A Landay, and Bev-erly L Harrison. 2008. Examining difficulties soft-ware developers encounter in the adoption of statis-tical machine learning. InAAAI, pages 1563–1566.
F. Pedregosa, G. Varoquaux, A. Gramfort, V. Michel, B. Thirion, O. Grisel, M. Blondel, P. Pretten-hofer, R. Weiss, V. Dubourg, J. Vanderplas, A. Pas-sos, D. Cournapeau, M. Brucher, M. Perrot, and E. Duchesnay. 2011. Scikit-learn: Machine learning in Python. Journal of Machine Learning Research, 12:2825–2830.
Juanan Pereira and Oscar D´ıaz. 2018. A quality analy-sis of facebook messenger’s most popular chatbots. InProceedings of the 33rd Annual ACM Symposium on Applied Computing, pages 2144–2150. ACM.
David Porfirio, Allison Saupp´e, Aws Albarghouthi, and Bilge Mutlu. 2018. Authoring and verifying human-robot interactions. In The 31st Annual ACM Sym-posium on User Interface Software and Technology, pages 75–86. ACM.
Marco Tulio Ribeiro, Sameer Singh, and Carlos Guestrin. 2016. Why should i trust you?: Explain-ing the predictions of any classifier. In Proceed-ings of the 22nd ACM SIGKDD international con-ference on knowledge discovery and data mining, pages 1135–1144. ACM.
Iulian Vlad Serban, Ryan Lowe, Peter Henderson, Lau-rent Charlin, and Joelle Pineau. 2015. A survey of available corpora for building data-driven dialogue systems. arXiv preprint arXiv:1512.05742.