Multi-Stage Novice Defensive Driver Training Program:
Does It Create Overconfidence?
Jessica Mueller, Laura Stanley, Kezia Manlove Western Transportation Institute, Montana State University, Bozeman, USA
Email: [email protected]
Received September 18, 2012; revised October 29, 2012; accepted November 10, 2012
ABSTRACT
Multi-stage training programs have been recommended to transfer knowledge and skills to high-risk novice drivers. However, some have suggested there is a link between skill training and an increased crash probability due to overcon- fidence. This project evaluates the outcomes of a multi-phase training system and compares the performance of novice drivers who received second-stage training with that of a control group of novice drivers who received traditional, sin- gle-stage training. This trained group and an equivalent group of untrained novice drivers completed annual surveys describing their involvement with traffic citations, near-miss crashes, single-vehicle crashes, and multiple-vehicle crashes. Citation records from the Department of Motor Vehicles were also analyzed. An overdispersed Poisson model was used to compare driver behaviors for the trained and untrained groups after accounting for known confounders like gender and exposure. We were able to detect a significant increase in DMV citation rates for trained drivers in the first year after training. Furthermore, in the last two years of the study, we found evidence that trained drivers began to per- form substantially better than their untrained peers, in near-miss crashes. The results of this study support literature suggesting a link between skill training and an increased crash probability due to overconfidence, but suggest that after the first year of driving experience, the training begins to pay dividends, with trained drivers performing better than their untrained peers. This trade-off of short-term consequences versus long-term benefits merits further investigation. We suggest that instruction designed to increase technical vehicle-handling skills in conjunction with modules focusing on hazard identification and risk perception may offset any effects of increased confidence in the trained group that this and past studies have found.
Keywords: Novice Driver Training; Skill-Based Training; Novice Driver Safety; Driver Overconfidence; Multi-Stage Driver Training
1. Introduction
In the United States, roadway crashes take the lives of approximately 40,000 people and seriously injure another three million each year. Traffic fatalities are the leading cause of death nationwide for those between three and 34 years of age [1]. Studies have shown that the primary cause of traffic crashes among teen novice drivers is driver error, most commonly due to a driver’s failure or inability to scan the roadway to correctly perceive ha- zards [2]. It is well known that the highest crash risk among young drivers occurs over the first months and miles of driving when drivers are the most inexperienced and unskilled [3].
While research has struggled to find clear evidence that traditional high school driver education programs have a positive impact on safe driving, the hope is that emerging and future driver education programs will build upon the lessons learned from the traditional approaches to driver education. Some experts have recommended a
multi-stage training approach in which the traditional training is later supplemented by a carefully designed advanced training program. This study evaluates the ef- fect of such a program, using participant crash data over the four years following the driver training.
1.1. Historical Driver Training Methods
believe defensive vehicle handling workshops conducted in addition to the traditional driver education program may be effective in reducing teen crashes in their first months of driving. This multi-stage approach to driver training is recommended by the National Highway Tra- ffic Safety Administration (NHTSA) [9] and American Driver and Traffic Safety Education Association (ADT- SEA) [10]. ADTSEA recommends a first stage to pro- mote basic vehicle handling skills and introduce the con- cepts of hazard perception, decision-making, risk-tak- ing, and driver impairment, while a second stage would focus on driving behaviors that reduce crash likelihood.
While there is considerable anecdotal evidence that such training creates a more skilled and capable novice driver when coupled with the standard driver instruction, few systematic studies of the effect of multi-modal driver- training programs on the safety of young drivers have been completed. Michigan’s graduated licensing program uses a multi-stage driver education program, which has resulted in safety benefits [11]. Because the implemen- tation of Michigan’s two-stage program resulted in a delayed age for licensure (1.3 months), the specific sa- fety benefit of the two-staged education program has not yet been independently studied from the effect of the increased age of licensure.
In this study, the first stage was the novice drivers’ high school driver education courses. The second-stage supplementary training provided to the trained group fo- cused on safe driving practices involving awareness, per- ception, and hazard identification.
1.2. Prior Research on Skill-Based Training and the Overconfidence Issue
Studies of the effects of driver training programs do not consistently show increased or decreased performance. One of the first studies that tried to quantify the benefits of driver training using random group assignment was the DeKalb study, which compared students who had no driver education training with students who received high school driver education training or an enhanced driver training program and found that the participants who had either received high school driver education or the en- hanced driver training program had fewer crashes than the untrained group in the first six months of driving [12]. One research group [13] re-evaluated the DeKalb study data and reached the conclusion that driver education failed to produce a reduction in crash and violation rates among novice drivers.
Besides age and experience, other factors contributing to the novice driver’s crash involvement include lack of knowledge, traffic insight and risk awareness [14] as well as poor vehicle-handling skills [15] when compared with more experienced drivers. Mitigation of all of these fac-
tors has been attempted through different types of no- vice-driver training involving skill-based training, risk awareness, or a combination of the two. Skill training fo- cuses on aspects of controlling a vehicle in various si- tuations and has shown mixed results. Skid-car skill trai- ning results have not all been positive, however. Some skid-car skill training studies have shown higher crash involvement among the drivers trained [16], whereas others showed no difference in crash involvement but did show higher overconfidence (overestimation of knowledge, underestimated risks, and/or exaggeration of their ability to control the vehicle) among skid-car-trained groups [17]. This study assessed whether skid-car skill training was associated with differences in both the short- and long- term subsequent crash and conviction rates of trained teems, potentially due to overconfidence resulting from training.
2. Method
In 2005, 347 young drivers and their parents signed consent forms to participate in a study to evaluate the effectiveness of a driver-training program designed by the Montana Office of Public Instruction (OPI). The stu- dents were recruited from 15 different high schools in western and central Montana. Eligibility for participation required the student to have obtained a driver’s license prior to June 2005, and to have completed a formal driver education course within six months of June 2005. That course served as the first stage, introducing basic driving skills to the novice drivers. This group of novice drivers was randomly divided into two groups: a trained group (165 participants) that received the full multi-stage driver training program, and a control group (182 participants) that did not receive the second-stage training.
Following the completion of traditional driver educa- tion classes, both groups filled out identical surveys de- tailing driver demographic data, driving behavior, driv- ing exposure and crash history. The surveys collected data involving number and age of passengers, frequency of passengers, type of vehicle driven, time of day usually driven, and numbers and descriptions of traffic citations and warnings, near-miss crashes, single-vehicle crashes and multiple-vehicle crashes. Analysis of those prelimi- nary surveys showed no significant differences between the trained and control groups in age (µtrained = 16.0 years
old; µcontrol = 16.1 years old), driving exposure, or repor-
sample t-tests to see if any social desirability bias was affecting dropout rates, and consequently the study re- sults. No difference was shown between the dropout par- ticipants and those who completed the study in terms of age, driving experience, gender, or crash involvement at baseline. This equivalence suggests that there is no social desirability bias characteristic affecting dropout rates. These similarities of age, driving exposure, and reported crashes, paired with incorporation of gender as a pre- dictor in all analyses, allowed us to establish that the trained and control groups were sufficiently equivalent for the purposes of the study prior to receiving any study- related driver training.
2.1. Training Received
The trained group consisted of 165 students (49% male, 51% female). The group was divided into sets of 12 or fewer participants for each driver training session to better facilitate transporting participants to the facility and also to allow the recommended two students per in- structor during track-based exercises [18]. This ratio fa- cilitated individual discussion, feedback and attention from the driving instructors. There were four instructors involved in each training session, from a group of eight driving instructors. The instructors had between seven and 39 years of driver-training experience (μ = 22.8 years,
σ = 12.02 years). Training for each group took place in one-day sessions. The students were supplied with a packet of instruction-related materials and taken to the Driver In-Vehicle Education (DR.I.V.E.) facility opera- ted by OPI.
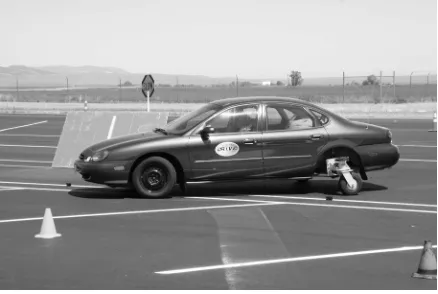
The students participated in a classroom session for two hours upon arrival at the facility, and again follow- ing a three-hour behind-the-wheel training session. The in-car exercises focused on skid control, targeting and reference points, evasive maneuvers and off-road reco- very. The vehicles used for training were three sedans equipped with skid-car technology, two sedans equipped with levers used by instructors to activate rear brakes, an unmodified sedan, and an unmodified sport utility vehi- cle (SUV). The activities in the Skid Monster (Figure 1) were designed to create situations where the students could explore and understand the benefits associated with early hazard detection, as well as the skills necessary to take corrective actions when late detection occurs. Fol- lowing training, instructors assessed the students regard-ing their performance in each drivregard-ing behavior category. Each category was rated by the instructor using work- sheets to measure the student’s performance on specific actions detailed in the Risk Reduction Zone Control Driving System [19].
2.2. Data Collection
[image:3.595.314.533.86.233.2]Driving history data was collected at yearly intervals in
Figure 1. Sedan equipped with skid monster.
2006, 2007, 2008 and 2009 from both the trained and control groups through surveys administered to the par- ticipants. Citation records from the Department of Motor Vehicles (DMV) were also retrieved. The surveys offer- ed self-reported information in categories that included driving exposure, number and type of citations collected, and number and descriptions of near-miss events, single- vehicle collisions, and multiple-vehicle collisions. Res- pondents were compensated $10.00 for their time in com- pleting the survey every year they participated. DMV data provided information about the number and type of citations received by each driver as recorded by the Mon- tana Department of Justice Motor Vehicle Division.
Comparison of self-reported survey citation counts and DMV-recorded citation counts for participants showed significantly higher rates of self-reported citations. Fol- low-up investigation showed that parking violations are not recorded in the DMV citation counts, but many par- ticipants recorded parking violations when asked about citations received. Since parking violations do not act as a reasonable response variable to measure driver perfor- mance, self-reported citation data was dismissed in favor of the more accurate DMV citation counts.
2.3. Data Analysis
We separately analyzed the effects of training on four count variables: DMV citations, near-miss crashes, sin- gle-vehicle crashes and multiple-vehicle crashes. A qua- si-Poisson regression model was fit for each response variable, with the response treated as a function of driver gender, year (treated as categorical), an indicator for train- ed/control status, and a trained/control—year interaction term, to account for differences in driver performance trajectories between trained and control participants over time. We also included hours driven per month as an offset term to account for driver “exposure”. We used the quasi-Poisson approach to appropriately rescale estima- ted coefficient standard errors and account for model overdispersion (which in this case likely arose through exclusion of some relevant but unknown or unavailable predictors) [20].
Although all results are derived from these quasi-Poisson models that incorporate individual road hours as an offset term and account for gender differences, for ease of interpretation we present the results here in terms of relative rates. Confidence intervals on rate ratios for all models were calculated using R’s contrast package [21] in tandem with the lme4 package. Although we did not formally adjust significance levels for multiple testing, we feel that this is reasonable because of the generally low power of our dataset (due to participant dropout in later years of the study and limited resources for sam- pling) to detect trends. Because low power makes de- tection of significant trends more difficult, we suspect that those results unusual enough to be detected as sig-
nificant, even in our relatively low-powered study, are likely due to actual differences in parametric relation- ships and are not spurious.
[image:4.595.61.538.485.725.2]3. Results
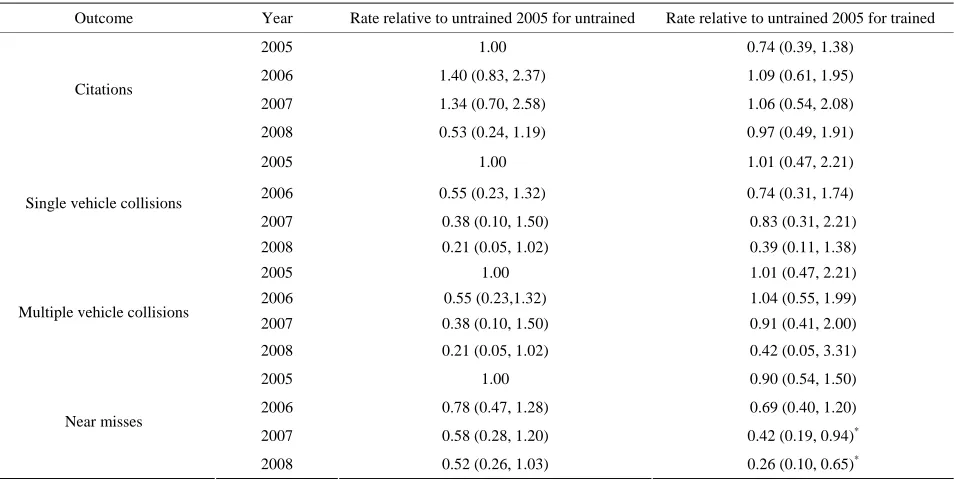
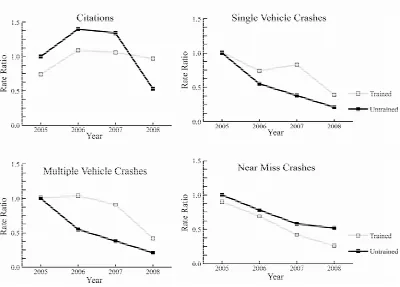
Table 1 shows the rate ratios comparing, for each out- come variable, trained teens to untrained teens at baseline (2005) and during each of the subsequent 3 years. Plots are shown in Figure 2.
3.1. DMV: Citations
After accounting for differences in gender and exposure, the model suggested that all drivers underwent an in- crease in citation rates from 2005 to 2006. No significant differences in citations were found between the trained and untrained group drivers, after accounting for gender and driver exposure.
3.2. Survey: Near-Miss Collisions
We saw significant declines in the near-miss rate in 2007 (42% of 2005 rate) and 2008 (26% of 2005 rate) for all drivers, but this decline was much more pronounced in the trained group (58% of 2005 rate in 2007 for untrained, vs. 42% for trained drivers in 2007; 52% of 2005 rate for untrained vs. 26% for trained in 2008). For untrained dri- vers, estimated violation rates showed less improvement than their trained counterparts, and did not suggest a statistically significant decline at the sample size examin- ed.
Table 1. Rate ratios with 95% CIs for all offense rates, relative to the rates of the 2005 untrained group.
Outcome Year Rate relative to untrained 2005 for untrained Rate relative to untrained 2005 for trained
2005 1.00 0.74 (0.39, 1.38)
2006 1.40 (0.83, 2.37) 1.09 (0.61, 1.95)
2007 1.34 (0.70, 2.58) 1.06 (0.54, 2.08)
Citations
2008 0.53 (0.24, 1.19) 0.97 (0.49, 1.91)
2005 1.00 1.01 (0.47, 2.21)
2006 0.55 (0.23, 1.32) 0.74 (0.31, 1.74)
2007 0.38 (0.10, 1.50) 0.83 (0.31, 2.21)
Single vehicle collisions
2008 0.21 (0.05, 1.02) 0.39 (0.11, 1.38)
2005 1.00 1.01 (0.47, 2.21)
2006 0.55 (0.23,1.32) 1.04 (0.55, 1.99)
2007 0.38 (0.10, 1.50) 0.91 (0.41, 2.00)
Multiple vehicle collisions
2008 0.21 (0.05, 1.02) 0.42 (0.05, 3.31)
2005 1.00 0.90 (0.54, 1.50)
2006 0.78 (0.47, 1.28) 0.69 (0.40, 1.20)
2007 0.58 (0.28, 1.20) 0.42 (0.19, 0.94)*
Near misses
2008 0.52 (0.26, 1.03) 0.26 (0.10, 0.65)*
*
Figure 2. Rate ratios for trained and untrained groups; Compared to untrained 2005 data; By event type.
3.3. Survey: Crashes
Crash categories examined in this study include single- vehicle crashes and multiple-vehicle crashes. Single-ve- hicle crashes are considered to involve only the parti- cipant’s vehicle and include events such as running off the road or striking a fixed object that result in physical contact between the vehicle and any other entity (pro- vided that entity is not another vehicle). Multiple-vehicle collisions are all collisions that involve the participant’s vehicle and another vehicle. Study of the frequency of types of multiple-vehicle collisions was not possible due to survey design; participants provided details about cra- shes in an unstructured format and the level of detail was highly variable.
No significant differences in single-vehicle collisions were found between trained and untrained group drivers after accounting for differences in gender and driver ex- posure. Individuals generally reported significantly fewer single-vehicle collisions in 2007 and 2008 than they did in 2005. While these results are not statistically signi- ficant in this study, the sample size available in the latter years of the study precludes detection of significant trends of the magnitude suggested by the data. No sig- nificant differences were found between trained and un- trained groups in terms of multiple-vehicle collisions for the first two years of the study. However, while the un- trained group showed significant decline in the number
of multiple-vehicle collisions from 2005 to 2007 (p = 0.0264), the trained group showed a significantly dif- ferent pattern: an increase in multiple-vehicle collisions in that same time period (p = 0.0204). No significant difference between genders was detected for multiple- vehicle collisions.
4. Discussion
this difference would become more significant (if not more pronounced). A driver education program in Michi- gan focusing on both classroom and behind-the-wheel instruction resulted in safety benefits [11], supporting the potential benefits of multi-modal driver training.
The use of skid cars in the driver training module si- mulated road conditions that commonly occur during we- stern Montana winters, in line with literature recommen- dations to tailor a program toward crash factors relevant to the novice drivers’ environment and road geometry [22]. Without a more direct visual data collection method, it is difficult to see the specific effect of this training on novice drivers in terms of the driver’s response relative to icy or wet road conditions. In this study, no relation- ship was found to indicate either an increased or de- creased crash rate for the trained drivers, perhaps due to survey structure, which did not specify road conditions at the time of crash or near-crash driving events (crash data was unavailable from DMV records).
The multi-stage driver training system enabled the sup- plementary course instructors to focus on advanced dri- ving skills (risk perception, hazard detection and ve- hicle handling) instead of dedicating the majority of instruction to basic driving skills. We found evidence indicating an increased safety effect over time in the trained group for near-miss crashes. Given the limited power of this study to detect improvements on a fine scale, as well as our use of self-reported survey data from participants for the number and descriptions of crashes they experienced, we anticipate that improvements for the trained group may exist on other metrics but were undetectable based on this design. Additionally, because the surveys were collected annually, it is possible that the respondents may have inaccurate recollections of dates or circumstances of the crashes. Another potential confoun- ding factor due to survey design was the lack of col- lection of individual licensure data. While unknown here, crash rates may have been impacted by the relative length of each participant’s driving experience and should be exa- mined in future studies. However, this did not appear to be a major issue for this study, given that the trained and untrained groups did not differ on their average driving exposure upon enrollment in the study. Future studies may wish to implement a shorter time period between surveys and to gather more structured information about each crash or near miss to establish the actions the driver used and specific road conditions at the time of the crash.
Future research efforts of this type could benefit from certain variations in the study design. One variation would ideally use naturalistic data collection to observe driv- ers in both groups and their natural reactions to specific types of vehicle situations that were emphasized during the training (slippery roads, sharp curves, loss of vehicle control). Instead of the Poisson models used in this
analysis, more robust survival-like modeling approa- ches could be performed with the inclusion of specific information such as dates of incidents in the data collec- tion method. Alternative future design suggestions inclu- de phone interviews, which permit the collection of de- tailed information necessary to complete a more compre- hensive analysis. If available, official DMV crash records would be preferred to reduce any self-reporting bias of crash data. Conducting surveys at six-month intervals, at least initially, instead of using a one-year data collection period, may help to better capture the length of time be- fore the training benefit is no longer discernible. This six-month interval would coincide better with the well- documented issue of higher novice-driver crash rates wi- thin six months of licensure.
5. Conclusion
We were able to detect a significant increase in DMV citation rates for trained drivers in the first year after training; however, in the last two years of the study, we found evidence that trained drivers began to perform substantially better than their untrained peers, in near- miss crashes. The results of this study support literature suggesting a link between skill training and an increased crash probability due to overconfidence, but suggest that after the first year of driving experience, the training begins to pay dividends, with trained drivers performing better than their untrained peers. This trade-off of short- term consequences versus long-term benefits merits fur- ther investigation. We suggest that instruction designed to increase technical vehicle-handling skills in conjun- ction with modules focusing on hazard identification and risk perception may offset any effects of increased confi- dence in the trained group that this and past studies have found.
6. Acknowledgments
Croghan and Ms. Briana Parker at the Western Trans- portation Institute for their assistance in collecting the participants’ driving records.
REFERENCES
[1] U. S. Department of Transportation, “2008 Overview Traffic Safety Fact Sheet,” National Highway Traffic Safety Administration, Washington DC, 2009.
[2] A. J. McKnight and A. S. McKnight, “Young Novice Drivers: Careless or Clueless?” Accident Analysis and Prevention, Vol. 35, No. 6, 2003, pp. 921-925.
doi:10.1016/S0001-4575(02)00100-8
[3] D. R. Mayhew, H. M. Simpson and A. Pak, “Changes in Collision Rates among Novice Drivers during the First Months of Driving,” Accident Analysis and Prevention, Vol. 35, No. 5, 2003, pp. 683-691.
doi:10.1016/S0001-4575(02)00047-7
[4] J. Bishop, K. Quinlan, D. Roeber and G. Van Ettin, “Driver Education and Training Forum, National Trans- portation Safety Board,” Journal of Accident Investiga- tion, Vol. 1, No. 1, 2005, pp. 37-44.
[5] K. Clinton and L. Lonero, “Guidelines for Evaluating Driver Education Programs,” AAA Foundation for Traf- fic Safety, Washington DC, 2006.
[6] D. R. Mayhew and H. M. Simpson, “Effectiveness and Role of Driver Education and Training in a Graduated Licensing System,” Traffic Injury Research Foundation, Ottawa, 1996.
[7] D. R. Mayhew and H. M. Simpson, “The Safety Value of Driver Education and Training,” Injury Prevention, Vol. 27, No. 3, 2002, pp. 401-424.
[8] D. R. Mayhew, H. M. Simpson, A. F. Williams and S. A. Ferguson, “Effectiveness and Role of Driver Education and Training in a Graduated Licensing System,” Journal of Public Health Policy, Vol. 19, No. 1, 1998, pp. 51-67. doi:10.2307/3343089
[9] National Highway Traffic Safety Administration (NHTSA), “Research Agenda for an Improved Novice Driver Edu- cation Program,” Report to Congress, US Department of Transportation, Washington DC, 1994.
[10] A. R. Robinson, “Objectives of Advanced Driver Educa- tion,” The ADTSEA Chronicle, Vol. 49, No. 1, 2001, pp. 31-33.
[11] J. T. Shope, L. J. Molnar, M. R. Elliot and P. F. Waller, “Graduated Driver Licensing in Michigan: Early Impact on Motor Vehicle Crashes Among 16-Year-Old Drivers,” Journal of American Medical Association, Vol. 286, No. 13, 2001, pp. 1593-1598. doi:10.1001/jama.286.13.1593
[12] J. R. Stock, J. K. Weaver, H. W. Ray, J. R. Brink and M. G. Sadof, “Evaluation of Safe Performance Secondary School Driver Education Curriculum Demonstration Pro- ject: Final Report,” National Highway Traffic Safety Administration, Washington DC, 1983.
[13] A. K. Lund, A. F. Williams and P. Zador, “High School Driver Education: Further Evaluation of the DeKalb County Study,” Accident Analysis and Prevention, Vol. 18, No. 4, 1986, pp. 349-357.
doi:10.1016/0001-4575(86)90048-5
[14] I. Engstrom, N. P. Gregersen, K. Hernetkoski, E. Kes- kinen and A. Nyberg, “Young Novice Drivers, Driver Education and Training—Literature Review,” VTI Report 491A, Swedish National Road and Transport Research Institute, 2003.
[15] T. Bjornskau and F. Sagberg, “What Do Novice Drivers Learn during Their First Months of Driving? Improved Handling Skills, or Improved Road User Interaction?” In: G. Underwood, Ed., Traffic and Transport Psychology, Theory and Application, Elsevier, Oxford, 2005, pp. 129- 139.
[16] B. Jones, “The Effectiveness of Skid-Car Training for Teenage Novice Drivers in Oregon,” The Chronicle, Oregon Department of Transportation, 1995.
[17] A. Katila, E. Keskinen, M. Hatakka and S. Laapotti, “Does Increased Confidence among Novice Drivers Im- ply a Decrease in Safety? The Effects of Skid Training on Slippery Road Accidents,” Accident Analysis and Pre- vention, Vol. 36, No. 4, 2004, pp. 543-550.
doi:10.1016/S0001-4575(03)00060-5
[18] N. Sanders, “The EU Advanced Project: Description and Analysis of Post-License Driver and Rider Training,” Fi-nal Report, CIECA, Amsterdam, 2003.
[19] F. R. Motolla, “Your Car Is a Monster: Ten Habits Will Keep It Caged,” Interactive Driving Systems, Inc., Cape May, 2003.
[20] A. Agresti, “An Introduction to Categorical Data Analy- sis,” 2nd Edition, John Wiley and Sons, Inc., Hoboken, 2007. doi:10.1002/0470114754
[21] M. Kuhn, S. Weston, J. Wing and J. Forester, “Contrast: A Collection of Contrast Methods,” 2011.
http://CRAN.R-project. org/package=contrast