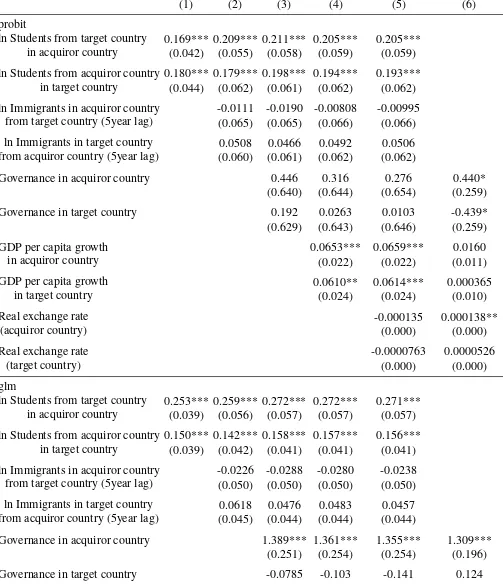
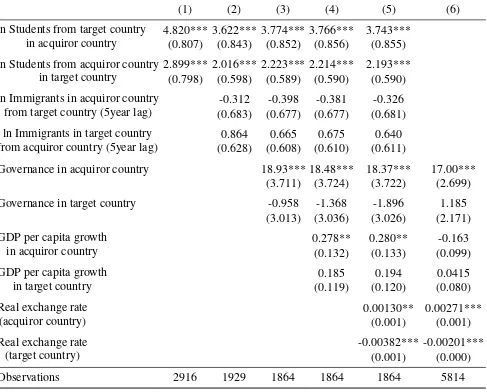
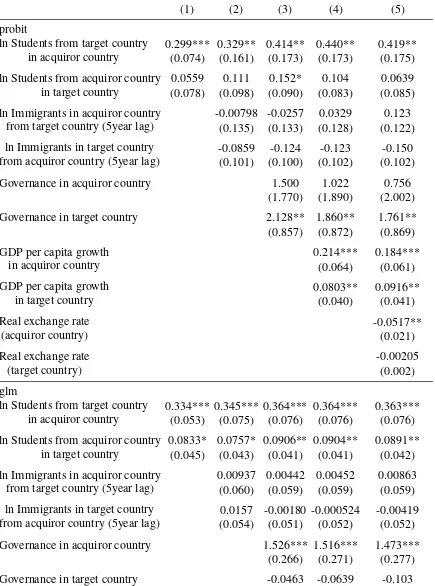
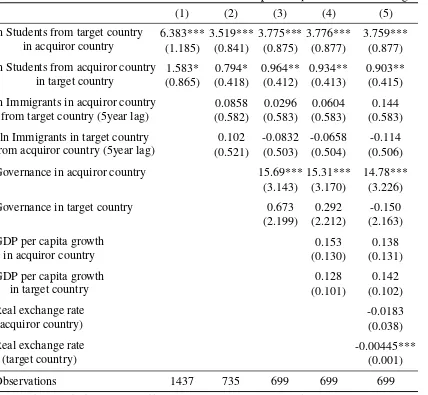
International human capital mobility and FDI: Evidence from G20 countries
Full text
Figure

Related documents
Hyperbolic Positioning with Proximate Multi-channel Pseudolite for Indoor Localization, IGNSS Symposium 2013, July, 2013, Yoshihiro Sakamoto, Hiroaki Arie, Takuji Ebinuma, Kenjirou
Marketing Management International Business Human Resource Management Project Management Mergers & Acquisitions Consumer Behavior Mergers & Acquisitions Consumer
From Table 6 and 7 above, it is statistically evident that at = 0.05 the varied spacings used for planting the trees in Chepkoilel and Nangili significantly affect the mean
With high-dimensional sparse contingency tables for which maximum likelihood estimation may not be computationally feasible, limited information estimators are often used
The main objective of international development policy as formulated by the MDGs is the eradication of extreme poverty. This implies that development co-operation
¾ International migration is a positive force for development, both in.. countries of origin and in countries of
Using the Minimum Night Flow measurements between 0200 and 0400 at the monitored point of figure 2 (b) in each group, the corresponding average leakage exponent N 1 is


