Munich Personal RePEc Archive
Speculate a lot
Tang, Chi Ho
Hong Kong Shue Yan University
1 January 2019
Online at
https://mpra.ub.uni-muenchen.de/94747/
1
Speculate a Lot
This version: January 2019
Abstract
While the residential and commercial property markets in Hong Kong are extensively
discussed, little attention is paid to the carpark market. This work contributes to fill the
research gap in three ways. First, it provides a simple empirical model to explain
carpark ratios in residential buildings. Second, it hand-collects transaction-level data
and constructs a price index for the carpark market in Hong Kong. Third, it shows that
changes in stamp duties increase the volatility in the carpark market. This research may
shed light to the current debate on the effectiveness of the stamp duty in stabilizing the
real estate market.
JEL classification number: G18, R14, R30
2
1. Introduction
Automobile is an indispensable component of the urban transportation in modern cities.
Therefore, to facilitate smooth flows of people, goods and services, the amount, as well
as the locations of carparks, are important choices for each city. Moreover, along with
the economic growth, usage of cars is expanding rapidly. It results in a continuously
growing demand for the carpark, which can be an issue as it would compete with other
land uses. For instance, in the United States, it has around 105 million to 2 billion
carparks, occupying 3,590 square miles of land.1 On average, eight parking spots are
built for a car. In ReThinking a Lot (2012), Ben-Joseph shows that parking lots cover
more than one-third of the land area, and they should be restructured for extending their
use for other purposes. In Australia, parking in Melbourne is an important concern of
residents and slogans are set up in the carparks calling for actions against multi-storey
development (Taylor, 2014). In short, city planners need to make a long-term forecast
of parking demand and design the optimal carpark ratio among different parts of a city.
This paper studies the carpark market in Hong Kong, which is well-known to be a
densely populated city with a high land price. In addition, Hong Kong has several
distinctive features which would facilitate our understanding of issues related to the
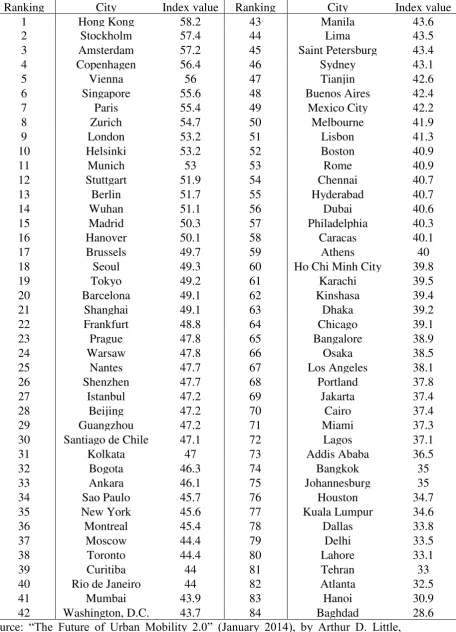
carpark. First, according to Van Audenhove et al. (2014), Hong Kong is ranked first in
terms of urban mobility index 2 (Table 1). Its well-established transportation
infrastructure allows almost 90% of residents to travel by public transport. On the
contrary, none of the U.S. cities was listed in the top 30, in which private cars remain
the most common mode of transport. In 2015, each Hong Kong household owned 0.3
private car on average, whereas the U.S. counterparts owned around 2 cars (Figure 1).
1 Source:
http://www.nytimes.com/2012/01/08/arts/design/taking-parking-lots-seriously-as-public-spaces.html
3
The sharp contrast in private car ownership ratio suggests that the demands of carpark
are totally different in two areas, and this paper can therefore complement existing
studies which focus on the case of the United States.
[Table 1 and Figure 1 are about here]
Second, Hong Kong is a mountainous terrain (Tse and Chan, 2003). As Figure 2a shows,
more than three-fourths of land is zoned for grassland, woodland and shrubland, and
the remaining portion was allocated for urban purposes. Together with the fact that the
boundary of Hong Kong is fixed by Basic Law (Leung and Tang, 2015a), it has three
important effects on the carpark market: (1) Unlike U.S., it is extravagant for Hong
Kong to allocate large pieces of land for carparks, especially in urban areas3. For those
idle sites, temporary outdoor carparks will be operated until the land is used for
constructing premises. (2) To make efficient use of land resources, carparks are usually
incorporated inside the high-rise residential buildings, office buildings and shopping
arcades. Unless government approval is provided, the number of parking spaces inside
the premises cannot be further extended later. (3) The growth of parking spaces is
slower than the growth of automobiles, leading to a severe shortage of parking spaces.
As Figure 2b shows, the ratio of carpark spaces to registered automobiles dropped from
1.32 in 2006 to 1.05 in 2016. It suggests that the current parking services cannot even
satisfy employees who drive back and forth to work. Under an excess carpark demand
and a frozen illegal parking penalty, the numbers of illegal parking between 2006 and
2015 doubled to 1,300,000 (Figure 2c).
[Figures 2a, 2b, and 2c are about here]
Third, private cars may be necessities among wealthy households living far from mass
transit stations, and hence their carpark demands are relatively inelastic. This creates
4
lasting shortages of parking spaces and expensive parking fees in Hong Kong. When
comparing to the parking fees in U.S. cities, Hong Kong parking service is the second
most expensive (Figure 2d). Parking lots are soon turned into investment vehicles
because of the continuous excess carpark demand, stable stream of rental income, low
entry barrier, inexpensive management fee and low maintenance cost. More
importantly, Hong Kong experiences continuing growth in terms of population and real
GDP per capita (Figure 2e), which makes the land shortage problem even more serious.
It is expected that these will be reflected by the surging carpark prices in the future.
[Figures 2d and 2e is about here]
Fourth, Hong Kong has a liquid and transparent real estate market protected by a
well-established legal system (Leung and Tang, 2013). Regarding the parking spaces of the
premises, it is well documented in the monthly digest of Buildings Department. The
parking capacity will not be affected by how closely the cars are parked together. In
addition, any real estate transactions require the signing of a sale and purchase
agreement by both seller and buyer. Land Registry is responsible to keep updated
information about the registered owner of the property. Therefore, our data is reliable
and timely for exploring the research questions.
This paper attempts to make several contributions to the existing literature. First, it
contributes to the empirical transportation economics. In the previous works,
researchers mainly focused on the usage patterns of the on-street parking and
multi-storey carpark (Ibeas er al, 2014; Amer and Chow, 2017; Pu et al., 2017). Residents in
detached houses of the United States tend to park at homes, while renters tend to live
in apartment buildings. In Hong Kong, most people, whether renters or
owner-occupiers, live in high-rise buildings, and thus developers have to strike a balance
between the number of carparks and housing units in their construction projects for
profit maximization (Lai and Wang, 1999; Leung and Tang, 2015b). Carparks offer
5
too much vacant parking spaces mean a waste of valuable floor areas.4 Therefore, our
analysis sheds lights on the role of carparks in real estate development and perhaps even
city planning.5 Second, this paper constructs a carpark index for Hong Kong.6 It
provides a valuable indicator for tenants, investors and government to make purchasing,
investment and policy decisions respectively. Our paper will also apply time series
techniques to uncover the inter-relationships between different asset markets. Last, but
not least, it relates to the studies of the volatility of asset markets. Leung et al. (2015)
found that property buyers in Hong Kong are likely to trade at the cutoff points of tax
schedule for tax avoidance, meaning that investors will react differently for a shift of
taxation regimes. Our paper will modify the GARCH model7 to show that
anti-speculative housing policies are catalysts for speculation in carpark market.
The rest of paper is organized as follows. In section 2, it runs a simple regression to
explain carpark ratios in residential developments. In section 3, it constructs a
weighted-average price index for measuring Hong Kong’s carpark market and performs
time series analysis. For section 4, it employs exponential GARCH-in-mean model to
explain the effect of stringent stamp duty arrangements on the volatility of the carpark
market. Concluding remarks will be made at the end.
2. Carpark ratio
As we have explained, the demand for carpark roots from the land scarcity. And since
the demand for carpark tends to be very local, meaning that people typically park their
cars within walking distance of their residence, it is necessary to first construct an index
to indicate the local scarcity of carpark. Our measure, the carpark ratio (CH_RATIO),
4 A growing body of literature have criticized the inefficiencies in forecasting parking spaces. Among others, see Manville (2013) and Guo and Ren (2013) for details.
5 See Taylor (2014) for an example in Melbourne.
6 Currently, Rating and Valuation Department provides price indexes for four kinds of premises, including residential buildings, offices, retail properties and industrial buildings.
6
is defined as the total number of carparks relative to the total number of housing units,
is of interest to several stakeholders. For tenants, they would like to ascertain that
sufficient parking spaces are available for their daily use; for developers, they have to
assign an optimal number of carparks in their construction projects; for speculators, the
carpark ratio relates to the tightness of the carpark market and sellers’ bargaining power
(Carrillo et al., 2015). Hence, this paper complements to the literature of economics of
parking through investigating the carpark ratio among 285 residential estates8 in Hong
Kong:
𝐶𝐻_𝑅𝐴𝑇𝐼𝑂 = 𝛾0 + 𝛾1𝑃𝑅𝐼𝑉𝐴𝑇𝐸 + 𝛾2𝑀𝑇𝑅 + 𝛾3𝐶𝐵𝐷 + 𝛾4𝐶𝐵𝐷2+ 𝛾5𝐾𝐿𝑁 + 𝛾6𝑁𝑇 + 𝜀 … (1)
The highlights of equation (1) are as follows. First, it proposes that carpark ratio will
be higher in private developments (PRIVATE), as wealthy families are more likely to
own their private cars for commuting. Second, it hypothesizes that residents living close
to mass transit station (MTR) will abandon using private cars and therefore carpark ratio
is reduced. Third, it follows Tse and Chan (2003) to model a nonlinear relationship
between carpark ratio and commuting time to the central business district (CBD). Last,
it introduces two locational dummies (KLN and NT) to investigate whether carpark ratio
differs significantly among different parts of Hong Kong. Our data comes from Rating
and Valuation Department, Housing Authority, Link REIT and Google Map. The
summary statistics are reported in Table 2.
[Table 2 is about here]
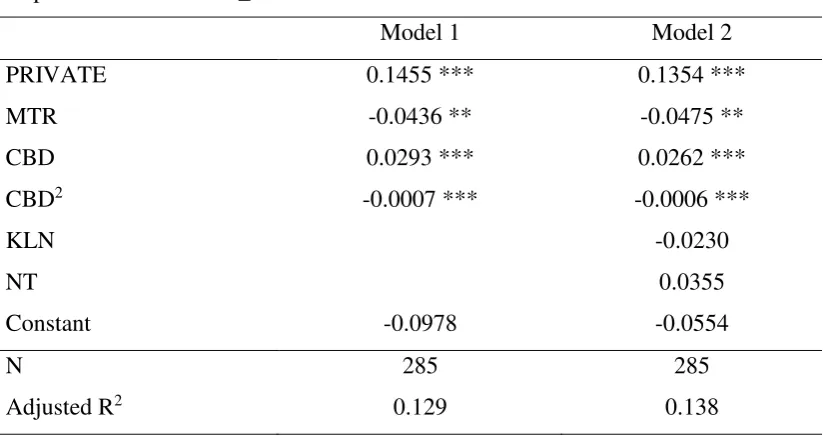
Our estimation results are reported in Table 3. Model 1 is a simpler version with the
exclusion of locational dummies. Not surprisingly, 𝛾1 is positive and significant at 1%
level. The carpark ratio of a private estate is 14.55% higher than that of a non-private
estate, other things being equal. In addition, 𝛾2 is negative and significant at 5% level.
If the residential estate is near the transit station, its carpark ratio is reduced by 4.36%.
7
More importantly, our paper suggests a nonlinear relationship between commuting time
and carpark ratio. On one hand, residential estates that are farther away from the central
business district will be equipped with a higher carpark ratio. On the other hand, such
a positive relationship will eventually die out, as residents living far away are usually
having a lower median income (Figure 3) and prefers using public transport. The
estimated coefficients 𝛾3 and 𝛾4 confirm this inverted U-shape relationship at 1%
significance level.
In model 2, it includes a complete list of regressors. Our empirical results are robust
that the estimated coefficients for 𝛾1, 𝛾2, 𝛾3 and 𝛾4 are significant and carry the
expected signs. The two locational dummies are insignificant, meaning that no
empirical evidence is found for a significant difference in carpark ratio among the
residential estates located at different parts of Hong Kong. Overall, our results provide
strong evidence that carpark ratio is explained by types of residential properties,
proximity to mass transit and commuting time to the central business district.
[Table 3 and Figure 3 are about here]
3. Carpark price index
While carpark investment is popular in Hong Kong, it is surprising that an official
carpark index is unavailable. Therefore, for measuring the performance of carpark
market, our paper constructs a carpark index (CP) by the weighted average method:
𝐶𝑃𝑡 =∑ 𝑁𝑈𝑀𝐵𝐸𝑅∑ 𝑁𝑈𝑀𝐵𝐸𝑅𝑖 ∗ 𝑃̅𝑖,𝑡
𝑖 … (2)
where
𝑁𝑈𝑀𝐵𝐸𝑅𝑖 is the carpark number in estate i;
8
As equation (2) shows, estates with higher carpark numbers have a greater impact on
the carpark index than those with lower carpark numbers. Moreover, the average
transacted carpark price for an estate in a given quarter is computed based on
transaction-level data9 from EPRC dataset. After construction of the carpark index, it
is deflated by consumer price index (A) to obtain real carpark index (RCP)10:
𝑅𝐶𝑃𝑡 =𝐶𝑃𝐼(𝐴)𝐶𝑃𝑡
𝑡 … (3)
For the sake of comparison, the real price indexes of the carpark and other asset markets,
rebased as 100 in 1999, are plotted in Figure 4. In 1997, the arrival of Asian Financial
Crisis resulted in a significant drop in the real asset prices. Some of the investors were
suffered from negative equity and declared bankruptcy (Leung and Tang, 2011).
Between 1999 and 2002, Hong Kong experienced a recession and the real asset prices
showed a similar downward trend. In 2003, Hong Kong got recovered from SARS
epidemic. Individual Visit Scheme was introduced in the same year, which allowed
visitors from the Mainland to visit Hong Kong on an individual basis. With the
expansion of the tourism industry, the retail sales and business environment kept
improving, which resulted in fast-paced growth in real retail and office prices (Chong
and Yiu, forthcoming). Since 2009, strong market sentiment existed in the housing
market and bubbles were found in real housing prices (Yiu et al., 2013). Given the
strong economic growth, carparks have been another popular kind of investment
vehicle and the real carpark index was catching up with the upward trend from 2012.
[Figure 4 is about here]
9
To further explore the inter-relationships between asset markets and the macroeconomy,
the paper follows Chang et al. (2013) to introduce real GDP, TED spread11 and TERM
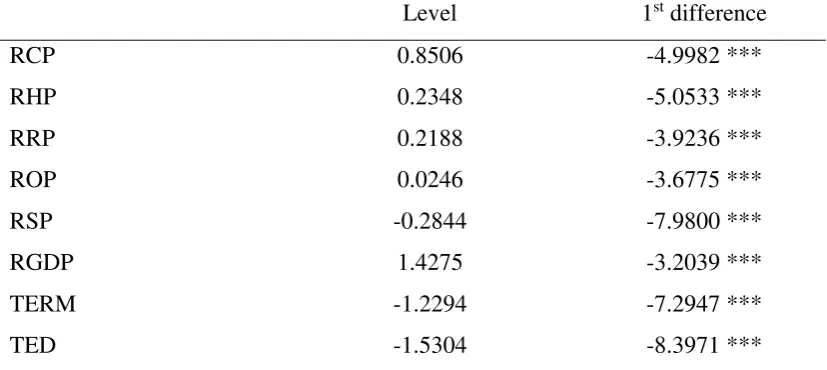
spread12 in the system (Table 4) and applies time series analysis. In the first step, it
performs the Augmented Dickey-Fuller test to check the stationarity of the series. It is
evident from Table 5 that the level series contains a unit root (i.e. non-stationary) while
the first-differenced series does not contain a unit root (i.e. stationary). In the second
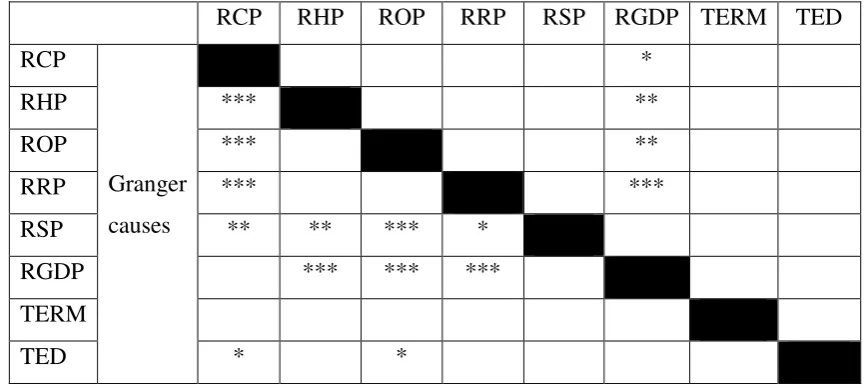
step, it runs the granger causality test13 on the first-differenced data. Several interesting
patterns are found in Table 6:
First, unidirectional causality runs from RHP to RCP at 1% significance level. As the
public transportation network is well-established in Hong Kong, residents can choose
to commute by public transport instead of private cars. Therefore, carparks are not a
must-have item for families. Under “housing comes first, car follows” scenario, it is
reasonable that previous change in real carpark prices cannot explain the current change
in real housing prices.
Second, RSP granger causes ROP at 1% significance level, RCP and RHP at 5%
significance level and RRP at 10% significance level. This confirms “wealth effect
hypothesis” (Case, Quigley and Shiller, 2005) that a rising wealth, created from the
surging value of stock portfolios, drives up property investments and results in rising
real property price indexes. It also coincides with the view that the performance of the
stock market is a leading indicator for predicting macroeconomy.
Third, bi-directional causality runs between output and property prices (except carpark).
On one hand, an economic boom strengthens investor confidence and triggers the
demand for housing, office and retail spaces. On the other hand, it supports “credit price
effect” (Kapopoulos and Siokis, 2005) that changes in property prices have significant
11 TED spread measures the perceived credit risk in the macroeconomy. It increases with the risk of default on interbank loans.
12 A positive TERM spread means the economy is doing well and long-term borrowing is rewarded more than short-term borrowing. When it is near zero, it suggests uncertainty of the economy.
10
implications on the borrowing capacity of households and firms, thus affecting the
consumption and investment plans in the economy.
Last, TED spread granger causes RCP at 10% significance level, but it does not granger
cause RHP. The intuition is simple. As Hong Kong has a well public transportation
system, the mode of commuting is more flexible, meaning that the carpark demand is
more elastic than the housing demand. So, when the TED spread widens, deterioration
of the credit environment induces households to cut the expenses on the private car first
and results in a decline in real carpark prices.
[Tables 4, 5 and 6 are about here]
4. Volatility of residential carpark market
In the previous section, we have constructed a carpark price index. This section would,
therefore, study the volatility of carpark market based on that index. Inspired by Wong
et al. (2006), who found that the volatility of real estate market is significantly driven
by government anti-speculation policies, our paper revisits similar research question
and hypothesizes that the adoption of extraordinary taxes on the housing market would
pose higher volatility on carpark market.
Considering a housing bubble from 2009Q414, the government introduced a series of
countercyclical housing policies, including special stamp duty (SSD) and double stamp
duty (DSD), to cool down the housing market. However, SSD and DSD brought
different effects to carpark market. SSD, introduced in 2010Q4, imposes an extra stamp
duty for those who resell the residential property within a short period of time (less than
3 years) but encourages investors looking for non-residential investments (e.g. carpark)
at the same time. DSD is effective from 2013Q1 and charges a higher rate for those
who transacted a second (“non self-occupied”) property. For example, an existing
11
homeowner has to pay DSD if he purchases a parking space. Hence, DSD targets to
reduce speculation activities and stabilize the real estate market.
To determine the effects of housing cooling measures on the volatility of the carpark
market, one standard approach is to use generalized autoregressive conditional
heteroskedasticity (GARCH) model (Bollerslev, 1986). The model suggests that the
conditional variance is explained by a weighted function of long-term average value,
information about volatility during previous period and the fitted variance from the
model during the previous period (Brooks, 2008). However, it encounters several
problems such as breaching non-negativity conditions, skipping the leverage effect and
ignoring the feedback effect between conditional variance and conditional mean.
Therefore, our paper adopts the exponential GARCH-in-mean model (Nelson, 1991;
Engle et al., 1987), with some modifications:
𝑟𝑡= 𝛽0+ 𝛽1𝑟𝑡−1+ 𝛽2𝑟𝑡−2+ 𝛽3𝑟𝑡−3+ 𝛽4𝑟𝑡−4+ 𝛽5𝑙𝑛(𝜎𝑡2) + 𝜀𝑡 … (4)
𝜀𝑡~𝑁(0, 𝜎𝑡2) … (5)
𝑙𝑛(𝜎𝑡2) = 𝛼0+ 𝛼1𝑙𝑛(𝜎𝑡−12 ) + 𝛼2 𝑢𝑡−1 √𝜎𝑡−12
+ 𝛼3|𝑢𝑡−1| √𝜎𝑡−12
+ 𝛼4𝐷1,𝑡+ 𝛼5𝐷2,𝑡 … (6)
where
D1 = 1 for the period from 2010Q4 – 2012Q4 (only special stamp duty is introduced);
D2 = 1 for the period from 2013Q1 – 2015Q4 (special stamp duty and double stamp
duty are introduced)
Equation (4) represents the conditional mean equation where the carpark market return
(𝑟𝑡) is explained by its four previous lags (𝑟𝑡−1, 𝑟𝑡−2, 𝑟𝑡−3, 𝑟𝑡−4) and natural logarithm
of contemporaneous conditional variance (𝑙𝑛(𝜎𝑡2)). If 𝛽5 is positive and statistically
significant, it suggests that a rise in conditional variance will result in an increase in
mean return. In other words, such a setting allows us to capture an idea that the investors
12
residual in conditional mean equation (𝜀𝑡) to be conditionally normally distributed with
mean zero and variance 𝜎𝑡2.
The conditional variance equation is expressed as equation (6). Several objectives are
achieved through its specifications. First, by incorporating the natural logarithm on
conditional variance, it avoids imposing non-negativity conditions on alphas. Second,
it allows us to account for the leverage effect. Specifically, if the relationship between
volatility and returns is negative, 𝛼2 will be negative and significant. Third, two dummy
variables are included in the conditional variance equation to capture the effect of
stringent stamp duty rules. If DSD promotes more carpark investments and SSD
discourages carpark speculation, we will expect 𝛼4 is positive and 𝛼4 > 𝛼5.
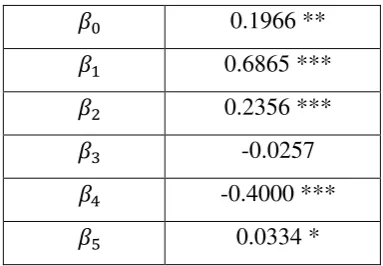
After estimating the EGARCH-in-mean model by the method of maximum likelihood,
the results are reported in Table 7. Regarding the conditional mean equation, the
coefficient of 𝛽5 is positive and 10% significant, thus confirming the finance theory
that investors will be rewarded for higher risks. For the conditional variance equation,
𝛼1 is significant at 5% level and has a value of 0.45, suggesting volatility in carpark
market is persistent to a certain extent. 𝛼2 is insignificant, thus leverage effect cannot
be found. More importantly, the coefficient of SSD dummy (𝛼4) is positive and
significant at 5% level, and 𝛼4 > 𝛼5 is found. On one hand, these confirm the
proposition that SSD switches funds from investing residential properties to
non-residential assets and rises the carpark market volatility since 2010Q4. On the other
hand, DSD dampens the speculation to all kinds of real estates effectively. Overall,
there is no statistical evidence that implementing SSD and DSD together can reduce
the volatility from 2013Q1 onwards (𝛼5is insignificant).
13
In summary, our results support the argument that the government tackles housing
issues in bits and pieces. When the housing bubble emerged in 2009Q4, the government
introduced SSD to cool down the housing market but failed to alert that speculative
funds, under a free capital market, will be reallocated to other real estate markets and
hence imposing greater volatilities to them. To minimize the negative consequences of
the “government intervention”, the government should take a long-term and
comprehensive view of the real estate market and carefully consider the effects of a
policy before it is launched.
5. Conclusion
Like many well-populated Asian cities, Hong Kong government has concentrated their
efforts on building an efficient public transportation network. The car ownership ratio
used to be low as well. Thus, shortages in carpark supply seem not to be an important
public concern. With continuous economic and population growth, however, the
carpark shortage becomes an increasingly important issue. For instance, Griffiths (2018)
reports that “Next time you're griping about having to feed coins into a parking meter, spare a thought for drivers in Hong Kong, where a single parking space has just sold
for $760,000.” Wu (2017) also writes that “Henderson Land Development… won a hotly contested auction on Tuesday, agreeing to pay a record HK$23.3 billion for a
commercial property site in the heart of Hong Kong’s central business district currently being used as a public car park…. European and U.S. financial firms, trying to cut costs, reduced their presence in the greater Central area by 146,000 square foot and 28,000
square foot respectively in the three-year period to March 2016, according to a
November report by property consultancy CBRE.” Obviously, carparks are now not
solely providing parking services but acting as an investment vehicle.
For a variety of reasons, Hong Kong’s carpark market is totally different from the U.S.
counterpart. This paper, therefore, takes an initial step to study the carpark ratio in
residential buildings, construct a carpark price index and investigate its volatility.
14
of residential properties, proximity to mass transit and commuting time to the central
business district. Second, “wealth effect” and “credit price effect” are observed in the
carpark market. Third, the countercyclical housing policies have a significant effect on
the volatility of the carpark market.
Our results have important implications for policymakers. While SSD aims to stabilize
the housing market by imposing an extra cost on speculation activities, funds, under a
free capital environment, can be easily switched to other asset markets. This results in
an increase in the volatility of carpark market. More importantly, because of a lack of
long term and comprehensive real estate policies, it was later found that these
extraordinary arrangements are shortsighted and could only cure the problem
temporarily. The overall asset market exuberated again and created greater bubbles,
thus the economy is exposing to greater risk (Tang, 2017). The government should
carefully consider the effects of a policy before it is launched.
For future research, it is suggested to investigate the rental carpark market. In particular,
we have already obtained three important elements of DiPasquale-Wheaton (1992)
model, including the carpark price (constructed in this paper), new construction and
total stock (obtained from Monthly Digest of Buildings Department). The only missing
element is the rental price. For completeness, future work may consider constructing
15
References
Amer, A. and Chow, J. Y. J. (2017). A down-turn on-street parking model with urban
truck delivery behavior. Transportation Research Part A: Policy and Practice, 102(C),
51-67.
Ben-Joseph, E. (2012). ReThinking a lot: The Design and Culture of Parking. MIT
Press.
Bollerslev, T. (1986). Generalized autoregressive conditional heteroskedasticity.
Journal of Econometrics, 31(3), 307-327.
Bollerslev, T. and J. M. Wooldridge (1992). Quasi-maximum likelihood estimation and
inference in dynamic models with time-varying covariances. Econometric Reviews,
11(2), 143-172.
Brooks, C. (2008). Introductory Econometrics for Finance. 2nd ed., Cambridge
University Press.
Carrillo, P. E., De Wit, E. R. and Larson, W. (2015). Can tightness in the housing
market help predict subsequent home price appreciation? Evidence from the United
States and Netherlands. Real Estate Economics, 43(3), 609-651.
Case, K. E., Quigley, J. M. and Shiller, R. J. (2005). Comparing wealth effects: The
stock market versus the residential property market. Advances in Macroeconomics,
5(1).
Chang, K. L., Chen, N. K. and Leung, C. K. Y. (2013). In the shadow of the United
States: The international transmission effect of asset returns. Pacific Economic
Review, 18(1), 1-40.
Chong, T. T. L. and Yiu, A. W. H. (forthcoming). Nexus between visitor arrivals and
residential property rents in Hong Kong. Pacific Economic Review.
DiPasquale, D. and Wheaton, W. C. (1992). The market of real estate assets and space:
A conceptual framework. Real Estate Economics, 20(2), 181-197.
Engle, R. F. (1982). Autoregressive conditional heteroskedasticity with estimates of the
variance of United Kingdom inflation. Econometrica, 50(4), 987-1007.
16
in the term structure: The ARCH-M model. Econometrica, 55(2), 391-407.
Granger, C. W. J. (1969). Investigating causal relations by econometric models and
cross-spectral methods. Econometrica, 37(3), 424-438.
Griffiths, J. (2018, June 6), Single 150 sq foot Hong Kong parking space sells for
$760,000. CNN. Retrieved from
https://www.cnn.com/travel/article/hong-kong-parking-space-intl/index.html
Guo, Z. and Ren, S. (2013). From minimum to maximum: Impact of the London
parking reform on residential parking supply from 2004 to 2010? Urban Studies,
50(6), 1183-1200.
Ibeas, A., dell’Olio, L., Bordagaray, M. and Ortuzar, J. (2014). Modelling parking
choices considering user heterogeneity. Transportation Research Part A: Policy and
Practice, 70, 41-49.
Kapopoulos, P. and Siokis, F. (2005). Stock and real estate prices in Greece: Wealth
versus “credit-price” effect. Applied Economics Letters, 12(2), 125-128.
Lai, N. and Wang, K. (1999). Land-supply restrictions, developer strategies and
housing policies: The case in Hong Kong. International Real Estate Review, 2(1),
143-159.
Leung, C. K. Y., Leong, Y. C. F. and Wong, S. K. (2006). Housing price dispersion:
An empirical investigation. Journal of Real Estate Finance and Economics, 32(3),
357-385.
Leung, C. K. Y., Cheung, P. W. Y. and Tang, E. C. H. (2013). Financial Crisis and the
Co-movements of Housing Sub-markets: Do Relationships Change After a Crisis?,
International Real Estate Review, 16(1), 68-118.
Leung, C. K. Y., Leung, T. C. and Tsang, K. P. (2015). Tax-driven bunching of housing
market transactions: The case of Hong Kong. International Real Estate Review,
18(4), 473-501.
Leung, Charles K. Y., and Tang, E. C. H. (2011). Comparing Two Financial Crises:
The Case of Hong Kong Housing Markets, in Global Housing Markets: Crises,
17
Leung, C. K. Y. and Tang, E. C. H. (2015a). Speculating Economic Growth through
Hong Kong? Evidence from Stock Market IPOs and Real Estate Markets,
International Real Estate Review, 18(1), 45-87.
Leung, C. K. Y. and Tang, E. C. H. (2015b). Availability, affordability and volatility:
The case of the Hong Kong housing market. International Real Estate Review, 18(3),
383-428.
Manville, M. (2013). Parking requirements and housing development. Journal of the
American Planning Association, 79(1), 49-66.
Nelson, D. B. (1991). Conditional heteroskedasticity in asset returns: A new approach.
Econometrica, 59(2), 347-370.
Pu, Z., Li, Z., Ash, J., Zhu, W. and Wang, Y. (2017). Evaluation of spatial heterogeneity
in the sensitivity of on-street parking occupancy to price change. Transportation
Research: Part C, 77, 67-79.
Tang, E. C. H. (2017). Real estate cycles and housing policies in Hong Kong, in
Business Cycles: External / Internal Causes, Economic Implications and Consumer
Misconceptions, published by Nova Science Publishers.
Taylor, E. (2014). “Fight the towers! Or kiss your car park goodbye”: How often do
residents assert car parking rights in Melbourne planning appeals? Planning Theory
& Practice, 15(3), 328-348.
Tse, C. Y., and A. W. H. Chan (2003). Estimating the commuting cost and commuting
time property price gradients. Regional Science and Urban Economics, 33(6),
745-767.
Van Audenhove, F. J., Korniichuk, O., Dauby, L. and Pourbaix, J. (2014). The Future
of Urban Mobility 2.0, published by Arthur D. Little.
Wong, S. K., C. Y. Yiu, M. K. S. Tse, and K. W. Chau (2006). Do the forward sales of
real estate stabilize spot prices? Journal of Real Estate Finance and Economics, 32(3),
289-304.
Wu, V. (2017, May 16), Henderson Land to pay record $3 billion for Hong Kong car
park site. Reuters. Retrieved from
property/henderson-land-to-pay-record-3-billion-for-hong-kong-car-park-site-18
idUSKCN18C1DM
Yiu, M. S., Yu, J. and Jin, L. (2013). Detecting bubbles in Hong Kong residential
19
Table 1 Urban Mobility Index
Ranking City Index value Ranking City Index value
1 Hong Kong 58.2 43 Manila 43.6
2 Stockholm 57.4 44 Lima 43.5
3 Amsterdam 57.2 45 Saint Petersburg 43.4
4 Copenhagen 56.4 46 Sydney 43.1
5 Vienna 56 47 Tianjin 42.6
6 Singapore 55.6 48 Buenos Aires 42.4
7 Paris 55.4 49 Mexico City 42.2
8 Zurich 54.7 50 Melbourne 41.9
9 London 53.2 51 Lisbon 41.3
10 Helsinki 53.2 52 Boston 40.9
11 Munich 53 53 Rome 40.9
12 Stuttgart 51.9 54 Chennai 40.7
13 Berlin 51.7 55 Hyderabad 40.7
14 Wuhan 51.1 56 Dubai 40.6
15 Madrid 50.3 57 Philadelphia 40.3
16 Hanover 50.1 58 Caracas 40.1
17 Brussels 49.7 59 Athens 40
18 Seoul 49.3 60 Ho Chi Minh City 39.8
19 Tokyo 49.2 61 Karachi 39.5
20 Barcelona 49.1 62 Kinshasa 39.4
21 Shanghai 49.1 63 Dhaka 39.2
22 Frankfurt 48.8 64 Chicago 39.1
23 Prague 47.8 65 Bangalore 38.9
24 Warsaw 47.8 66 Osaka 38.5
25 Nantes 47.7 67 Los Angeles 38.1
26 Shenzhen 47.7 68 Portland 37.8
27 Istanbul 47.2 69 Jakarta 37.4
28 Beijing 47.2 70 Cairo 37.4
29 Guangzhou 47.2 71 Miami 37.3
30 Santiago de Chile 47.1 72 Lagos 37.1
31 Kolkata 47 73 Addis Ababa 36.5
32 Bogota 46.3 74 Bangkok 35
33 Ankara 46.1 75 Johannesburg 35
34 Sao Paulo 45.7 76 Houston 34.7
35 New York 45.6 77 Kuala Lumpur 34.6
36 Montreal 45.4 78 Dallas 33.8
37 Moscow 44.4 79 Delhi 33.5
38 Toronto 44.4 80 Lahore 33.1
39 Curitiba 44 81 Tehran 33
40 Rio de Janeiro 44 82 Atlanta 32.5
41 Mumbai 43.9 83 Hanoi 30.9
42 Washington, D.C. 43.7 84 Baghdad 28.6
Source: “The Future of Urban Mobility 2.0” (January 2014), by Arthur D. Little,
20
Table 2 Summary statistics
Variable Definition Mean Standard deviation
CH_RATIO Ratio of carpark number to housing units 0.211 0.172
PRIVATE = 1 if it is private housing; 0 otherwise 0.211 0.409
MTR = 1 if it is within 500 meters walking
distance from Mass Transit, 0 otherwise.
0.320 0.467
CBD Travelling minutes to Central Business
District (by private car)
20.292 6.793
KLN = 1 if it locates in Kowloon, 0 otherwise 0.271 0.445
NT = 1 if it locates in New Territories, 0
otherwise
0.577 0.495
Table 3 Regression results
Dependent variable: CH_RATIO
Model 1 Model 2
PRIVATE 0.1455 *** 0.1354 ***
MTR -0.0436 ** -0.0475 **
CBD 0.0293 *** 0.0262 ***
CBD2 -0.0007 *** -0.0006 ***
KLN -0.0230
NT 0.0355
Constant -0.0978 -0.0554
N 285 285
Adjusted R2 0.129 0.138
[image:21.595.98.510.382.600.2]21
Table 4 List of variables in time series analysis
Sampling period: 1996Q1 – 2015Q4
Variable Definition Source
RCP Real carpark price index Author’s calculation
RHP Real housing price index Rating and Valuation Department
RRP Real retail price index Rating and Valuation Department
ROP Real office price index Rating and Valuation Department
RSP Real Hang Seng Index Hong Kong Exchanges and Clearing
Limited
RGDP Real gross domestic product Census and Statistics Department
TERM 10 year – 3 month Treasury yield spread U.S. Federal Reserve
TED 3 month LIBOR – 3 month Treasury yield
spread
U.S. Federal Reserve
Table 5 Unit root test
Level 1st difference
RCP 0.8506 -4.9982 ***
RHP 0.2348 -5.0533 ***
RRP 0.2188 -3.9236 ***
ROP 0.0246 -3.6775 ***
RSP -0.2844 -7.9800 ***
RGDP 1.4275 -3.2039 ***
TERM -1.2294 -7.2947 ***
TED -1.5304 -8.3971 ***
Note:The optimum lag is determined by AIC criteria at a maximum lag of 4 quarters.
[image:22.595.96.510.507.692.2]22
Table 6 Granger causality
RCP RHP ROP RRP RSP RGDP TERM TED
RCP
Granger
causes
*
RHP *** **
ROP *** **
RRP *** ***
RSP ** ** *** *
RGDP *** *** ***
TERM
TED * *
Notes: All variables are first-differenced. The lag is chosen to be one. ***, ** and *
23
Table 7 Results of EGARCH (1,1)-in-mean model
Panel A - Conditional mean equation:
𝑟𝑡= 𝛽0+ 𝛽1𝑟𝑡−1+ 𝛽2𝑟𝑡−2+ 𝛽3𝑟𝑡−3+ 𝛽4𝑟𝑡−4+ 𝛽5𝑙𝑛(𝜎𝑡2) + 𝜀𝑡
𝛽0 0.1966 **
𝛽1 0.6865 ***
𝛽2 0.2356 ***
𝛽3 -0.0257
𝛽4 -0.4000 ***
𝛽5 0.0334 *
Panel B - Conditional variance equation:
𝑙𝑛(𝜎𝑡2) = 𝛼0+ 𝛼1𝑙𝑛(𝜎𝑡−12 ) + 𝛼2 𝑢𝑡−1
√𝜎𝑡−12 + 𝛼3
|𝑢𝑡−1|
√𝜎𝑡−12 + 𝛼4𝐷1,𝑡+ 𝛼5𝐷2,𝑡
𝛼0 -3.9238 ***
𝛼1 0.4475 **
𝛼2 0.0122
𝛼3 1.0579 ***
𝛼4 0.7241 **
𝛼5 0.3733
Note: *** and ** denote 1% and 5% statistical significance respectively. The standard
24
Figure 1 Number of private cars per household
Sources: Hong Kong Census and Statistics Department; U.S. Department of
Transportation; U.S. Census Bureau
0 0.5 1 1.5 2 2.5
1982 1984 1986 1988 1990 1992 1994 1996 1998 2000 2002 2004 2006 2008 2010 2012 2014
N
u
m
b
e
r
o
f p
ri
v
at
e
cars
p
e
r
h
o
u
se
h
o
ld
25
Figure 2a Land area analysis (Hong Kong)
26
Figure 2b Total number of cars and carparks (Hong Kong)
Source: Legislative Council Panel on Transport
Figure 2c Fixed penalty tickets for unauthorized parking (Hong Kong)
Source: Hong Kong Police Force
1.00 1.05 1.10 1.15 1.20 1.25 1.30 1.35 500,000 550,000 600,000 650,000 700,000 750,000 800,000
2006 2007 2008 2009 2010 2011 2012 2013 2014 2015 2016
Rat io T o ta l ca rs an d carp ar ks
Total cars Total carparks Ratio
[image:27.595.93.540.427.688.2]27
Figure 2d Monthly parking fees
Sources: Hong Kong Transport Department; “The price of parking” (18 October 2016),
by J. Cortright, retrieved from: http://cityobservatory.org/the-price-of-parking
0 100 200 300 400 500 600 700 800
Cleveland Milwaukee Los Angeles Nashville Grand Rapids Indianapolis Austin Detroit Minneapolis Denver New Orleans Sacramento San Diego Baltimore Portland Houston Pittsburgh Seattle Chicago San Francisco Philadelphia Washington Boston Hong Kong New York
28
Figure 2e Population and real GDP per capita (Hong Kong)
Source: Hong Kong Census and Statistics Department
0 50,000 100,000 150,000 200,000 250,000 300,000 350,000 400,000 0 1,000 2,000 3,000 4,000 5,000 6,000 7,000 8,000
1961 1966 1971 1976 1981 1986 1991 1996 2001 2006 2011 2016
Re al G DP p e r cap ita (H KD) Po p u lat ion (th o u san d ) Year
29
Figure 3 Median monthly income in Hong Kong 18 districts (year 2016)
Notes: 1 – Central & Western; 2 – Wan Chai; 3 – Eastern; 4 – Southern; 5 – Yau Tsim
Mong; 6 – Sham Shui Po; 7 – Kowloon City; 8 – Wong Tai Sin; 9 – Kwun Tong; 10 –
Kwai Tsing; 11 – Tsuen Wan; 12 – Tuen Mun; 13 – Yuen Long; 14 – North; 15 – Tai
Po; 16 – Sha Tin; 17 – Sai Kung; 18 – Islands; – Central Business District (CBD)
30
Figure 4 Real asset price index (1999 = 100)
Sources: Hong Kong Rating and Valuation Department; author’s calculation
0 50 100 150 200 250 300 350 400 450 500
Real carpark price (RCP) Real housing price (RHP) Real office price (ROP)
31
Appendix 1 List of private estates in the calculation of carpark price index
Estate name Housing units Carpark number Weight
Aberdeen Center 2804 471 0.17
Allway Garden 3421 1003 0.29
Avon Park 1304 234 0.18
Belair Gardens 1944 1484 0.76
Belvedere Garden 6016 2010 0.33
Chi Fu Fa Yuen 4333 926 0.21
City Garden 2406 586 0.24
City One Shatin 10643 2781 0.26
Fortress Metro Tower 757 114 0.15
Garden Rivera 1583 356 0.22
Golden Lion Garden 2768 936 0.34
Greenland Garden 960 201 0.21
Hanford Garden 1502 237 0.16
Heng Fa Chuen 6504 849 0.13
Hilton Plaza 928 232 0.25
Hong Kong Garden 2830 2835 1.00
Jubilee Garden 2260 508 0.22
Kingswood Villas 15880 2294 0.14
Kornhill 6648 1168 0.18
Laguna City 8072 1500 0.19
Lei King Wan 2300 393 0.17
Marina Garden 1000 632 0.63
Mei Foo Sun Chuen 13149 3736 0.28
Miami Beach Towers 1272 778 0.61
Nan Fung Sun Chuen 2832 800 0.28
Parc Oasis 1730 1247 0.72
Pierhead Garden 1432 168 0.12
Pokfulam Garden 1120 368 0.33
Provident Center 1450 420 0.29
Riviera Garden 5692 1198 0.21
Sceneway Garden 4112 611 0.15
Sea Crest Villa 2239 1664 0.74
Serenity Park 2475 355 0.14
Shatin Center 1480 753 0.51
South Horizons 9812 1963 0.20
Sunshine City 4760 1459 0.31
Tai Hing Gardens 3647 231 0.06
Tak Bo Garden 2016 400 0.20
Tsing Yi Garden 1520 353 0.23
Tsuen King Garden 3024 333 0.11
Whampoa Garden 10486 2900 0.28
Wonderland Villas 1502 2300 1.53
32 Appendix 2 Robustness check
In this appendix, it attempts to construct another carpark price index by using the
carpark ratio as the weight:
𝐶𝑃𝑡 =∑ 𝐶𝐻_𝑅𝐴𝑇𝐼𝑂∑ 𝐶𝐻_𝑅𝐴𝑇𝐼𝑂𝑖 ∗ 𝑃̅𝑖,𝑡 𝑖
where
𝐶𝐻_𝑅𝐴𝑇𝐼𝑂𝑖 is the carpark ratio in estate i;
𝑃̅𝑖,𝑡 is the average transacted price of a parking space in estate i at time t.
The time plot of real carpark index is similar to the one constructed in the main text. It
experienced a sharp decline during Asian Financial Crisis in 1997, and remained stable
during 1999-2009. After that, it exhibited an upward trend. It has been confirmed that
[image:33.595.91.506.452.743.2]an asset bubble existed from 2014Q3 to 2015Q4. (Details are available upon request.)
Figure A.1 Real asset price index (1999 = 100)
0 50 100 150 200 250 300 350 400 450 500
33
The unit root test suggested that the newly constructed carpark index is non-stationary
in levels, but it achieves stationary after taking first-differencing. In addition, similar
results were found in table A.2, where real asset prices granger cause real carpark prices
at 1% significance level. Finally, table A.3 suggests that investors can receive extra
return for bearing additional risk, and SSD indeed imposes extra volatility to carpark
[image:34.595.97.509.260.448.2]market.
Table A.1 Unit root test
Level 1st difference
RCP 0.7931 -4.9704 ***
RHP 0.2348 -5.0533 ***
RRP 0.2188 -3.9236 ***
ROP 0.0246 -3.6775 ***
RSP -0.2844 -7.9800 ***
RGDP 1.4275 -3.2039 ***
TERM -1.2294 -7.2947 ***
TED -1.5304 -8.3971 ***
Note:The optimum lag is determined by AIC criteria at a maximum lag of 4 quarters.
*** denotes 1% statistical significance.
Table A.2 Granger causality
RCP RHP ROP RRP RSP RGDP TERM TED
RCP
Granger
causes
*
RHP *** **
ROP *** **
RRP *** ***
RSP *** ** *** *
RGDP *** *** ***
TERM
TED * *
Notes: All variables are first-differenced. The lag is chosen to be one. ***, ** and *
[image:34.595.94.523.523.720.2]34
Table A.3 Results of EGARCH (1,1)-in-mean model
Panel A - Conditional mean equation:
𝑟𝑡= 𝛽0+ 𝛽1𝑟𝑡−1+ 𝛽2𝑙𝑛(𝜎𝑡2) + 𝜀𝑡
𝛽0 0.8088 ***
𝛽1 0.7763 ***
𝛽2 0.1659 ***
Panel B - Conditional variance equation:
𝑙𝑛(𝜎𝑡2) = 𝛼0+ 𝛼1𝑙𝑛(𝜎𝑡−12 ) + 𝛼2 𝑢𝑡−1
√𝜎𝑡−12 + 𝛼3
|𝑢𝑡−1|
√𝜎𝑡−12 + 𝛼4𝐷1,𝑡+ 𝛼5𝐷2,𝑡
𝛼0 -2.3981 ***
𝛼1 0.4826 ***
𝛼2 -0.1837 **
𝛼3 -0.1589
𝛼4 0.0995 **
𝛼5 0.0641 **
Note: *** and ** denote 1% and 5% statistical significance respectively. The standard