J. Range Manage.
55:127-134 March 2002
Evaluating the ecological relevance of habitat
mapsfor wild herbivores
MARC E. STALMANS, ED T.F. WITKOWSKI, AND KEVIN BALKWILL
Authors are respectively Ecologist, Head of the Restoration and Conservation Biology Research Group and Curator of the C.E. Moss Herbarium, Department of Animal, Plant and Environmental Sciences, University of the Witwatersrand, Private Bag 3, Wits 2050, Republic of South Africa. Present address of the f rst author is Mpumalanga Parks Board, PO Box 1990,1200 Nelspruit, Republic of South Africa.
Abstract
Informed management of large herbivores depends largely on how well habitat availability and suitability are understood. The aims of the study were to quantify and map the distribution of sour and mixed grasslands in the 48,000 ha Songimvelo Game Reserve, Mpumalanga, South Africa. Mixed grassland retains its forage quality and hence its ability to sustain animal production for longer in the year than sour grassland. An unsupervised clas- sification technique was applied to a LANDSAT 5 TM image acquired in 1993. The probability that each resulting cluster rep- resented either sour or mixed grassland was calculated based on the proportional allocation of 428 sample plots. The 2 resulting probability maps were combined into a single image by selecting the class image that contained the maximum posterior probabili- ty and assigning that class to the output pixel. The accuracy of the vegetation map was assessed by ground-truthing with an independent set of 85 plots. This yielded a correct classification of 84.8% for the sour and 76.9% for the mixed plots. The mixed grasslands covered only 31.0% of the area but accounted for 66.1 % of the game stocking. Water is widely distributed and is not a limiting factor to habitat selection. Based on a GIS analysis, the qualitative difference between mixed and sour grasslands overrides quantitative differences in forage availability, fire his- tory and human disturbance in influencing herbivore distribu- tion. The integration of field data and satellite imagery into a GIS system thus offers a powerful tool for the objective quantifi- cation and mapping of available habitat.
Key Words: wildlife, GIS, remote sensing, LANDSAT, ground- truthing
The informed management of large herbivores in conservation areas depends largely on how well habitat availability and suit- ability are understood. The Songimvelo Game Reserve (hence- forth SGR) is spatially very diverse in terms of its average annual rainfall, underlying geological substrate, elevation, slope, and aspect (Barnes 1998). This results in a very diverse vegetation pattern with marked differences in habitat suitability for herbi-
Funding and logistical support were provided by the Mpumalanga Parks Board.
Authors wish to acknowledge the support by Wilna Heymans who collected the independent data set used for the validation of the satellite map. Magda Rall, Annelize Steyn and other management staff assisted with the collection of vegeta- tion, fire and game monitoring data. Dr Y. Bai and 2 anonymous reviewers provid- ed useful comments and recommendations.
Manuscript accepted 12 Apr. 2001.
Resumen
El manejo actualizado de los grandes herbivoros depende en gran parte de que tan bien son entendidos la disponibilidad y to apropiado del habitat. Los objetivos de este estudio fueron cuan- tificar y mapear la distribucion de los pastizales mixtos y asperos en las 48,000 ha de la reserva de fauna Songimvelo en Mpumalanga, South Africa. Los pastizales mixtos conservan su calidad, y de aqui su habilidad para mantener la produccion ani- mal durante un mayor periodo de tiempo durante et ano que los pastizales asperos. Una tecnica de clasificacion no supervisada se aplico a una imagen LANDSAT 5 TM adquirida en 1993. La probabilidad de que cada conglomerado resultante represente el pastizal mixto o et aspero se calculo en base a la asignacion pro- porcional de 428 parcelas de muestra. Los 2 mapas de probabili- dades resultantes se combinaron en una sola imagen seleccionan- do la clase de imagen que contenia la probabilidad maxima pos- terior y asignando esa clase a la salida de pixel. La certeza del mapa de vegetation se evaluo mediante un reconocimiento ter- restre con un juego independiente de 85 parcelas. Esto produjo una clasificacion correcta en 84.4% de las parcelas de pastizal asperos y en 76.9% de las parcelas de pastizal mixto. El pastizal mixto cubria solo el 31 % del area, pero sostenia el 66.1 % de la carga animal de fauna. El agua esta ampliamente distribuida y no es un factor limitante en la seleccion del habitat. Basado en un analisis de Sistemas de Informacion geografica (GIS) las diferen- cias cualitativas entre los pastizales mixtos y los asperos anulan las diferencias cuantitativas en la disponibilidad de forraje, la historia de fuego y el disturbio humano en influenciar la dis- tribucion de los herbivoros. La integracion de datos de campo e imagen de satelite en un sistema de GIS ofrece una herramienta poderosa para el objetivo de cuantificacion y mapeo del habitat disponible.
vores (Stalmans et al. 1999). This diverse vegetation can be gen- eralised into 2 herbivore habitats, `sourveld' and `mixed veld' (Stalmans et al. 1999) based on forage quality characteristics.
Within the South African ecological context, `sourveld' refers to range in which the forage plants become unacceptable and less nutritious to large herbivores on reaching maturity. Sourveld con- sequently is utilised only during spring and summer (Trollope et al. 1990). `Sweetveld' in contrast retains its acceptability and nutritive value after maturity and is used throughout most of the year. In essence, herbivores feeding on sourveld lose body weight during the dry winter season due to a decline in forage quality below the level for efficient digestion, whereas in sweetveld, for-
JOURNAL OF RANGE MANAGEMENT 55(2) March 127
age quality never declines such that ani- mals cannot maintain growth (Ellery et al.
1995). `Mixed veld' is intermediate
between sourveld and sweetveld. Prior to this study, little quantitative information existed on the spatial extent and distribu- tion of sour and mixed range across the reserve. This quantification is necessary in order to determine appropriate stocking levels of game. The range of game species present, their numbers and their distribu- tion determine the potential for tourism development which is required in the face of the great socio-economic needs experi- enced by rural communities bordering the SGR (Heinsohn et al. 1992).
Remote sensing is a useful tool for inventory and evaluation of wildlife habi- tat because of its multispectral and multi- temporal capabilities at different spatial scales (Quattrochi and Pelletier 1991).
Processed remotely sensed data may be used as input to a Geographic Information System (GIS) and together with ancillary data be used for environmental modelling and analysis (Wilkinson 1996). Wildlife habitat maps derived from remote sensing need to be evaluated for accuracy and eco- logical relevancy before they are used for management purposes. Accuracy assess- ment relies on independent reference data, not used during the process of classifica- tion (Fairbanks and Thompson 1996).
The aim of the study was to evaluate the ecological relevance of habitat maps derived from multispectral remote sensing by first comparing the spatial distribution of the spectrally-derived habitats to the distribution obtained through field sam- pling and by secondly evaluating the actu- al herbivore distribution in relation to the spectrally-identified habitats.
Materials and Methods
Study Area
The Songimvelo Game Reserve (SGR) is located in the southeastern part of Mpumalanga on the South African-
Swaziland border (25°45' to 26°06'S and 30°46' to 31°16'E) and is approximately 48,000 ha in extent (Fig. 1). The terrain is generally rugged with elevation ranging from 600 m above sea level along the Komati River in the south to over 1,900 m in the north and northeast. The geology is very diverse and ranges from alluvium and mafic and ultramafic lavas in the Komati Valley, to felsic lavas, conglomerates, shales, sandstones and quartzites at higher elevations.
Rainfall is concentrated between
Fig. 1. Locality map of the Songimvelo Game Reserve in southern Africa.
November and March, and varies from less than 800 mm per year in the south- west to over 1,400 mm in the north-east (Gamble 1988). Mean minimum monthly temperatures are 5.4°C and 8°C in July and mean maximum temperatures are 22°C and 34°C in January for the highland and lowland areas respectively (Stalmans et al. 1999). The generally acid and arena- ceous geological substrates in the north- east, combined with a higher rainfall, result in leached acidic soils. In contrast, relatively nutrient-rich soils are found in the Komati Valley.
The SGR is characterised by a long and diverse history of small-scale cropping and livestock in the more fertile lowlands (Van der Merwe and Retief 1995). Since its inception in 1986, 20 species of large herbivores have been re-introduced within the 31,700 ha game-fenced portion of the reserve.
The vegetation of the higher-lying regions of the SGR belongs to the grass- land biome. The lower-lying Komati Valley falls within the savanna biome (Rutherford and Westfall 1986). Three of Acocks (1975) vegetation types occur in the SGR. These are veld types 8 (North Eastern Mountain Sourveld) and 63 (Piet Retief Sourveld) which correspond to the North-eastern Mountain Grassland of the grassland biome as defined by Low and Rebelo (1996). Veld type 9 (Lowveld Sour
Bushveld) corresponds to the Sour Lowveld Bushveld of the savanna biome.
The forest biome is represented in the SGR by numerous isolated patches of for-
est, mostly at higher elevation and along drainage lines (Stalmans et al. 1999).
Conceptual approach
Three basic steps were followed. First, a classification into habitats was produced based on spectral differences in the vege- tation. Field data were used to assign clas- sification results into habitats with distinct differences in forage quality. Secondly, the accuracy of the resultant habitat map was assessed using a set of independent field data. Lastly, the ecological relevance of the map produced was evaluated using actual herbivore distribution patterns.
Vegetation field data
Reference data on the spatial spread of the sour and mixed range were collected for use in developing the wildlife habitat map from remote sensing imagery. A total of 428 sample plots of 30 X 30 m were subjectively located across the Songimvelo Game Reserve (SGR) during the period 1993-1995. Cover and height classes for individual woody and grass species within the 30 X 30 m plots were estimated using the semi-quantitative measures of the Braun-Blanquet approach (Mueller- Dombois and Ellenberg 1974) and struc- tural measurements of Edwards (1983).
Records of environmental data included elevation (by means of an altimeter (± 20 m) and the 1:50 000 topocadastral maps), geology (according to 1:250 000 geologi- cal survey maps (Geological Survey 1986) and locally at a finer scale through person- al observations), landscape position (Land
128 JOURNAL OF RANGE MANAGEMENT 55(2) March 2002
Type Survey Staff 1989), aspect (whether predominantly N, E, S or W), slope steep- ness (class estimate), soil texture (using the sausage method (National Working Group for Vegetation Ecology 1986)) and rockiness (estimated as a percentage of the ground cover). The sampling adequately covered the different combinations of environmental factors (Stalmans et al.
1999), in particular elevation and geology which are known to be major determinants of plant community composition and dis- tribution in this montane setting (Deall and Theron 1990). Grazing pressure with- in each plot was rated according to 3
broad subjective classes: none to light, medium, and heavy.
Ordination and classification of the data set resulted in the delimitation of 18 plant communities identifiable in the field
(Stalmans et al. 1999). These 18 commu- nities were combined into 3 main vegeta- tion units: mixed communities, forest and thicket communities, and sour communi- ties. Mixed and sour communities are dis- tinguished using criteria developed by Ellery et al. (1995) regarding the propor- tion of `sour' (unpalatable), `sweet' (palat- able) and `mixed' species. Forest and thicket communities are dominated by woody species with a closed canopy cover.
Manipulation of satellite imagery
Landsat Thematic Mapper quarter scene WRS 168-3-078, acquired on 8 January 1993, was used. The image was radiomet- rically corrected. Geometric corrections were applied in both the along-scan and across-scan directions using ground con- trol points. Pixel size is 30 X 30 m. Bands 3, 4, and 5 were selected. Bands 3 (red) and 4 (near infrared) have been shown to give a good measure of vegetation density, especially as it relates to leaf area, where- as band 5 (middle infrared) provides a good measure of canopy closure (Rey- Benayas and Pope 1995). This combina- tion of bands has been used successfully in rangeland (Mackay and Zietsman 1996) and forest studies (Fuller et al. 1998).
A hybrid approach was adopted for the
classification of the LANDSAT data.
Unsupervised classification allocates each pixel to a certain class based on its spec- tral characteristics only. In contrast, super- vised classification of the imagery requires pre-defined training sites to assign each pixel of the image to a certain class. The drawback to the supervised approach is that it is often difficult to locate and define homogenous training sites for all plant communities of interest. The considerable
pixel to pixel variation generally results in many pixels being misclassified (Tueller 1989). Unsupervised classification approach- es have worked better in rangelands. The drawback of the unsupervised classification is that subjectivity in the interpretation of the resulting classes is unavoidable.
In this instance, no a priori assumptions were made regarding the information con- tent of the LANDSAT image or of the classification clusters. Instead, the empha- sis was on the interpretation of the classifi- cation results and the improvement of the classification by incorporating ancillary data (Hutchinson 1982, Medler and Yool 1997). An adequate spatial spread of the ground data was considered key to a suc- cessful interpretation of the different clas- sification clusters, in particular where it is known that clusters could be the result of differential spectral response linked to slope and aspect characteristics (Quattrochi and Pelletier 1991). The available sample of 428 vegetation plots adequately covered the different elevation, aspect and geology combinations on the Songimvelo Game Reserve (SGR) (Stalmans et al. 1999) and thus enabled the combination of 2 or more different clusters (based on spectral char- acteristics) into a single vegetation unit (based on field data).
As a first step, the composite image of the 3 bands was subjected to an unsuper- vised classification using a histogram peak technique of cluster analysis in the IDRISI
Geographical Information System (Eastman 1992). Based on its spectral characteristics, each pixel is assigned to a particular cluster or class. This resulted in 46 classes or clusters, each consisting of multiple individual polygons. Twenty-one clusters each covered less than 100 ha (or 0.2% of the SGR) scattered across the area. In view of the very small spatial extent of these scattered fragments, these 21 clusters were discarded and the original composite image was again classified with a maximum limit of 25 clusters to ensure that each remaining cluster covered at least 100 ha. In terms of managing the reserve, very small areas cannot realisti- cally be managed differently than the sur- rounding matrix.
The available field data were used in an objective manner to determine the proba- bility of the classification results repre- senting certain communities. The 428 sample plots were each assigned to one of the 3 vegetation units, namely sour grass- lands, mixed grasslands, or forests and thickets. Each point was buffered to cover a window of 3 rows X 3 columns of pixels from the LANDSAT image. This trans-
lates into a physical dimension of 90 X 90 m which takes into account inaccuracies inherent to the Global Positioning System (henceforth GPS) positioning (see Fuller et al. 1998 for a similar approach). Habitat type assignments for pixels in the cluster image were compared to that of the buffered sample points. A crosstabulation of the cluster image with the buffered image was made. The resulting matrix was used to assign probabilities for each clus- ter to represent respectively mixed or sour vegetation based on the percentage mixed and sour sample plots occurring in each cluster. These probabilities were used to produce 2 probability images; one for the mixed and one for the sour vegetation unit. These 2 probability images were combined into a single image by selecting the class image that contains the maxi- mum posterior probability, and assigning that class to the output pixel.
Only 43 of the vegetation plots (10% of the total sample) represented forests and thickets. Their GPS position was likely to be less accurate because of the thick canopy cover, which when combined with the generally narrow linear distribution of these formations, renders the above approach less meaningful. An alternative approach was therefore followed. Six known and clearly identifiable forest patches were digitized from 1:10,000 scale orthophotos. The classification clusters corresponding best to these patches were identified. All other clusters with the same identity were consolidated across the whole image into a forest/thicket unit. The forest/thicket unit was superimposed on the mixed/sour habitat map.
The habitat map obtained was further refined by assigning any mixed vegetation pixels occurring above 1,300 m elevation to the sour range. Based on their composi- tion, none of the 112 sample plots situated above 1,300 m elevation represented
mixed vegetation. Secondly, a median 3 X 3 pixel filter was applied to remove ran- dom noise and unwanted speckle (Fuller et al. 1998). Lastly, the known extent of the non-native pine (Pious spp.) plantations occurring within the boundaries of the SGR was superimposed on the map result- ing in a final map with 4 habitat units.
Ground-truthing of the satellite- derived map
Three measurements of error were used to assess the accuracy of the habitat map derived from the satellite imagery. Errors of omission occur when the satellite map fails to recognise the actual habitat class of an independent sample plot. Errors of
JOURNAL OF RANGE MANAGEMENT 55(2) March 129
commission result when the satellite map misclassifies the sampling plot from the independent data set. A Kappa Index of Agreement (KIA), both for all classes and on a per category basis, constitutes the third measure of error. The KIA ranges from 0.0 indicating no correlation to 1.0 indicating perfect correlation (Eastman 1992).
A data set collected during 1989 prior to, and independently from the present study was used to assess the accuracy of the habitat map. Grasslayer composition of 85 plots of 25 X 100 m, subjectively located across the Songimvelo Game Reserve (SGR), was assessed by means of 100 points per plot using the nearest-root- ed plant criterion (Mentis 1984). These plots were assigned to the mixed and sour vegetation units based on species compo- sition. A crosstabulation was performed between the assigned plots and the satel- lite-derived image. Habitat categories from the plots were compared with those of the satellite map. A tabulation was kept of the number of cells in each category combination. No tabulations were made for cells marked with a 0 on the ground- truth map. Ommission, commission and KIA were calculated from the crosstabula- tion results.
Ecological significance of the satel- lite-derived map
Overall stocking densities for the Songimvelo Game Reserve (SGR) (1815 kg km 2 during 1994 and 3288 kg km 2 during 1999) fall well below the estimated grazing capacity for this part of the coun- try (5,000 kg km2 or higher)(Barnes
1990). Given these overall low stocking densities on the reserve and large contigu- ous areas of different habitats being avail- able to game, the spatial distribution of large herbivores should reflect the spatial distribution of mixed and sour grasslands.
This would particularly apply during win- ter when forage resources are most limit- ing both in terms of quality and quantity
(Voeten and Prins 1999).
Two helicopter game counts were con- ducted during the winter months of
August 1994 and September 1999 respec- tively as herbivores were more easily visi- ble due to the lower leaf cover (as the vast majority of savanna trees are deciduous).
Counts were conducted by means of a Bell Jetranger helicopter seating a pilot, navi- gator and 2 observers in the back record- ing game within 300 m wide parallel
strips. The helicopter was maintained at a constant height of 53 m above the ground.
Airspeed was maintained at around 96 km hour (60 knots). Each count was conduct-
ed within a period of 3 days. Extensive field experience from the pilot and observers indicates that no large-scale movement of game occurs within such a
limited time period. Breaks during the counting were made along natural bound- aries across which little or no short-term movement of game is expected. Double- counting of individual animals or herds is
avoided by herding animals from the counting strip deeper into strips already counted. A GPS co-ordinate was recorded for each game sighting. Viljoen and Retief (1994) found the measured errors between actual and recorded localities using GPS technology for game counts to be well within the requirements for ecological work of this kind. Each GPS point was compared with the habitat map to establish whether the sighting fell within mixed or sour range. A value in kg km 2 was calcu- lated for each point based on the species and number of animals involved in each sighting.
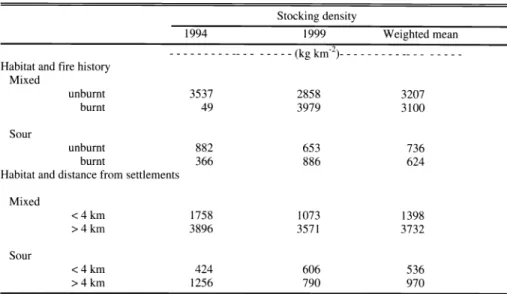
The underlying assumption in distin- guishing between mixed and sour habitats is that nutritional value represents the overriding factor determining herbivore distribution. Three other important factors however could influence herbivore distrib- ution across the landscape. These are water availability, feed availability and fire history. Another complicating factor in the SGR is the presence of a number of human settlements within the game-fenced area. It is critical to ascertain that the assessment of the value of the mixed and sour habitats delimited on the satellite map is not biased through 1 of these factors.
Distance to the nearest watering point is known to be important in determining her- bivore use intensity (Thrash et al. 1995).
With the GIS a distance analysis was per- formed from all known perennial streams and rivers in order to establish whether any parts of the SGR might be unavailable to water-dependent species such as impala (Aepyceros melampus Lichtenstein)
(Young 1970).
A crude index of grass quantity avail- able in the sour and mixed habitats was calculated as follows during the survey of the 428 vegetation plots. The class value for the grass cover estimate (1 = sparse, 2
= open, or 3 = closed)(structural terminol- ogy and categories follow Edwards (1983)) in each sample plot was multiplied by the square root of the midpoint of the 3
following height classes (1= < 0.5 m, 2 = 0.5 to 1.0 m, 3 = 1.0 to 2.0 m). Trollope and Potgieter (1986) used a similar approach to measuring standing phy- tomass.
Many African ungulates are attracted to recently burnt grassland (Wilsey 1996).
The extent of areas burnt during the 12 months preceding the 1994 and 1999 win- ter helicopter counts was determined for the mixed and sour habitats. Fires have been mapped since 1987 in the Songimvelo Game Reserve (SGR) and the data have been consolidated in the GIS. A crosstabulation of burnt and unburnt areas was performed with the GPS positions of the game to assess relative and absolute stocking densities.
Illegal hunting and snaring are not con- sidered to have a major effect around the settlements within the SGR. However, competition from livestock, habitat modi- fication through cultivation and exclusion through protective fencing around crop- lands could negatively influence wild her- bivores. A distance analysis was per- formed from the GPS positions of the set- tlements. An overlay of the buffered image was made with the habitat map. The
resulting distance-habitat map was crosstabulated with the GPS positions of the game.
Throughout the assessment of the eco- logical significance of the satellite-derived map, a Chi-square goodness-of-fit analysis (Zar 1984) was used to evaluate differ- ences between the observed crosstabula- tion results and the expected patterns of occurrence based on proportional habitat availability.
Results and Discussion
Habitat units
Twenty-five out of the 428 sample plots represented wetland and non-native com- munities dominated by planted pine or closed-canopy stands of self-seeded Black wattle (Acacia mearnsii De Wild.) and were not considered further. Of the remainder, 43 plots represented forests or thickets. No single plot was classified as sweet range requiring more than 30% of the total cover to consist of `sweet' species and less than 20% cover by `sour' species (Ellery et al. 1995). A total of 224 plots were classified as sour range with `sour' species contributing more than 60% of the cover of the plot and `sweet' species con- tributing less than 20% cover. The remain- ing 136 plots were by definition mixed range by not conforming to either the sweet or sour criteria. The grazing intensi- ties recorded in the field indicate a dramat- ic and significant difference in usage of the mixed and sour vegetation units (x2 =
101.64, x2 0.05,1 = 3.481, P < 0.001).
130 JOURNAL OF RANGE MANAGEMENT 55(2) March 2002
5 5 10 15 20 25 30 Kilometers
Cover classes Mixed range Sour range Forest & thickets Pine plantation Rivers
Fig. 2. Satellite-derived range map of the Songimvelo Game Reserve. Note mixed range in the south-western lower-lying Komati River valley and sour range in the north-eastern high mountains.
Whereas 57.3% of the mixed plots were assessed as being medium to heavily grazed, only 7.6% of the sour plots were similarly rated. This indicates that the split into sour and mixed range based on floris- tic composition criteria translates into an ecologically meaningful difference to her- bivores.
Habitat map
Crosstabulation of the 25 classification clusters with the vegetation plots generally resulted in a high individual probability for each of the clusters to represent either sour or mixed range. More than half of the surface area of the Songimvelo Game Reserve (SGR) has a cluster probability above 80%. For 92.2% of the total area, the cluster probability is above 65%. Only 2 clusters have less than a 65% probability factor of representing only sour or only mixed vegetation. These 2 clusters only make up 7.8% of the total area. Their spa- tial distribution is of interest. The 2 clus- ters are spread in a horseshoe marking the transition from the low-lying Komati Valley to the higher mountains to the north and east (Fig. 2). The Themeda triandra Forssk. (Rooigras)- Cymbopogon spp. short Grassland community which is a transitional community intermediate between typical mixed woodland commu- nities and sour grassland communities was identified for this zone (Stalmans et al.
1999). The low probability scores for these clusters probably reflect the hetero- geneous and intermediate nature of the vegetation in this particular area.
The final habitat map clearly depicts the
mainly mixed vegetation in the low-lying Komati Valley and Msoli Valley (Fig. 2).
The higher-lying mountains to the north and east are mainly covered by sour vege- tation. The forest and thickets also occur mostly at higher elevation as small pock- ets and linear formations in drainage lines.
Pine plantations are located in the north- east. The mixed vegetation is the smallest of the 3 main units covering 8,504 ha or 17.3% of the SGR, followed by the thick- ets and forests (10,1 19 ha or 20.6%). The sour habitat occupies 29,684 ha which rep- resent 60.4% of the game reserve.
Ground-truthing of satellite-derived map
The habitat map conforms in broad terms to the understanding of the vegeta- tion as obtained through ordination and classification of the 428 sample plots (Stalmans et al. 1999). Mixed communi- ties occur mostly in the Komati Valley and sour communities at higher elevation.
The independent sample of 85 plots used for the validation consisted of 52 mixed and 33 sour plots. The unsupervised
procedure correctly classified 76.9% of the mixed and 84.8% of the sour sample plots. The Kappa coefficient (KIA) was 0.59. The overall percentage correct clas- sification was 80% (obtained by dividing the sum of the diagonal entries in the error matrix by the total number of sample plots) (Table 1).
A good correspondence between the 6
digitized forest patches and the satellite- derived forest patches was obtained. The overall correct classification for the 6
patches was 78.4%. The KIA was 0.74.
The satellite map overestimated the actual forest cover by 13.6%. The forest/thicket coverage was simply used to identify those parts of the SGR not dominated by grasslands which were the focus of the present study.
Classification accuracy reported by other researchers mapping landcover (Brondizio et al. 1996, Fuller et al. 1998, Hodgson et al. 1988, Lunetta and Balogh 1999), forest cover (Congalton et al. 1993) and grassland cover (Lauver and Whistler 1993) ranged from 69 to 94%. The accuracy figures of 78 to 80% achieved for the mixed/sour vegeta- tion and forest patches on the SGR are thus considered to be satisfactory for an opera- tional product of this kind.
Ecological significance of the habi- tat map
During 1994 a total of 22,800 ha was covered by the helicopter survey whereas during 1999 the whole game-fenced area of 31,700 ha was flown. A total of 705 GPS coordinates of wild herbivores were recorded for the 1994 count and 865 for the 1999 count. The associated animal bio- mass per GPS locality ranges from 10 kg
(1 klipspringer (Oreotragus oreotragus Zimmermann)) to 16,560 kg (a herd of 36 eland (Taurotragus oryx Pallas)). Elephant (Loxodonta africana Blumenbach) consti- tuted 11.4% of the total metabolic mass of wild herbivores present on the Songimvelo Game Reserve (SGR) in 1999. They gen- erally move around in I or 2 herds and large daily movements across the land-
Table 1 Error matrix resulting from the crosstabulation of the 85 independent sample plots with the habitat map of the Songimvelo Game Reserve obtained through unsupervised classification of LANDSAT Thematic Mapper quarter scene WRS 168-3-078.
Satellite-derived habitat map Independent data set
Mixed
range range
total error
(%)
Mixed range 40 12
Sour range 5 28
Column total 45 40
Omission error (%) 11.1 30.0
JOURNAL OF RANGE MANAGEMENT 55(2) March 131