Munich Personal RePEc Archive
A Monte Carlo Simulation Framework to
Track Panama NDC Target
Suarez, Ronny
18 November 2019
Online at
https://mpra.ub.uni-muenchen.de/97022/
1
A Monte Carlo Simulation Framework to
Track Panama NDC Target
Ronny Suarez*
[email protected](*) This paper is based on the dissertation prepared by the author in partial fulfilment of the requirements of the Master of Business Administration Energy and Sustainability of the University of Cumbria.
Abstract
The 2015 Paris Agreement represents a restarting point for combating climate change. The Agreement introduces the National Determined Contributions (NDC) to control greenhouse gas emissions. This paper provides a step-by-step framework to evaluate Panama’s renewable energy contribution commitment in terms of CO2eq mitigation. Monte Carlo Simulations are used to compute dynamic scenarios of MtCO2eq emissions determining that the occurrence of delays in the entry into operation of specific projects combined with the presence of El Niño phenomenon could increase, up to 45%, the value of the CO2eq emissions compared against baseline scenario.
Introduction
The Paris Agreement represents a restarting point for combating climate change, for three reasons: it achieved the consensus and formal commitment of the countries almost twenty years after the last signed comprehensive arrangement, the Kyoto Protocol; it made a change to the mechanism used to control greenhouse gas emissions, confronting global warming through the definitions of National Determined Contributions (NDC); and it establishes a mechanism for periodic review of the NDC promoting the evaluation of progressive goals and the assessment of the measures implemented to reach those contributions.
International studies present that the committed pledges amounts defined by the countries would not keep the global average temperature increase below 2ºC (Rogeli et al., 2016; UNEP, 2016; Sokolov et al., 2016, and Jiang et al., 2019). Furthermore, several studies also conclude that countries are failing to meet their pledge to cut greenhouse gas emissions (Victor et al., 2017; CAN, 2018; and CAT, 2019). The failure of each country to meet its individual goals in terms of
emissions reduction increases the likelihood of failing to reach a global goal reduction of GHG emissions. Additionally, when a country lacks studies that define and monitor measurable indicators to assess the effectiveness of compliance with its proposed goals, and it does not present an explanation of the process and the interaction among the variables that led to the calculation of its goals, the tracking capacity of the targets is limited.
IPCC (2014) indicates that economic and population growth remain as the main drivers of the increase in CO2 emissions. It also comments that extraction, conversion, storage, transmission, and distribution of energy remains as the most significant contributor to GHG emissions in the world. The report highlights the deployment of renewable energy as a reliable option to reduce greenhouse gas emissions produced by fossil fuel combustion. It comments that renewable energy technologies demonstrated considerable performance improvements and cost reductions. The document also remarks that decarbonising electricity generation, in combination with energy demand reduction, is a crucial instrument to achieve lower levels of CO2eq.
This paper is organised as follow: The first section presents Panama NDC. The second section shows the Monte Carlo Simulations Framework. It will explain how to transforms installed capacity to CO2eq emissions. It also explains how to simulate a delay in commercial operation of a project and the presence of El Niño using a binomial distribution. The third section shows the discussion of results. The last section provides conclusions.
Panama NDC
According to the Panama NDC (2016), the nation contributes only 0.02% to global greenhouse gas emissions and records a low 1.86 average global tCO2eq emissions per capita, excluding land-use change and forestry. The country defined as an objective of mitigation in the energy sector to increase installed capacity of other energy sources renewable (solar, wind and biomass) by 15% in 2030 and 30% in 2050 compares with 2014.
2
A B C= A*B
Technology tCO2eq/GWh GWh tCO2eq
Coal 820 483 396,273 Oil 735 1,389 1,021,040 Gas 490 623 305,403 Biomass 230 18 4,054 Solar 48 233 11,167 Hydropower 24 7,855 188,524 Wind 11 588 6,467 Total: 11,189 1,932,927 generation, including the participation of renewables
energies. The plan does not present a transparent calculation of equivalent CO2 reduction, neither alternative scenarios for the energy matrix showing different energy generations paths.
NDC commitment based on an increase in the installed capacity of (non-conventional) renewable energy sources can overestimate the expected CO2eq emissions reductions over a period. A target defined in terms of installed capacity that does not consider parameters changes in the capacity factor or delays in the construction of projects can undervalue total CO2eq emissions. For example, in the electricity sector, the greater use of thermal plants that operate with petroleum derivatives holds a more considerable amount of CO2eq emissions. Countries generally use thermal plants when there is a delay in the entrance into the operation of renewable energy projects to avoid blackouts. Also, countries trend to use thermal plant to guarantee energy security when there is a reduction in the generation of the installed hydroelectric plants because of the scarcity of rainwater.
MiAmbiente (2018) remarks that transforming the contribution of Panama in tCO2eq requires an exercise that depends on the composition of the energy matrix. These calculations are difficult to quantify with preci-sion because the emispreci-sions of the sector are directly as associated with generation and not to the installed capacity of the different plants.
Monte Carlo Simulations Framework
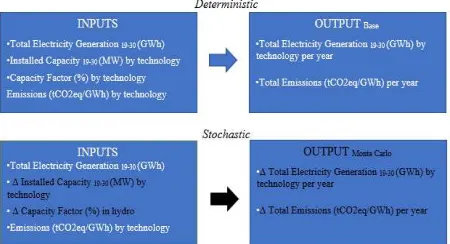
[image:3.612.324.541.221.346.2]The Monte Carlo Simulation Framework first requires building a CO2eq emissions baseline scenario and second to make random variations on the inputs to generate alternative outputs (see Figure 1).
Figure 1. The Monte Carlo Simulations Framework
++ CO2eq emissions in terms of gCO2eq/kWh, kgCO2eq /MWh or
tCO2eq /GWh are equivalent ratios.
Generation (GWh) is calculated multiplying the installed capacity (MW) by the capacity factor (%) times 8,76.
[image:3.612.73.298.526.648.2]CO2eq emissions++ are calculated multiplying the generation by electricity generation technology type by its life-cycle emissions (see Figure 2). Annex III of IPCC (2014) provides the median life-cycle emissions for pulverised coal=820, gas combined cycle=490, dedicated energy crops biomass=230, utility-scale solar photovoltaic=48, onshore wind=11, and hydropower=24. WNA (2011) provides the median life-cycle emissions for oil=735.
Figure 2. CO2eq emissions calculations at 2018
a) CO2eq Emissions Baseline Scenario
The deterministic estimations of CO2eq emissions for the 2019-2030 period define the Baseline Scenario. Calculation of the Baseline Scenario follows the next procedure (see Tables in Exhibits section):
• To estimate the total installed capacity of the country per electricity generation technology per year for the period 2019-2030 (Table 3). It starts with the most recent information available (Table 1) and then subtracts projects that will stop operating and adding projects that will begin operating in a given year (Table 2).
• To estimate the total electricity generation of the country per year for the period 2019-2030 (Table 4). In this case, the maximum energy demand of the country was used to forecasts energy generation. It is also assumed that the country is self-sufficient, so it should not incur energy importation during that period (SNE, 2016, p. 196).
3
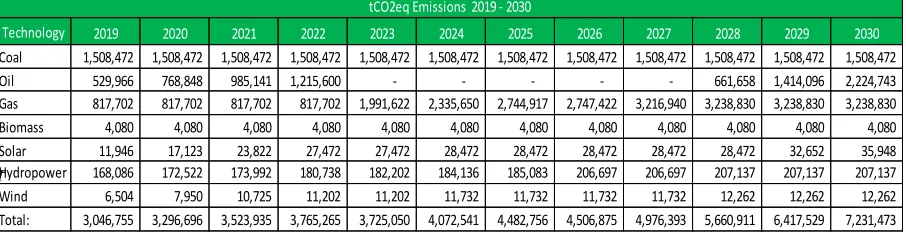
the real capacity factor registered in 2018, and 45% for hydro using the real average capacity factor registered for the period 2015-2018, averaging wet and dry years. The electricity generation from oil derivatives plants is estimated as the amount required to reach the projected annual generation minus the generation generated by the other energy sources.• To estimate the total CO2eq emissions per year for the period 2019-2030 (Table 6).
b) Building Simulations
The Monte Carlo Simulations will be executed using the Oracle Crystal Ball software. Simulations represent an original exploration to estimate the impact of two specific random events (Delay and El Niño) in terms of change in the expected CO2eq emissions per year for the period 2019-2030. Simulations were executed through 10,000 trials and using the 99.9% percentile to present the simulation graphs.
The first simulation evaluates a delay in the entry date of operation of any of the “big four” projects: Viento Sur 115 MW, Chan II 228 MW, Martano 458 MW, and NG Power 670 MW. This simulation incorporates the use of a binomial distribution with parameters n=1 and probability 50% (it happened, or it did not happen). It is assumed a value of 1 if the project was implemented in a year and a value of 0 if not. In case the project is implemented in a specific year recording a value of 1, then it will be computed a value of 0 for the remaining years. A delay in any of these projects will increase CO2eq emissions because the energy demand must be satisfied with electricity generation from thermal plants.
The second simulation evaluates the phenomenon of El Niño. In Panama El Niño, on average, produces a decrease in rainfall in regions located in the Pacific climate, and it repeats between every 2 to 7 years (ETESA, 2015, p. 3). This simulation also incorporates the use of a binomial distribution with parameters n=1 and probability 50%. In this case, the value of 1 represents the presence of a dry year, so the capacity factor uses 35% in the hydro plants. The capacity factor of 35% was recorded in 2014 when this natural phenomenon took place in the recent years. The value of 0 represents the presence of an average year, so the capacity factor keeps 45% in the hydro plants.
The third simulation evaluates the delay and El Niño cases at the same time. These random events are independent ones, so there is not needed to assume a correlation value for the variables.
c) Limitations
The following sections present the main limitations found in the simulation process:
• Energy exchange: There is an Electric Regional Market (MER) that regulates the energy sold, in the contract market and the opportunity market, among Guatemala, El Salvador, Honduras, Nicaragua, Costa Rica, and Panama. Although SNE (2016) did not project energy exchanges between Panama and the MER’s member countries, there is a daily export and import of energy flows. The National Dispatch Centre (CND) of Panama maintains monthly statistics of the MER, for instance in 2018 Panama exported 327 GWh and imported almost 15 GWh. Energy exchange estimations could be used to fine-tune the electricity generation projections and their associated tCO2eq emissions.
• Accurateness of the capacity factor: Historical recorded values were used to define the inputs of the capacity factors of each electricity generation technology. However, the capacity factor is specific to the availability of the resource on the site and to the technical specifications of the generation equipment to be purchased from the manufacturing company. Ideally, each proposed expansion project should have its evaluation of the capacity factor.
• Exactness of the life-cycle emissions: The lack of information on CO2eq emissions by source of energy for the specific type of plants that the national energy system expansion plan depicted, constitutes a weakness. It would have been pertinent, if there was knowledge of how to perform the harmonisation of parameters, to make the appropriate adjustments between each specific project. For example, to adjust the CO2eq emissions for the Chan II hydroelectric project that constitutes a (large) hydro with reservoir and it is not a (small) run-of-river hydro. Equally, to adjust the CO2eq emissions from the thermal plants that produce with light diesel vs those that produce with bunker-C.
4
Technology 2020a 2020b Gap 2030a 2030b Gap
Coal 1.1 1.5 0.4 1.5 1.5 0.0 Oil 0.0 0.8 0.8 2.4 2.2 - 0.2 Gas 0.5 0.8 0.3 2.9 3.2 0.3 Biomass 0.0 0.0 0.0 0.0 0.0 0.0 Solar 0.0 0.0 0.0 0.0 0.0 0.0 Hydropower 0.2 0.2 - 0.0 0.2 0.2 - 0.0 Wind 0.0 0.0 - 0.0 0.0 0.0 - 0.0 Total: 1.9 3.3 1.4 7.1 7.2 0.1
Leyend (a) SNE (2016) (b) Base Model
MtCO2eq
Discussion of Results
a) Baseline Scenario
During the period 2019-2030, the estimated installed capacity in the baseline scenario will increase 62.7%, from 3,487 MW to 5,674 MW. That increase (+2,188 MW) is supported in a 51.6% by the integration to the system of two natural gas plant planned to enter at 2023 (+1,128 MW) and a 48.4% by the development of several new renewable projects (+1,060 MW). The renewable sources will have a participation in the total installed capacity of the country of 64.8% in 2019 and 58.5% in 2030.
[image:5.612.324.543.128.248.2]Figure 3 presents the projected gap in MW between the installed capacity defined by SNE in the National Energy Plan and the one estimated in the baseline scenario. At 2020 it is determined a gap of 1,383 MW of installed capacity in the country. The delay in the execution of 381 MW in natural gas, 366 MW in hydro, and 338 MW in wind projects, and the difference in the assumption of exit of bunker and diesel plants justified the gap. By 2030 it is estimated that the gap in the total projected installed capacity will be 208 MW. Thus, in 2030 the deficit of wind, hydro and oil derivatives is partially compensated by the surplus of natural gas and solar.
Figure 3. Installed Capacity Gap 2020 & 2030
A natural gas plant, a hydroelectric plant, and a wind project has a construction period of at least three years, between two and three years, and at least two years, respectively. Therefore, the lethargy recorded at the start of works of these types of projects will raise the tCO2eq emissions that the country could achieve. Particular concern should generate the fact that since 2016 no wind project has been integrated into the national grid. Additionally, it should worry that NG Power gas plant registers until now a delay of at least six years. Finally, it should also draw attention that the Panamanian energy matrix did not incorporate 366 MW hydroelectric projects as planned.
Figure 4 presents the projected gap in CO2 emissions. Given the gap in the installed capacity, the estimated generation by type of technology will produce an
increase of 1.4 MtCO2eq in 2020 between la emissions expected in the National Plan and the baseline scenario. In the year 2030, the estimated values produce an emissions’ gap of almost zero.
Figure 4. CO2eq Emissions Gap 2020 & 2030
The government has a critical role in providing an appropriate environment to maintain investment flows in the energy sector (IPCC, 2007, p. 21).
ETESA (2018) estimated in its expansion plan a total investment of $1,5 billion (864 MW), $0.9 billion (907 MW), $1.5 billion (485 MW) for the next twelve years in wind, solar, and hydro projects, respectively. That amount of investment will keep requiring the participation of the private sector under a satisfactory regulatory framework.
The presence of long-term energy contracts facilitates obtaining financing for projects (Junfeng et al., 2002; Mirza et al., 2009; and Wiser and Pickle, 1998). ETESA awarded the last long-term PPAs auction for renewable projects between 2013 and 2014, specifically, wind and hydro in 2013, and solar in 2014.
It is also known that the promotion of incentives contributes to the development of a renewable project (Islam et al., 2008; Lidula et al., 2007; Martin and Rice, 2012; Painuly and Fenhann, 2002; and Yaqoot et al., 2016). The last supports instruments were formulated in 2004 for hydroelectric plants through the Law. No. 45, in 2011 for wind projects through the Law No. 44, and in 2013 for solar installations through the Law No. 37.
Furthermore, the perception of adverse environmental impacts by local communities has slowed the development of hydroelectric projects in Panama. Mainly, the opposition to hydro led to the cancellation of 21 hydro concessions in 2015 (Lorenzo, 2016). Hydropower projects may require multi-party collaborations to address energy and water needs (IPCC, 2011, p. 13). Thus, the government should promote awareness and information about the benefices of the hydro projects and contribute to reach agreements between the parties.
Technology 2020a 2020b
Gap 2030a 2030b
Gap
Coal 320 420 100 420 420 -Oil 866 428 - 438 866 428 - 438 Gas 762 381 - 381 1,362 1,509 147 Biomass 8 8 - 0 8 8 - 0 Solar 250 291 41 250 611 361 Hydropower 2,190 1,824 - 366 2,308 2,189 - 119 Wind 668 330 - 338 668 509 - 159 Total: 5,064 3,681 - 1,383 5,882 5,674 - 208 Leyend (a) SNE (2016) (b) Baseline Scenario
[image:5.612.72.290.395.516.2]5
0.0 1.0 2.0 3.0 4.0 5.0 6.0 7.0 8.0 9.0 10.02018 2019 2020 2021 2022 2023 2024 2025 2026 2027 2028 2029 2030 Mt CO2eq 2018-2030
Base Delay El Niño Delay+El Niño
0.0 1.0 2.0 3.0 4.0 5.0 6.0 7.0 8.0 9.0 10.0
2019 2020 2021 2022 2023 2024 2025 2026 2027 2028 2029 2030
M t C O 2 e q
Delay + El Niño
Base SIM-99.9%
b) Monte Carlo Simulations
The Monte Carlo Simulations detail that all random events simulated affect emissions by increasing the amount estimated of MtCO2eq that the country can reach (see Figure 5). The joint effect of El Niño and the delay (see Figure 6) is the event with a more considerable increase in emissions.
The effect of dry years for the period 2019-2030 will increase the annual average MtCO2eq emissions by 25.0%. The average emissions will rise 1.1 MtCO2eq per year from 4.6 MtCO2eq to 5.7 MtCO2eq.
[image:6.612.72.291.289.461.2]The effect of delays in the “big four” project represents an increase of 27.2% in the annual average MtCO2eq emissions for the period of analysis 2021-2030. The average emissions will growth 1.3 MtCO2eq per year from 4.8 MtCO2eq to 6.1 MtCO2eq.
Figure 5. CO2eq emissions by the Monte Carlo Simulations
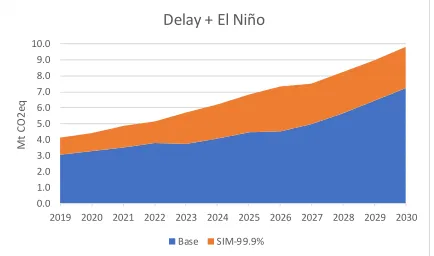
The joint effect of a delay and El Niño for the period 2019-2030 will increase the annual average MtCO2eq emissions by 44.9%. The average emissions will increase 2.0 MtCO2eq per year from 4.6 MtCO2eq to 6.6 MtCO2eq.
Figure 6. CO2eq emissions by the Monte Carlo Simulations
Conclusions
The Paris Agreement defined the year 2020 as the first year to communicate new updated NDCs. This study assessed that the country would fail to achieve the 2020 goal proposed in terms of installed capacity. The country will record a deficit of around 50% in wind and natural gas facilities not installed and approximately 20% in hydro projects not installed. Some instruments mentioned to accelerate the execution of missing installed capacity are: the issuance of new long-term PPA contracts, the reformulation of incentives for companies that develop and operate energy project, and the awareness of potential benefits hydroelectric projects,
Concerning the Panama NDC 2030 goal of reaching 15% of the country's installed capacity by wind and solar facilities, it is feasible. According to the projection made in the baseline scenario, the installed capacity of wind plants and solar installations would represent 19.7% for the year 2030. So, non-traditional renewable sources can have a participation greater than the target set.
However, the presence of a higher installed capacity in non-traditional renewable energy sources does not guarantee in advance lower CO2 emissions. When the electricity generated with wind or solar sources present a lower production, there will be a lower possibility to replace the emissions generated by the alternative thermal sources. Therefore, it is preferable to set targets in terms of MtCO2eq emissions for the energy supply sector. Various combinations of electricity generation by technology can produce the same amount of MtCO2eq emissions.
[image:6.612.73.290.550.678.2]6
ReferencesClimate Action Network-CAN. (2018) Off target Ranking of EU countries’ ambition and progress in fighting climate change. Available at: http://www.caneurope.org/docman/climate-energy-targets/3357-off-target-ranking-of-eu-countries-ambition-and-progress-in-fighting-climate-change/file (Accessed: November 18th, 2019).
Climate Action Tracker-CAT. (2019) Climate crisis demands more government action as emissions rise. Available at: https://climateactiontracker.org/documents/537/CAT_2019-06-19_SB50_CAT_Update.pdf (Accessed:
November 18th, 2019).
Empresa de Transmisión Eléctrica, S.A.-ETESA. (2015) Estado actual de las condiciones del Océano Pacífico y su posible evolución durante el año 2015-2016. Available at:
https://www.hidromet.com.pa/documentos/el_nio_2015_08_15.pdf (Accessed: November 18th, 2019).
Empresa de Transmisión Eléctrica, S.A-ETESA. (2018) Plan de Expansión del Sistema Interconectado Nacional 2018-2032. Tomo II. Plan Indicativo de Generación. Available at:
https://www.etesa.com.pa/documentos/tomo_ii__plan_indicativo_de_generacin_20182032_22-710094935.pdf
(Accessed: November 18th, 2019).
Intergovernmental Panel on Climate Change-IPCC. (2007) AR4 Climate Change 2007: Mitigation of Climate Change. Available at: https://www.ipcc.ch/report/ar4/wg3/ (Accessed: November 18th, 2019).
Intergovernmental Panel on Climate Change-IPCC. (2011) Renewable Energy Sources and Climate Change Mitigation. Available at: https://www.ipcc.ch/report/renewable-energy-sources-and-climate-change-mitigation/ (Accessed: November 18th, 2019).
Intergovernmental Panel on Climate Change-IPCC. (2014) AR5 Climate Change 2014: Mitigation of Climate Change. Available at: https://www.ipcc.ch/report/ar5/wg3/ (Accessed: November 18th, 2019).
Islam, M.R., Islam, M.R. and Beg, M.R.A. (2008) ‘Renewable energy resources and technologies practice in Bangladesh’, Renewable and Sustainable Energy Reviews, 12(2), pp. 299-343.
Jiang, X., Peters, G.P. and Green, C. (2019) ‘Global Rules Mask the Mitigation Challenge Facing Developing Countries’, Earth’s Future, 7(4), pp. 428-432.
Junfeng, L., Li, Z., Runqing, H., Zhengmin, Z., Jingli, S. and Yangin, S. (2002) ‘Policy analysis of the barriers to renewable energy development in the People’s Republic of China’. Energy for Sustainable Development, 6(3), pp. 11-20.
Lidula, N.W.A, Mithulananthan, N., Ongsakul, W., Widjaya, C. and Henson, R. (2007) ‘ASEAN towards clean and sustainable energy: Potentials, utilization and barriers’, Renewable Energy, 32(9), pp. 1441-1452.
Lorenzo, Ovidio. (2016) Varela ha cancelado una veintena de concesiones. Available at:
http://laestrella.com.pa/panama/nacional/varela-cancelado-veintena-concesiones/23917741 (Accessed: November 18th, 2019).
Martin, N.J. and Rice, J.L. (2012) ‘Developing renewable energy supply in Queensland, Australia: A study of the barriers, targets, policies and actions’, Renewable Energy, 44, pp. 119-127.
Ministerio de Ambiente-MiAmbiente. (2018) Tercera Comunicación Nacional Sobre Cambio Climático. Available at: https://unfccc.int/sites/default/files/resource/Tercera%20Comunicacion%20Nacional%20Panama.pdf (Accessed: November 18th, 2019).
Mirza, U.K., Ahmad, N., Harijan, K. and Majeed, T. (2009) ‘Identifying and addressing barriers to renewable energy development in Pakistan’. Renewable and Sustainable Energy Reviews, 13(4), pp. 927-931.
7
Panama NDC. (2016) Contribución Nacionalmente Determinada a la Mitigación del Cambio Climático de la Republica Panamá ante la Convención Marco de Naciones Unidas sobre Cambio Climático. UNFCCC. Available at:
https://www4.unfccc.int/sites/ndcstaging/PublishedDocuments/Panama%20First/PANAMA%20NDC.pdf
(Accessed: November 18th, 2019).
Rogeli, J., den Elzen, M., Höhne, N., Fransen, T., Fekete, H., Winkler, H., Schaeffer, R., Sha, F., Riahi, K. and Meinshausen, M.. (2016) ‘Paris Agreement climate proposals need a boost to keep warming well below 2 °C’,Nature, 534(7609), pp. 631-639.
Secretaria Nacional de Energia-SNE. (2016) Plan Nacional Energético 2015-2050. Available at:
http://www.energia.gob.pa/energia/wp-content/uploads/sites/2/2017/06/Plan-Energetico-Nacional-2015-2050.pdf
(Accessed: November 18th, 2019).
Secretaria Nacional de Energia-SNE. (2017) Un Sistema Energético en Transición: Actualización Plan Energético Nacional 2015-2050. Available at: http://www.energia.gob.pa/energia/wp-content/uploads/sites/2/2018/04/PEN-2017-Versi%C3%B3n-Final.pdf (Accessed: November 18th, 2019).
Sokolov, A., Paltsev, S., Chen, H. and Monier, E. (2016) ‘Climate Impacts of the Paris Agreement’,EGU General Assembly Conference Abstracts, 18, p. 8016.
United Nations Environment Programme-UNEP. (2016) The Emissions Gap Report 2016: A UNEP Synthesis Report. Available at: https://www.unenvironment.org/resources/emissions-gap-report-2016 (Accessed: November 18th, 2019).
Victor, D.G., Akimoto, K., Kaya, Y., Yamaguchi, M., Cullenward, D. and Hepburn, C. (2017) ‘Prove Paris was more than paper promises’,Nature, 548(7665), pp. 25–27.
Wiser, R.H. and Pickle, S.J. (1998) ‘Financing investments in renewable energy: the impacts of policy design’,
Renewable and Sustainable Energy Reviews, 2(4), pp. 361-386.
World Nuclear Association-WNA. (2011) Comparison of Lifecycle Greenhouse Gas Emissions of Various Electricity Generation Sources. Available at:
http://www.world-nuclear.org/uploadedFiles/org/WNA/Publications/Working_Group_Reports/comparison_of_lifecycle.pdf
(Accessed: November 18th, 2019).
8
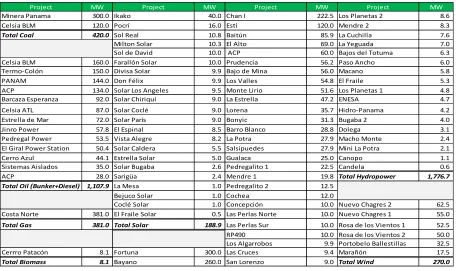
Project MW Project MW Project MW Project MW
Minera Panama 300.0 Ikako 40.0 Chan I 222.5 Los Planetas 2 8.6
Celsia BLM 120.0 Pocrí 16.0 Estí 120.0 Mendre 2 8.3
Total Coal 420.0 Sol Real 10.8 Baitún 85.9 La Cuchilla 7.6
Milton Solar 10.3 El Alto 69.0 La Yeguada 7.0 Sol de David 10.0 ACP 60.0 Bajos del Totuma 6.3 Celsia BLM 160.0 Farallón Solar 10.0 Prudencia 56.2 Paso Ancho 6.0 Termo-Colón 150.0 Divisa Solar 9.9 Bajo de Mina 56.0 Macano 5.8 PANAM 144.0 Don Félix 9.9 Los Valles 54.8 El Fraile 5.3 ACP 134.0 Solar Los Angeles 9.5 Monte Lirio 51.6 Los Planetas 1 4.8 Barcaza Esperanza 92.0 Solar Chiriquí 9.0 La Estrella 47.2 ENESA 4.7
Celsia ATL 87.0 Solar Coclé 9.0 Lorena 35.7 Hidro-Panama 4.2 Estrella de Mar 72.0 Solar París 9.0 Bonyic 31.3 Bugaba 2 4.0 Jinro Power 57.8 El Espinal 8.5 Barro Blanco 28.8 Dolega 3.1 Pedregal Power 53.5 Vista Alegre 8.2 La Potra 27.9 Macho Monte 2.4 El Giral Power Station 50.4 Solar Caldera 5.5 Salsipuedes 27.9 Mini La Potra 2.1 Cerro Azul 44.1 Estrella Solar 5.0 Gualaca 25.0 Canopo 1.1 Sistemas Aislados 35.0 Solar Bugaba 2.6 Pedregalito 1 22.5 Candela 0.6
ACP 28.0 Sarigüa 2.4 Mendre 1 19.8 Total Hydropower 1,776.7
Total Oil (Bunker+Diesel) 1,107.9 La Mesa 1.0 Pedregalito 2 12.5
Bejuco Solar 1.0 Cochea 12.0
Coclé Solar 1.0 Concepción 10.0 Nuevo Chagres 2 62.5 Costa Norte 381.0 El Fraile Solar 0.5 Las Perlas Norte 10.0 Nuevo Chagres 1 55.0
Total Gas 381.0 Total Solar 188.9 Las Perlas Sur 10.0 Rosa de los Vientos 1 52.5
RP490 10.0 Rosa de los Vientos 2 50.0 Los Algarrobos 9.9 Portobelo Ballestillas 32.5 Cerrro Patacón 8.1 Fortuna 300.0 Las Cruces 9.4 Marañón 17.5
Total Biomass 8.1 Bayano 260.0 San Lorenzo 9.0 Total Wind 270.0
Project 2019 Project 2021 Project 2023 Project 2026
Celsia BLM -160.0Solar Penonomé II 60.0Panama NG Power 670.0 Chan II 228.5
Termo-Colón -150.0Solar Prudencia 21.4Martano 458.1 Total Hydropower 228.5
El Giral Power Station -144.0Solar Gualaca 17.3Total Gas 1,128.1
Cerro Azul -134.0Jagüito 10.0El Sindigo 10.0 Project 2028
ACP -92.0Farrallón Solar II 5.1La Herradura 5.5Tizingal 5
Total Oil (Bunker+Diesel) -680.0Total Solar 113.8 Total Hydropower 15.5 Total Hydropower 5
Providencia Solar 10.0Chuspa 8.8 Toabre III 22.0
Pacora II 4.0Colorado 6.7 Project 2024 Total Wind 22.0
Total Solar 14.0 Total Hydropower 15.5 Solar Coclé 04 9.0
Viento Sur 115.2Solar Herrera 01 8.0 Project 2029
Project 2020 Total Wind 115.2 Total Solar 17.0 Solar Chiriquí 20 71.0
Solar Penonomé I 60.0 San Bartolo 20.4Total Solar 71.0
Bajo Frío Solar 20.0 Project 2022 Total Hydropower 20.4
Don Félix II 8.0Solar Chiriquí 19 52.0Toabre II 22.0 Project 2030
Total Solar 87.9 Solar Coclé 12 10.0Total Wind 22.0 Solar Chiriquí 18 46.0
Pando 37.0Total Solar 62.0 Solar Cocle 23 5.0
San Andres 9.9Burica 65.3 Project 2025 Solar Cocle 09 5.0
Total Hydropower 46.9 Cotito 5.0El Recodo 10Total Solar 56.0
Toabré I 60.0 Barriles 1.0Total Hydropower 10
Total Wind 60.0 Total Hydropower 71.3 Plants in disuse (CF<0.5%)
Eólico Chiriquí 01 19.8 ETESA Alternative Scenario I
Total Wind 19.8 ASEP Resolutions
[image:9.612.72.528.93.364.2]Exhibits
Table 1. Detailed installed capacity 2018
[image:9.612.71.526.391.640.2]Source: SNE Website. Capacidad Instalada, Firme, Generacion Bruta
9
Year 2019 2020 2021 2022 2023 2024 2025 2026 2027 2028 2029 2030
GWh 12,091 12,840 13,587 14,301 15,104 15,956 16,831 17,736 18,695 19,706 20,817 21,988
Technology 2019 2020 2021 2022 2023 2024 2025 2026 2027 2028 2029 2030
Coal 1,840 1,840 1,840 1,840 1,840 1,840 1,840 1,840 1,840 1,840 1,840 1,840 Oil 721 1,046 1,340 1,654 - - - - - 900 1,924 3,027 Gas 1,669 1,669 1,669 1,669 4,065 4,767 5,602 5,607 6,565 6,610 6,610 6,610 Biomass 18 18 18 18 18 18 18 18 18 18 18 18 Solar 249 357 496 572 572 593 593 593 593 593 680 749 Hydropower 7,004 7,188 7,250 7,531 7,592 7,672 7,712 8,612 8,612 8,631 8,631 8,631 Wind 591 723 975 1,018 1,018 1,067 1,067 1,067 1,067 1,115 1,115 1,115 Total: 12,091 12,840 13,587 14,301 15,104 15,956 16,831 17,736 18,695 19,706 20,817 21,988
Energy Generation (GWh) 2019 - 2030
Technology 2019 2020 2021 2022 2023 2024 2025 2026 2027 2028 2029 2030
Coal 1,508,472 1,508,472 1,508,472 1,508,472 1,508,472 1,508,472 1,508,472 1,508,472 1,508,472 1,508,472 1,508,472 1,508,472
Oil 529,966 768,848 985,141 1,215,600 - - - - - 661,658 1,414,096 2,224,743
Gas 817,702 817,702 817,702 817,702 1,991,622 2,335,650 2,744,917 2,747,422 3,216,940 3,238,830 3,238,830 3,238,830
Biomass 4,080 4,080 4,080 4,080 4,080 4,080 4,080 4,080 4,080 4,080 4,080 4,080
Solar 11,946 17,123 23,822 27,472 27,472 28,472 28,472 28,472 28,472 28,472 32,652 35,948
Hydropower 168,086 172,522 173,992 180,738 182,202 184,136 185,083 206,697 206,697 207,137 207,137 207,137
Wind 6,504 7,950 10,725 11,202 11,202 11,732 11,732 11,732 11,732 12,262 12,262 12,262
Total: 3,046,755 3,296,696 3,523,935 3,765,265 3,725,050 4,072,541 4,482,756 4,506,875 4,976,393 5,660,911 6,417,529 7,231,473
tCO2eq Emissions 2019 - 2030
Technology 2019 2020 2021 2022 2023 2024 2025 2026 2027 2028 2029 2030
Coal 420 420 420 420 420 420 420 420 420 420 420 420 Oil 428 428 428 428 428 428 428 428 428 428 428 428 Gas 381 381 381 381 1,509 1,509 1,509 1,509 1,509 1,509 1,509 1,509 Biomass 8 8 8 8 8 8 8 8 8 8 8 8 Solar 203 291 405 467 467 484 484 484 484 484 555 611 Hydropower 1,777 1,824 1,839 1,910 1,926 1,946 1,956 2,185 2,185 2,189 2,189 2,189 Wind 270 330 445 465 465 487 487 487 487 509 509 509 Total: 3,487 3,681 3,926 4,079 5,223 5,282 5,292 5,521 5,521 5,547 5,618 5,674
Installed Capacity (MW) 2019 - 2030
Table 3. Installed capacity by technology 2019-2030
Table 4. Electricity generation 2019-2030
[image:10.612.72.527.294.431.2]Source: SNE Website. Transmision Electrica
Table 5. Electricity generation by technology 2019-2030
[image:10.612.74.527.459.576.2]T