Visualizing and Curating Knowledge Graphs
over Time and Space
Tong Ge1, Yafang Wang1∗, Gerard de Melo2, Haofeng Li1, Baoquan Chen1 1Shandong University, China;2Tsinghua University, China
Abstract
Publicly available knowledge repositories, such as Wikipedia and Freebase, benefit significantly from volunteers, whose con-tributions ensure that the knowledge keeps expanding and is kept up-to-date and accu-rate. User interactions are often limited to hypertext, tabular, or graph visualization in-terfaces. For spatio-temporal information, however, other interaction paradigms may be better-suited. We present an integrated system that combines crowdsourcing, au-tomatic or semi-auau-tomatic knowledge har-vesting from text, and visual analytics. It enables users to analyze large quantities of structured data and unstructured textu-al data from a spatio-temportextu-al perspective and gain deep insights that are not easily observed in individual facts.
1 Introduction
There has been an unprecedented growth of pub-licly available knowledge repositories such as the Open Directory, Wikipedia, Freebase, etc. Many additional knowledge bases and knowledge graphs are built upon these, including DBpedia, YAGO, and Google’s Knowledge Graph. Such repositories benefit significantly from human volunteers, whose contributions ensure that the knowledge keeps ex-panding and is kept up-to-date and accurate.
Despite the massive growth of such structured data, user interactions are often limited to sim-ple browsing interfaces, showing encyclopedic tex-t witex-th hyperlinks, tex-tabular listex-tings, or graph visu-alizations. Sometimes, however, users may seek a spatio-temporal perspective of such knowledge. Given that the spatio-temporal dimensions are fun-damental with respect to both the physical world
∗
The corresponding author:[email protected]
and human cognition, they constitute more than just a particular facet of human knowledge. Of course, there has been ample previous work on spatio-temporal visualization. However, most pre-vious work either deals with social media (Ardon et al., 2013) rather than knowledge repositories, or focuses on geo-located entities such as buildings, cities, and so on (Hoffart et al., 2011a).
From a data analytics perspective, however, much other knowledge can also be analyzed spatio-temporally. For example, given a person like Napoleon or a disease such as the Bubonic Plague, we may wish to explore relevant geographical dis-tributions. This notion of spatio-temporal analytics goes beyond simple geolocation and time metadata.
In fact, the relevant spatio-temporal cues may need to be extracted from text. Unfortunately, accu-rate spatio-temporal extraction is also a challenging task (Wang et al., 2011b). Most existing informa-tion extracinforma-tion tools neglect spatio-temporal infor-mation and tend to produce very noisy extractions. It appears that the best strategy is to put the hu-man in the loop by combining knowledge harvest-ing with methods to refine the extractions, similar to YALI (Wang et al., 2013), a browser plug-in that calls AIDA (Hoffart et al., 2011b) for named entity recognition and disambiguation (NERD) in a real-time manner. That system transparently collects user feedback to gather statistics on name-entity pairs and implicit training data for improving N-ERD accuracy.
Overall, we observe that there is a need for more sophisticated spatio-temporal knowledge analytics frameworks with advanced knowledge harvesting and knowledge visualization support. In this paper, we present an integrated system to achieve these goals, enabling users to analyze large amounts of structured and unstructured textual data and gain deeper insights that are not easily observed in indi-vidual facts.
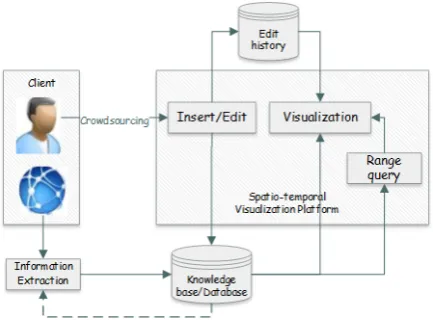
Figure 1: System architecture
2 Architecture
Figure 1 depicts the overall architecture of our sys-tem. Spatio-temporal events come from three d-ifferent sources: crowdsourcing, information ex-traction, and existing knowledge repositories. Our system provides users with interfaces to enter textu-al information, videos, and images of events. The crowdsourced events are used as seed facts to ex-tract additional spatio-temporal event information from the Internet. We describe this in more de-tail in Section 3. The extracted spatio-temporal facts are stored in the knowledge base. Both the crowdsourced facts and the extracted facts are pre-sented visually in the visualization platform. Users can browse as well as edit the event information. Finally, the system comes pre-loaded with events taken from the Web of Data, particularly the YA-GO (Suchanek et al., 2007) knowledge base, which contains events from different categories that serve as seed data for the platform.
The system maintains the edit history for every event, allowing users to revert any previous modifi-cation. Moreover, users’ personal activity logs are also captured and are available for browsing.
Relevant spatio-temporal events are simultane-ously visualized with a map and on a timeline. A heat-map is added as the top layer of the map to re-flect the distribution and frequency of events. There is also a streaming graph and line chart visualiza-tion enabling the user to analyze events based on their frequency. These may allow the user to dis-cover salient correlations.
System Implementation. Our system is
imple-mented in Java, with Apache Tomcat1as the Web server. While parsing text documents, we rely on OpenNLP2for part-of-speech tagging, lemmatiz-ing verbs, and stemmlemmatiz-ing nouns. All data are stored in a PostgreSQL3database. The maps used in our system are based on OpenStreetMap4.
3 Spatio-Temporal Knowledge Harvesting
Spatio-Temporal Facts. Crowdsourcing is just one way to populate the spatio-temporal knowl-edge in our system. Additional facts are semi-automatically mined from the Web using informa-tion extracinforma-tion techniques. We build on previous work that has developed methods for extracting temporal facts (Wang et al., 2011a), but extend this line of work to also procure spatial facts.
Our aim is to extract spatio-temporal factual knowledge from free text. A fact here consists of a relation and two arguments, as well as optional temporal and spatial attributes. For instance, the spatio-temporal fact
playsForClub(Beckham; Real Madrid) @<[2003,2008);Spain>
expresses that Beckham played for Real Madrid from 2003 to 2007 in Spain. Temporal attributes involve either a time interval or a time point, indi-cating that the fact applies to a specific time period or just a given point in time, respectively. Spatial attributes are described in terms of a disambiguated location name entity. For example, “Georgia” often refers to the country in Europe, but may also refer to the state with the same name in the US. Thus, we use disambiguated entity identifiers.
Pattern Analysis. The extraction process s-tarts with a set of seed facts for a given rela-tion. For example, playsForClub(Beckham; Re-al Madrid)@<[2003,2008);Spain> would be a valid seed fact for theplaysForClubrelation. The input text is processed to construct a pattern-fact graph. Named entities are recognized and disam-biguated using AIDA (Hoffart et al., 2011b). When a pair of entities matches a seed fact, the surface string between the two entities is lifted to a pattern. This is constructed by replacing the entities with
placeholders marked with their types, and keep-ing only canonical lemmatized forms of nouns and verbs as well as the last preposition. We use n-gram based feature vectors to describe the pattern-s (Wang et al., 2011a).
For example, given a sentence such as “Ronal-do signed for Milan from Real Madrid.”, Milan is disambiguated as A.C. Milan. The corresponding pattern for leaving Real Madrid is “sign forhclubi
from”. Each pattern is evaluated by investigating how frequent the pattern occurs with seed facts of a particular relation. The normalized value (between 0 and 1) is assigned as the initial value for each pattern, for thefact extractionstage.
Fact Candidate Gathering. Entity pairs that match patterns whose strength is above a minimum threshold become fact candidates and are fed in-to the fact extraction stage of label propagation. Temporal and spatial expressions occurring within a window ofkwords in the sentence are consid-ered as the temporal or spatial attribute of the fact candidate (Wang et al., 2011a). These fact candi-dates may have both temporal and spatial attributes simultaneously.
Fact Extraction. Building on (Wang et al., 2011a), we utilize Label Propagation (Talukdar and Crammer, 2009) to determine the relation and observation type expressed by each pattern. We create a graphG= (VF∪VP, E)with one vertex
v∈VFfor each fact candidate observed in the text and one vertexv ∈ VP for each pattern. Edges betweenVFandVPare introduced whenever a fact candidate appeared with a pattern. Their weight is derived from the co-occurrence frequency. Edges among VP nodes have weights derived from the n-gram overlap of the patterns.
LetLbe the set of labels, consisting of the rela-tion names plus a special dummy label to capture noise. Further, letY ∈R|V|×|L|+ denote the graph’s initial label assignment, andYb ∈ R|V|×|L|+ stand for the estimated labels of all vertices,Slencode the seeds’ weights on its diagonal, andR∗lbe a ma-trix of zeroes except for a column for the dummy label. Then, the objective function is:
L(Y) =b X `
"
(Y∗`−Yb∗`)TS`(Y∗`−Yb∗`) +µ1YbT∗`LYb∗`+µ2kYb∗`−R∗`k2
#
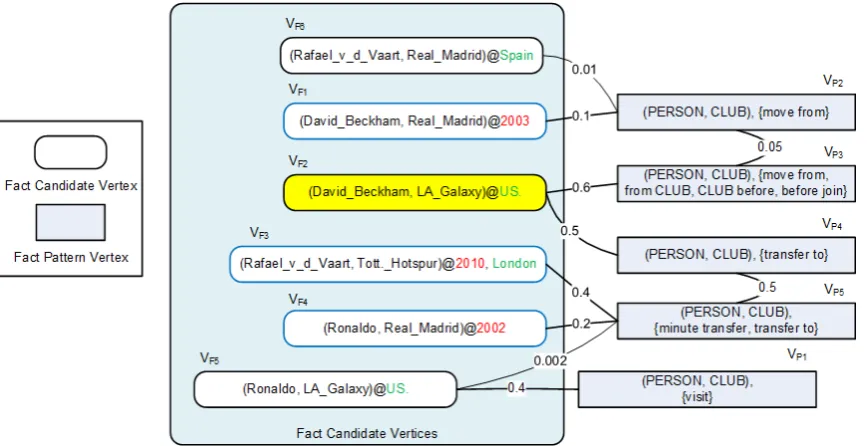
(1) Figure 2 shows an example of a pattern-fact
graph. Existing events in the database serve as seeds in the graph. For instance, playsFor-Club(David Beckham, LA Galaxy)@US is a seed fact in the example, which will propagate the la-belplaysForClubto other nodes in the graph. After optimizing the objective, the fact candidates which bear a relation’s label with weight above a threshold are accepted as new facts (Wang et al., 2011a). These facts, which may include temporal or spatial or both kinds of attributes, are stored in the database with provenance information, and can subsequently be used in several kinds of visualiza-tions.
4 Data Visualization and Analytics
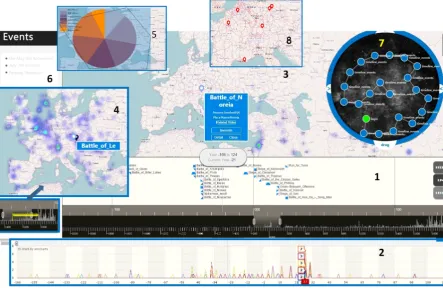
Our system enables several different forms of visu-al anvisu-alytics, as illustrated in Figure 3, which com-bines several different screenshots of the system. Spatio-Temporal Range Queries. Users may is-sue range queries for both temporal and spatial knowledge. In Figure 3, Screenshots 1, 3, and 4 show results of temporal range queries, while Screenshot 5 shows the result of a spatial range query. After choosing a particular span on the time-line at the bottom, the events relevant for the select-ed time interval are displayselect-ed both on a temporal axis and on the map. A heat-map visualizes the frequency of events with respect to their geograph-ical distribution. Users may also scroll the timeline to look at different events. The events shown on the map dynamically change when the scrollbar is moved. In Screenshot 1, we see that items on the timeline are shown with different symbols to indi-cate different indi-categories of events. Screenshots 3 and 4 show results from different time intervals. If users choose a spatial range by drawing on the map, any events relevant to this geographical area during the selected time interval are retrieved. Screenshot 5 shows how the system can visualize the retrieval results using a pie chart. The area highlighted in blue is the bounding box of the polygon, as deter-mined within Algorithm 1. The different colors in the pie chart indicate different event categories and their relative frequency.
Figure 2: Spatio-temporal pattern-fact graph
Algorithm 1 Spatial range query algorithm
Input: spatial polygon on the mapP, event databaseE
Output: events in the polygon.
1: minx←minimum latitude of all points ofP .Get bounding box of polygonP 2: maxx ←maximum latitude of all points ofP
3: miny ←minimum longitude of all points ofP 4: maxy ←maximum longitude of all points ofP
5: EP ={e∈E | minx≤e.x≤maxx∧miny ≤e.y≤maxy} .Query event database
6: ED←edges of polygonP .Get edges of polygon
7: foreache∈EP do 8: line←(x, y;−∞, y)
9: ifenot located on the edges∧lineintersectsEDwith even numbersthen
10: EP ←EP −e
11: returnEP
window appears on top of the map near the relevant location. Normally, this window simply provides the entity label, as in Screenshot 4, while detailed information about the event is displayed in the side-bar on the left, as in Screenshot 6. However, when the user moves the cursor over the label, it expands and additional information is displayed. For an example of this, see Screenshot 3, which shows in-formation for the “Battle of Noreia”. There are also links for related videos and images. If there is no interaction with a pop-up window for an extended period of time, it is made transparent. When users move the cursor above an event on the timeline, an icon on the map pops up to provide the location and name of that event. At the same time, an icon is displayed in the histogram, which is located
be-neath the timeline. With these coupled effects, the user simultaneously obtains information about both the accurate location on the map and the accurate time point within the timeline (see Screenshot 4).
Users can also scroll the map to navigate to places of interest, and observe how frequently rele-vant events happen in that area, as visualized with the heat-map. When the user double clicks on a location on the map, all the events pertaining to that location are shown on the left of the window. Screenshot 6 shows three events that occurred in Beijing. Further details for each event are displayed if the user clicks on them.
impor-5
Figure 3: User interface screenshots
tant events related to Napolean are displayed on the map.
Visual Analytics. Users may use the line chart on the timeline and the heat-map to jointly inspect statistics pertaining to the retrieved events. For in-stance, Screenshot 2 shows the results as displayed in the line chart on the timeline. Different colors here refer to different event categories. As the user moves the time window at the bottom of the time-line, events on the timeline and maps are updated. The histogram at the bottom of the timeline shows the overall event statistics for the current state of the knowledge base. Each column refers to the number of events for a given five year interval. The heat-map changes profoundly when transitioning from Screenshot 3 to Screenshot 4, especially for Europe. The total number of events increases as well. The line chart visualization of events on the timeline5supports zooming in and out by adjust-ing the time interval. Hence, it is not necessary to initiate a new query if one wishes to drill down on particular subsets of events among the query results.
Adding/Editing Event Information. After
log-5We use the line chart developed by AmCharts www.
amcharts.com/
ging into the system, users can enter or update event information. Our system provides an inter-face to add or edit textual information, images, and videos for events. This can be used to extend cur-rent text-based knowledge bases into multimodal ones (de Melo and Tandon, 2016).
The system further also stores the patterns from the extraction component. Hence, users can track and investigate the provenance of extracted facts in more detail. They can not only edit or remove noisy facts but also engage in a sort of debugging process to correct or remove noisy patterns. Corrected or deleted patterns and facts provide valuable feed-back to the system in future extraction rounds.
back to any earlier step. Screenshot 7 shows the use of a graph visualization to depict all the operations of a user after login. This same data can also be used for studying user behavior.
Furthermore, similarly to Wikipedia, the tool captures the complete edit history for a particular event. The interface for this uses a tabular form, not shown here due to space constraints. Wikipedi-a’s edit history has seen a rich number of uses in previous research. For instance, one can study the evolution of entity types or the time of appearance of entities and their geographical distribution. Providing Ground-Truth Data for Relation Ex-traction Evaluation. Our system continuously gathers ground-truth information on factual events (especially spatio-temporal facts) based on user contributions. The knowledge in our system con-sists of relations of interest: event happened in place, eventhappened ondate, personis related toperson, personis related toevent, etc. This can serve as a growing basis for systematically evalu-ating and comparing different relation extraction methods and systems, going well beyond currently used benchmarks.
Historical Maps. Geographical boundaries are fluid. For instance, countries have changed and borders have evolved quite substantially during the course of history. Our system allows uploads of historical map data to reflect previous epochs. Sub-sequently, users can choose to have our system display available historical maps rather than the s-tandard map layer, based on the temporal selection.
5 Conclusion
We have presented a novel integrated system that combines crowdsourcing, semi-automatic knowl-edge harvesting from text, and visual analytics for spatio-temporal data. Unlike previous work, the system goes beyond just showing geo-located enti-ties on the map by enabling spatio-temporal analyt-ics for a wide range of entities and enabling users to drill down on specific kinds of results. The system combines user contributions with spatio-temporal knowledge harvesting in order to enable large-scale data analytics across large amounts of data. Given the broad appeal of Wikipedia and similar websites, we believe that this sort of platform can serve the needs of a broad range of users, from casually inter-ested people wishing to issue simple queries over the collected knowledge all the way to experts in
digital humanities seeking novel insights via the system’s advanced knowledge harvesting support. Acknowledgments
This project was sponsored by National 973 Pro-gram (No. 2015CB352500), National Natural Sci-ence Foundation of China (No. 61503217), Shan-dong Provincial Natural Science Foundation of Chi-na (No. ZR2014FP002), and The Fundamental Re-search Funds of Shandong University (No. 2014T-B005, 2014JC001). Gerard de Melo’s research is supported by China 973 Program Grants 2011C-BA00300, 2011CBA00301, and NSFC Grants 61033001, 61361136003, 61550110504.
References
Sebastien Ardon, Amitabha Bagchi, Anirban Mahanti, Amit Ruhela, Aaditeshwar Seth, Rudra Mohan Tri-pathy, and Sipat Triukose. 2013. Spatio-temporal and events based analysis of topic popularity in Twit-ter. InCIKM, pages 219–228.
Gerard de Melo and Niket Tandon. 2016. Seeing is be-lieving: The quest for multimodal knowledge.ACM SIGWEB Newsletter, 2016(Spring).
Johannes Hoffart, Fabian M. Suchanek, Klaus Berberich, Edwin Lewis-Kelham, Gerard de Melo, and Gerhard Weikum. 2011a. YAGO2: Exploring and querying world knowledge in time, space, con-text, and many languages. InWWW.
Johannes Hoffart, Mohamed Amir Yosef, Ilaria Bor-dino, Hagen F¨urstenau, Manfred Pinkal, Marc S-paniol, Bilyana Taneva, Stefan Thater, and Gerhard Weikum. 2011b. Robust disambiguation of named entities in text. InEMNLP.
Fabian M. Suchanek, Gjergji Kasneci, and Gerhard Weikum. 2007. Yago: A Core of Semantic Knowl-edge. InWWW.
Partha Pratim Talukdar and Koby Crammer. 2009. New regularized algorithms for transductive learn-ing. InECML PKDD, pages 442–457.
Yafang Wang, Bin Yang, Lizhen Qu, Marc Spaniol, and Gerhard Weikum. 2011a. Harvesting facts from tex-tual web sources by constrained label propagation. InCIKM, pages 837–846.
Yafang Wang, Bin Yang, Spyros Zoupanos, Marc Span-iol, and Gerhard Weikum. 2011b. Scalable spatio-temporal knowledge harvesting. In WWW, pages 143–144.