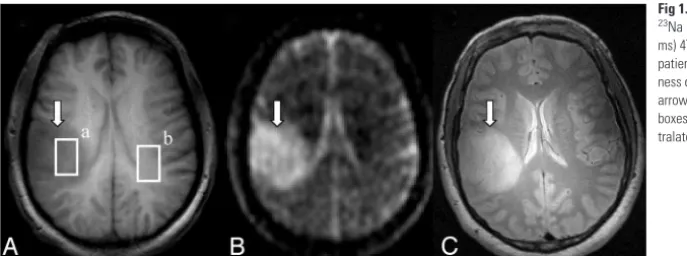
Low Grade Glioma: Correlation of Short Echo Time 1H MR Spectroscopy with 23Na MR Imaging
Full text
Figure


Related documents
(Molecular Structure Corporation, 1999); cell re®nement: MSC/AFC Diffractometer Control Software; data reduction: TEXSAN for Windows (Molecular Structure Corporation, 1999);
The answer to whether doctors play an active role in information sharing with women about the ultrasound scans offered, is a complex one as what has emerged from the study is
In terms of physical measures required, an important point is that the threshold between the need for no intervention to the fabric of the building and the need for
Data collection: SMART (Bruker, 1999); cell re®nement: SMART ; data reduction: SAINT (Bruker, 1999); program(s) used to solve structure: SHELXS 97 (Sheldrick, 1997); program(s) used
For these molecules, the rigidity of the polycyclic core is demonstrated by the small range of dihedral angles found between pairs of mean planes de®ned as follows: plane 1 is
Diethyl 4-phenylthieno[2,3- b ]pyridine-2,5-dicarboxylate (2 mmol) was mixed with 20 ml of 10% aqueous sodium hydroxide and the mixture was re¯uxed vigorously until all the solid
(Molecular Structure Corporation, 1992); cell re®nement: MSC/AFC Diffractometer Control Software ; data reduction: TEXSAN (Mole- cular Structure Corporation, 1985); program(s) used
managed to tell their stories with the clarity that was hoped for, Some exhibitors were uncertain about how the exhibition differed from other forms of publication and missed
