Experimental Investigation of Performance of the Wind
Turbine with the Flanged-Diffuser Shroud in Sinusoidally
Oscillating and Fluctuating Velocity Flows
Kazuhiko Toshimitsu1, Hironori Kikugawa1, Kohei Sato2, Takuya Sato1 1Department of Mechanical Engineering, Oita National College of Technology, Oita, Japan
2Department of Mechanical Engineering, Kyushu University, Fukuoka, Japan Email: [email protected]
Received September 9, 2012; revised October 15, 2012; accepted October 26, 2012
ABSTRACT
The wind turbine with a flanged-diffuser shroud—so called “wind-lens turbine”—is developed as one of high perform-ance wind turbines by Ohya et al. In this paper, the wind turbine performance is investigated for both steady and un-steady winds. The compact-type wind lens turbine shows higher efficiency than the only rotor wind turbine. Also, the flow structure around the compact-type wind turbine is made clear by CFD and PIV in steady wind. Furthermore, the performances of the only rotor and the compact-type wind-lens turbines for unsteady wind are experimentally and nu-merically investigated. Experimental and numerical results are presented to demonstrate the dependence of frequency of the harmonic oscillating velocity wind on power coefficient. Consequently, the compact-type wind-lens turbine show better performance than the only rotor one in sinusoidally oscillating velocity wind. Furthermore, the numerical estima-tion can predict the power coefficient in the oscillating flows to an accuracy of 94% to 102%. In addiestima-tion, the depend-ence of the turbine performance on turbulent intensity and vortex scale of natural fluctuating wind is presented.
Keywords: Wind Turbine; Unsteady Flow; Wind Energy; Power Coefficients; Flanged Diffuser; Natural Wind
1. Introduction
It is important issue that a wind power generation is im- proved to raise the efficiency as one of natural energy sources in order to promote the usage of sustainable en- ergy. According to the background, the wind turbine with a flanged-diffuser shroud—so called “wind-lens turbine” —is developed as one of high performance wind turbines by Ohya et al. [1]. In particular, the wind-lens turbine can generate electric power even in low velocity wind since the flanged-diffuser shroud increases the wind ve- locity at rotor. For the long and compact type wind lens turbines, we studied the detail flow structure around the wind turbine with a particle image velocimetry in au- thors’ previous work [2]. Recently, research subjects of wind turbines in unsteady flows become important, which are the effects of fluctuating wind velocity and flow direction, non-uniform inflow, turbulence and other factors. They influence the performance and fatigue problem. In particular, wind in Japan is more unstable than western country, namely wind velocity and flow direction are easy to fluctuate. Thus it is important that the characteristics of the turbines in unsteady wind should be made clear. In previous concerned works, the
numerical performance estimation of the oscillating wind velocity is proposed by Karasudani et al. [3-5].
In this paper, we will focus on the effect of the fluctu- ating wind velocity upon the wind turbine performance. The performances of the ordinary rotor wind turbine and the compact-type wind-lens turbine in harmonic oscillat- ing velocity wind are experimentally and numerically investigated. In particular, experimental and numerical results are presented to demonstrate the dependence of the wind velocity frequency on power coefficient of the wind turbines. Furthermore, the effects of the turbulent intensity and vortex scale in natural fluctuating velocity wind on the turbines performance are studied.
2. Experimental Apparatus
2.1. Wind Turbine Model
NACA63218 at root to NACA63212 at tip along a span. The specific dimensions of the diffusers and the rotor are listed in Tables 1 and 2 respectively.
2.2. Measurement System of the Wind Turbine Performance
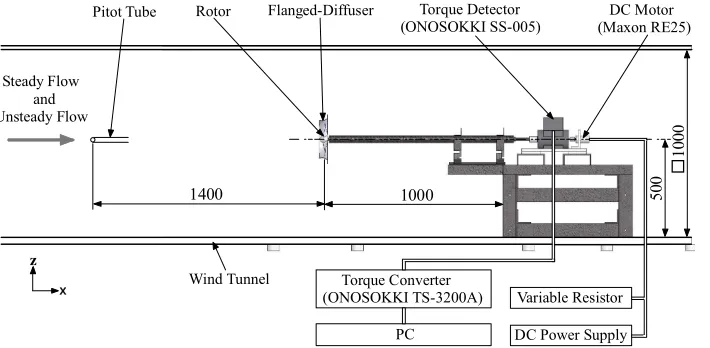
The torque and rotational speed of the rotor are measured by the experimental apparatus as shown in Figure 2. The wind turbines are set up at the center of cross section of the wind tunnel. The wind turbine power measurement system is consisted of the torque detector, the rotational speed sensor, the torque converter, the DC motor and the DC power supply. The DC motor and the DC power supply work as a power generator, which control the ro- tor load and the rotational speed. Here the generated air flow is actively controlled by the 66 fans of the multi-fan wind tunnel in ONCT.
3. Wind Turbines Performance in Steady
Flow
3.1. Power Coefficients of the Wind Turbines in Steady Flow
The power coefficients of wind turbine are defined by
3 2 w
P C
AU
, (1)
where P, , A and A denote generated power of a wind turbine, fluid density, wind receiving area and the upstream wind velocity, respectively. The power coeffi- cients of the only rotor and the compact-type wind tur- bines are normalized by the rotor swept area π 2 4
r A D m2 and the flange circular area
2
10
2.96 π 2 4
r A D m2, respectively. It is found that the maxi-
mum power coefficients w of the compact-type wind turbines are 1.5 times as large as the only rotor in Figure 3. It means that the wind-lens turbine clearly shows
2
10 5.56
C
higher efficiency than the conventional wind turbine.
3.2. Flow Structures around the Wind-Lens Turbines in Steady Flow
The importance of the flow structures behind the wind- lens turbines was pointed out to increase the velocity at ro- tor in the previous papers [1,2]. In order to investigate the mechanism of the increasing flow velocity at the rotor,
φ
20
6
D
=
20
0
φ
22
6
DF
=
φ
26
6
L=45
27
h
=
20
Dh
=
40
ht
=
3
[image:2.595.327.522.199.310.2]
Figure 1. Schematics and photograph of the compact-type wind turbine with the flanged-diffuser shroud.
Table 1. Dimensions of the wind turbine with the flanged- diffuser shroud.
Tip clearance, ht 3 mm (h Dt = 1.5%)
Diffuser length, L D 0.225
Flange height, h D 0.1
Table 2. Dimensions of the rotor blades.
Rotor diameter Dr (= 2r) 194 mm
Hub to tip ratio D D h 0.2
Design tip-speed ratio Dr U 3.7, 5.0
Blade profiles NACA63218 (root) - NACA63212 (tip)
Rotor Flanged-Diffuser Torque Detector
(ONOSOKKI SS-005)
Wind Tunnel
50
0 □
10
00
Steady Flow and Unsteady Flow
z
x
PC Torque Converter
(ONOSOKKI TS-3200A) Variable Resistor DC Motor (Maxon RE25)
1400 Pitot Tube
1000
[image:2.595.310.538.380.430.2]DC Power Supply
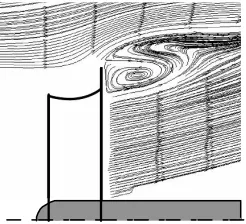
[image:2.595.122.477.543.717.2]herewith we present an experimental andnumerical time- average streamlines around the compact-type wind tur-bine at the tip-speed ratio = 3.9 and mean velocity
U = 7 m/s. The experiment l streamline by PIV meas- ement is shown in Figure 4. Also the CFD analysis with the commercial software ANSYS CFX 12 is pre- sented in Figure 5. The numerical analysis is based on the 2nd order upwind implicit scheme for the conserva- tion equation and k
a ur
turbulence model. Figure 6 shows the multi-bloc mesh for the numerical analy- sis, which is consisted of 6.4 million nodes. The rotor mesh block rotates at 2700 rpm. The boundary conditions are identified as the inflow conditions of
k 3-D
U = 7 m/s, the exit pressure of 101.3 kPa, slip flows on the outside walls and nonslip flows on the rigid object surfaces.
The vortex structure behind the flange of both PIV and C
ing
In xperimentally and numerically dis-
oidally
The f the wind turbine is un-
FD results qualitatively agree with. Twin vortices are found behind the flange. According to the results, the flow structure is illustrated in Figure 7. The vortex “A” behind the flange mainly caused the low pressure region. Thus it increases the wind velocity at rotor. The maxi- mum velocity at rotor surface is calculated 9.5 m/s as velocity rising.
4. Performance in Sinusoidally Oscillat
Velocity Flow
this chapter, we e
cuss the performance of the wind turbine in sinusoidally oscillating velocity wind.
4.1. Experimental Conditions of Sinus Oscillating Flow to Investigate the Wind Turbine Performance
upstream wind velocity o
dergoing identical harmonic oscillation as follow,
sin 2
π
[image:3.595.362.485.85.197.2]U t U u ft . (2)
[image:3.595.360.488.222.347.2]Figure 4. Time average meridional streamlines by PIV.
Figure 5. Time average meridional streamlines by the pre- sent CFD.
7.5D 10D
D
[image:3.595.333.508.390.557.2]2.5D 10 D
Figure 6. Multi-blocks unstructured mesh for calculation.
Flow
Hub
Rotor
Flange Diffuser
Throat
Vortex A causes the low-pressure region Generated vortex B by the flange
[image:3.595.80.273.520.706.2]Inlet region
Figure 7. Schematic flow structures around the wind-lens turbine in steady wind.
Figure 3. Relationship of power coefficients and tip peed ratio in the steady wind velocity 5 m/s.
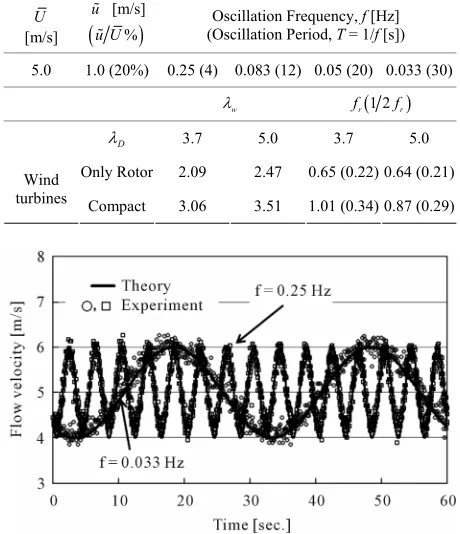
[image:3.595.331.509.582.707.2]The performances of the wind turbines are investigated as the upstream mean velocities U = 5 m/s with oscil- lating amplitudes = 1.0 m/s. The wind velocity os- cillates at frequen f = 0.033, 0.05, 0.083 and 0.25 Hz. Detail data are listed Table 3. The time histories of the oscillating wind v cities at
u
cies in
elo U = 5 m/s and = 1.0 m/s with f = 0.25 and 0.033 Hz are shown in Figure 8, which are measured at 1.4 m upstream location from the wind turbine front by a L-type Pitot tube. It is found that the experimental wind correctly oscillates with th spe-
s
u
e cific conditions.
The characteristic frequency of the oscillating wind based on the turbine rotor dynamic response and the power coefficient in steady wind i proposed by Karasu- dani et al. [4] as follow,
4
2 3 π
2
w w
r
r C U
f
I
, (3)
where
w
[image:4.595.57.287.441.708.2], r, I, w and Cw
w mean fluid den- sity, rotor radius, moment of rotor inertia, the tip-speed ratio at the maximum power coefficient and the esti- mated power coefficient integrated the power coeffi- cients in the steady flow, respectively. (The details of theTable 3. Conditions of oscillating winds and turbine char- acters.
numerical treatment are described in the later Section 4.3.) The moment of inertia of the rotor is I = 1.52 × 10⁻⁴
kgm2. Equation (3) has the basic assumptions which the
U [m/s]
[m/s] u
uU%
(OscilOscillation Frequency, lation Period, T = 1/f [Hz] f [s]) 5.0 1.0 (20%) 0.25 (4) 0.083 (12) 0.05 (20) 0.033 (30)w
fr1 2fr
D
3.7 5.0 3.7 5.0
Only Rotor 2.09 2.47 0.65 (0.22) 0.64 (0.21)
Wind
turbines Compact 3.06 3.51 1.01 (0.34) 0.87 (0.29)
Figure 8. Comparison of experimental and theoretical os- cillating wind velocities in the wind tunnel.
rotor response is the quasi-steady state and turbine rotor torque is depended only on tip-speed ratio [3,4]. In other words, the flow transient time which the flow field around the rotor corresponds with the oscillation wind is sufficiently small, thus the quasi-steady state is satisfied. It means that the turbine rotor can responsively rotates to the fluctuating wind velocity for f fr.
in r
Here sist that the real
, we should mention that Karasudani et al.
only rotor turbine does respond fo f fr 3 by nu-
merical simulation [4].
We are going to examine whether the quasi-steady re- sponse can be applied to this equipment. Let the rotor
decreases to 1
als abo
illating p
. Consequently, the flow d
Os
speed be 3000 rpm, i.e. the time of one rotation be
r
t =0.02 seconds. If the inflow velocity
m/s, the flow pass at the rotor tip of the thickness 2 mm for tbp= 2 × 10⁻³ seconds. Since the time tbp is suffi-
ciently smaller than tr, thus the flow field around the ro- tor can enough changed during one rotation. Furthermore the rotor blade passing time trp of the wind should be sufficiently smaller than the wind oscillating period. Since the axial length of the rotor equ ut 4 cm, the rotor blade passing time trp equals 0.04 seconds. Hence trp is much smaller than the wind osc eriod (4
seconds at f = 0.25 Hz) s aroun
the rotor can be regarded as the quasi-steady state for this experiment. The experimental values λw and fr are shown in Table 3.
4.2. Power Coefficients of the Wind Turbines in cillating Velocity Flow
In this section, we present the example results of the mean flow U = 5 m/s and u = 1.0 m/s (i.e. u U = 20%) in the conditions of Table 3. The effects of the wind frequencies f upon the power coefficients Cw as the function of the mean tip-speed ratio λ for the only rotor and compact-type wind turbines with the designed rotor tip speed ratio λD = 5.0 are shown in Figures 9 and 10.
The maximum coefficients are presented at 2.7
and 3.5 for the only rotor and the compact-type wind tur- bines respectively. The power coefficient increases
the er coefficients in the
0. .0 y ro
the
ncies are larger than one of steady flow. It is made
cl ell fo
with decreasing the frequency f.
Let discuss the dependence of the wind frequency on wind turbine types. The pow
steady wind are smaller than ones of the oscillating winds of f = 033, 0.05 and 0 83 Hz for the onl tor. While, the case of f = 0.25 Hz is smaller than one of steady wind for λ = 1.6 to 2.8. It is indicated that ro- tor do not respond the oscillating wind at f = 0.25 Hz for the tip range of speed ratio. On the other hand, the power coefficients of the compact-type wind-lens turbine for all freque
Figure 9. Effect of the wind frequencies f on the time aver-aged power coefficients Cw for the only rotor with U = 5
m/s, u = 1.0 m/s (u U = 20%) and λD = 5.0.
Effect of wind frequen f on the t Figu
er
re 10. the cies ime av-
aged power coefficients Cw for the compact-type with U
= 5 m/s, u = 1.0 m/s (u U = 20%) and . the higher oscillating wind frequency. Therefore, the compact-type wind-lens turbine is suitable for the oscil- lating velocity wind than the only rotor one.
In order to make clear the dependence of the turbine type on performance in the oscillating flow, we define the increasing ratio
D λ = 5.0
of the maximum power coeffi- cient on the basis of steady wind as follow,
w w
w
C C
C
, (4)
where Cw and Cw are maximum power coefficients in unsteady and steady winds respectively. Figure 11 pr - sents the creasing ra
e tio
in for the on rotor anly d the ompact-type with λ = 5.0. As you see, the compact-
c D
type turbine is better than the only rotor.
4.3. Numerical Estimation of the Power Coefficient of the Wind Turbines in Oscillating Flow
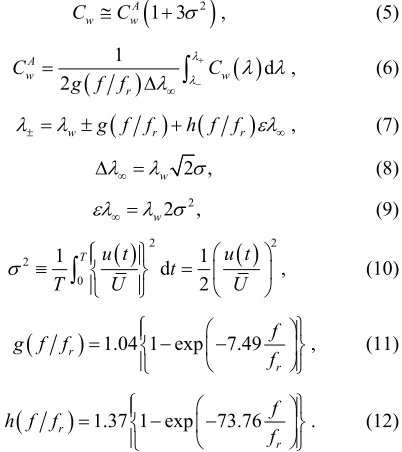
[image:5.595.61.286.285.429.2]Karasudani et al. suggest that the numerical estimation of
Figure 11. Increasing ratio of maximum power coefficient for oscillating wind on the basis of one for steady wind.
turbine performances for the oscillating wind [4]. Here it is assumed that the oscillating wind velocity U t
con- sists of the linear u t
he unsteady component u t
of a w C
ef- does not correlate to t unsteady power co
wind turbine. The tim eraged power co of the rotor is determ through the steady p ficient he wing Equations (5) to
he e av ined follo efficient efficient ower co (12), A w
C as t
1 3 2
w w
C CA , (5)
1
d2 A
w w
r
C C
g f f
, (6)
w g f fr h f fr
, (7)
2 ,
w
(8)
2
2 ,
w
(9)
2
22 0
1 d 1
2
T u t u t
t
T U U
, ( ) 10
r
1.04 1 exp 7.49r
f g f f
f
, (11)
r
1.37 1 exp 73.76r
f h f f
f
Here it is mentioned that the approximated t
. (12)
erms of
f fr
and
g h f fr
inertia, ro , powe The fficient i
are inde r coeffici n unste
pendent of moment of ent and control time. tor radius
power coe ady wind is 32 larger
power coefficient ratio than one in the steady wind. The
is defined to compare the experiment resu erical estimation CwT
lt CwE and
num ,
1 3 2
wE wE
A wT w
C C
C C
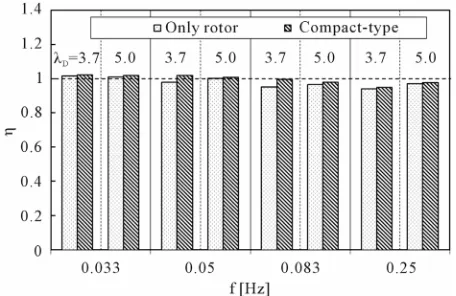
[image:5.595.339.540.381.607.2]Figure 12 summarizes for all cases. The only rotor and compact-type turbines are illustrated fr
light for each frequency, the same pattern of bar graph presents also the wind turbine type. As you see, the nu- merical estimation can predict the power coe
the oscillating flows to an accuracy of 94% to 102%.
Th he a
p
om left to
fficients in
5. Performance in Natural Fluctuating
Velocity
e natural fluctuating wind is generated by t ctive controlled multi-fan wind tunnel on the basis of Kar- man’s ower spectral equation as follows:
2
5 6 2 U 1 4
1 70.8
u t v
v S f I L U
fL
, (14)
t I
U
. (15)
[image:6.595.90.287.242.307.2]Here, It and Lv mean turbulent intensity and vortex scale respectively. We examine the effect of the main factors of the natural wind on power coefficients of the only rotor and the compact-type wind turbines for mean he ef- hown in Figure 13 respectively. According to wind velocity 5 m/s. Experimental condition and t fect of turbulent intensity on power coefficient are s
Table 4 and
experimental results, both It and Lv increase with increasing Cw for both only rotor and compact-type wind turbines.
6. Conclusions
This paper presented wind performances of the only rotor turbine and flanged diffuser shroud which are so called “the compact-type wind-lens
steady winds.
f uc
turbine” in steady and un-
The low str ture around the wind lens turbine is made clear by CFD and PIV in steady wind. Also, it is shown that the compact wind-lens turbine works larger
Fi
maximum power coefficients of the wind turbines.
gure 12. Comparisons of the experimental and numerical
[image:6.595.308.537.301.369.2]Figure 13. Effect of the turbulent intensity on power coeffi- cient for the natural fluctuating wind of time average wind velocity 5 m/s and vortex scale 3 m.
Table 4. Natural fluctuating wind conditions at U = 5 m/s. t
I Lv
Case 1
5% 10% 15% 3 m
v
L It
Case 2
1 m 3 m 6 m 10%
power generator than the only rotor wind turbine. The performance of the wind turbines is investigated in the harmonic oscillating velocity wind of the upstream mean velocities U = 5
que
m/s with oscillating amplitude = 1.0 m/s at fre ncies f = 0.033, 0.05, 0.083 and 0.25 Hz. The experimental and numerical results are pr
nd.
oto
both steady and unsteady wi d. In particular usin the pre sign ro e wind-lens turb itab for the oscillating vel y wind. istic frequency pro Karasudani can one of index to est ate
turb erform in th nd. In ex-
eriment, the numerical estimation can predict the power
har-Th u
e-sented to make clear the dependence of the wind velocity frequency on power coefficient of the wind turbines in
inusoidally oscillating velocity wi s
Consequently, the compact-type wind-lens turbine in- dicates the higher performance than an only r r one in
n g
sent de tor, th ocit
ine is su er
le The charact
posed by ine p
be im
ance e oscillating wi the p
coefficients within 94% to 102% accuracy in the monic oscillating wind.
Furthermore, performance dependence on turbulent intensity and vortex scale of natural fluctuating velocity wind is investigated. Both factors are increase with in- creasing power coefficient for the only rotor and com- pact-type wind lens turbines.
7. Acknowledgements
[image:6.595.59.287.559.707.2]awa, W. Haruki, S. Oono, M. Measurement of Flows around
1, No. 2, 2007, pp.120-123. (in Japanese)
in Japanese)
Japan, and the Collaborative Research Program of Re- search Institute for Applied Mechanics, Kyushu Univer- sity. The authors gratefully acknowledge the support of Prof. Yuji Ohya, Prof Takashi Karasudani and Prof. Ma- sato Furukawa of Kyushu University, to this investiga- tion.
REFERENCES
[1] Y. Ohya and T. Karasudani, “A Shrouded Wind Turbine Generating High Output Power with Wind-Lens Technol-ogy,” Journal of Energies, Vol. 3, No. 4, 2010, pp. 643- 649.
[2] K. Toshimitsu, K. Nishik Takao and Y. Ohya, “PIV
the Wind Turbines with a Flanged-Diffuser Shroud,” Jour- nal of Thermal Science, Vol. 17, No. 4, 2008, pp. 375- 380.
[3] T. Karasudani, Y. Ohya and K. Watanabe, “On the Re-sponse of Small Wind Turbine to Changes of Wind Speed and Load,” Journal of Japan Wind Energy Association, Vol. 3
[4] T. Karasudani, Y. Ohya and K. Watanabe, “On the Power of a Wind Turbine with Fixed-Pitch Angle Wings for Si-nusoidally Changing Wind Speed,” Journal of Japan Wind Energy Association, Vol. 32, No. 1, 2008, pp. 128- 132. (
[5] M. Okino, S. Iba, T. Karasudani, Y. Ohya and K. Wata-nabe, “Effect of Atmospheric Turbulence on Wind Tur-bine Performance,” Proceedings of the 29th Symposium of Wind Energy Utilization, Tokyo, 2007, pp. 310-313. (in Japanese)