3568
Textbook Question Answering with Multi-modal Context Graph
Understanding and Self-supervised Open-set Comprehension
Daesik Kim1,2,∗ Seonhoon Kim1,3,∗ Nojun Kwak1,†
1Seoul National University 2V.DO Inc. 3Search&Clova, Naver Corp.
{daesik.kim|nojunk}@snu.ac.kr [email protected]
Abstract
In this work, we introduce a novel algorithm for solving the textbook question answering (TQA) task which describes more realistic QA problems compared to other recent tasks. We mainly focus on two related issues with anal-ysis of the TQA dataset. First, solving the TQA problems requires to comprehend multi-modal contexts in complicated input data. To tackle this issue of extracting knowledge fea-tures from long text lessons and merging them with visual features, we establish a context graph from texts and images, and propose
a new module f-GCN based on graph
con-volutional networks (GCN). Second,
scien-tific terms are not spread over the chapters and subjects are split in the TQA dataset. To overcome this so called ‘out-of-domain’ is-sue, before learning QA problems, we intro-duce a novel self-supervised open-set learn-ing process without any annotations. The ex-perimental results show that our model signifi-cantly outperforms prior state-of-the-art meth-ods. Moreover, ablation studies validate that both methods of incorporating f-GCN for ex-tracting knowledge from multi-modal contexts and our newly proposed self-supervised learn-ing process are effective for TQA problems.
1 Introduction
In a decade, question answering (QA) has been one of the most promising achievements in the field of natural language processing (NLP). Fur-thermore, it has shown great potential to be ap-plied to real-world problems. In order to solve more realistic QA problems, input types in datasets have evolved into various combinations. Recently, Visual Question Answering (VQA) has drawn huge attractions as it is in the intersection
* Equal contribution.†Corresponding author.
This work was supported by Next-Generation Information Computing Development Program through the National Re-search Foundation of Korea (NRF-2017M3C4A7078547).
Nucleic acid classification
fuction of nucleic acid DNA stores genetic information in the cells of all living things. It contains the genetic code. This is the code that instructs cells how to make proteins.
nucleotide
RNA consists of just one chain of nucleotides. DNA consists of two chains. Nitrogen bases on the two chains of DNA form hydrogen bonds with each other. Hydrogen bonds are relatively weak bonds that form between a positively charged hydrogen atom in one molecule and a negatively charged atom in another molecule.
Context Graph
Questions
nitrogen bases in dna include
a) adenine.
b) uracil.
c) ribose. d) two of the above
What is the term for connected sugar, phosphate group and protein?
a) hydrogen bond b) deoxyribose
c) nucleotide
d) sugar-phosphate backbone
Comprehend
+
Solve
LESSON
Training Set
Validation Set
[image:1.595.314.523.221.340.2]Training Set
Figure 1: Examples of thetextbook question answering
task and a brief concept of our work. In this figure, we can see lessons which contain long essays and diagrams in the TQA. Related questions are also illustrated. With a self-supervised method, our model can comprehend contexts converted into context graphs in training and validation sets. Then it learns to solve questions only in the training set in a supervised manner.
Input Type Context
QA
Visual QA
Textbook QA
Context Part Text ◦ - ◦
Image - ◦ ◦
Question Part Text ◦ ◦ ◦
Image - - ◦
Table 1: Comparison of data types in context and ques-tion parts for context QA, VQA and TQA. It shows that the data format of the TQA task is the most complicated on both of context and question parts.
of vision and language. However, the Textbook Question Answering (TQA) is a more complex
and more realistic problem as shown in Table 1.
Compared to context QA and VQA, the TQA uses both text and image inputs in both the context and the question.
The TQA task can describe the real-life pro-cess of a student who learns new knowledge from books and practices to solve related problems
(Figure 1). It also has several novel
[image:1.595.318.513.453.520.2]for-mats of questions are various which include both text-related questions and diagram-related ques-tions. In this paper, we focus on the following two
major characteristics of the TQA dataset (
Kemb-havi et al.,2017).
First, compared to other QA datasets, the con-text part of TQA has more complexity in the as-pect of data format and length. Multi-modality of context exists even in non-diagram questions and it requires to comprehend long lessons to ob-tain knowledge. Therefore, it is important to ex-tract exact knowledge from long texts and arbi-trary images. We establish a multi-modal context
graph and propose a novel module based ongraph
convolution networks (GCN) (Kipf and Welling,
2016) to extract proper knowledge for solving
questions.
Next, various topics and subjects in the text-books are spread over chapters and lessons, and most of the knowledge and terminology do not overlap between chapters and subjects are split. Therefore, it is very difficult to solve problems on subjects that have not been studied before. To resolve this problem, we encourage our model to learn novel concepts and terms in a self-supervised manner before learning to solve specific questions. Our main contributions can be summarized as follows:
• We propose a novel architecture which can
solve TQA problems that have the highest level of multi-modality.
• We suggest a fusion GCN (f-GCN) to extract
knowledge feature from the multi-modal con-text graph of long lessons and images in the textbook.
• We introduce a novel self-supervised
learn-ing process into TQA trainlearn-ing to comprehend open-set dataset to tackle the out-of-domain issues.
With the proposed model, we could obtain the state-of-the-art performance on TQA dataset, which shows a large margin compared with the current state-of-the-art methods.
2 Related Work
2.1 Context question answering
Context question answering, also known as ma-chine reading comprehension, is a challenging
134
668
200 400 600 800
SQuAD TQA
0.84
0.79
0.76 0.78 0.80 0.82 0.84 0.86
SQuAD TQA
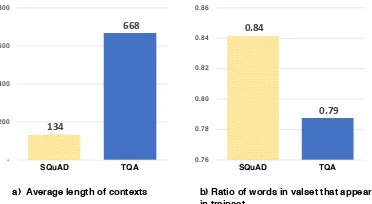
[image:2.595.324.510.72.174.2]a) Average length of contexts b) Ratio of words in valset that appear in trainset
Figure 2: Analysis of contexts in TQA and SQuAD datasets.
task which requires a machine not only to com-prehend natural language but also to reason how to answer the asked question correctly. Large amount
of datasets such as MCTest (Richardson et al.,
2013), SQuAD (Rajpurkar et al., 2016) or MS
Marco (Nguyen et al.,2016) have contributed
sig-nificantly to the textual reasoning via deep learn-ing approaches. These datasets, however, are re-stricted to a small set of contents and contain only uni-modal problems requiring only textual information. In addition, these sets require rela-tively less complex parsing and reasoning
com-pared to TQA dataset (Kembhavi et al.,2017). In
this study, we tackle TQA, the practical middle school science problems across multiple modali-ties, by transforming long essays into customized graphs for solving the questions on a textbook.
2.2 Visual question answering
As the intersection of computer vision, NLP and reasoning, visual question answering has drawn attention in the last few years. Most of
pioneer-ing works in this area (Xu and Saenko, 2016;
Yang et al., 2016;Lu et al., 2016) are to learn a joint image-question embedding to identify cor-rect answers where the context is proposed by images alone. Then, various attention algorithms have been mainly developed in this field and meth-ods of fusing textual and visual information such
as bilinear pooling (Fukui et al.,2016;Yu et al.)
have also been widely studied. Thereafter, datasets focusing on slightly different purposes have been
proposed. For instance, CLEVR (Johnson et al.,
2017) encouraged to solve the visual grounding
problem and AI2D (Kembhavi et al., 2016)
sug-gested a new type of data for knowledge extrac-tion from diagrams. In this paper, we
incorpo-rate UDPnet (Kim et al.,2018) to extract
knowl-edge from diagram parsing graph in the textbook.
Norcliffe-Diagrams
a) Preparation step for k-th answer among n candidate TF-IDF
context 1 context 2 context 3
3) Answer k
2) Question
f-GCN RNN
RNN
MAX POOL
MAX POOL ATTENTION ATTENTION
CONCAT
FC Y1 ... Yk Yn context m
TF-IDF
Dependency Parsing
b) Embedding step and Solving step Top-1
Filter by anchor
nodes
Question
Answer k
GloVe+Char_emb
GloVe+Char_emb
c
c k th
RNNs Text
Image
Diagram Parsing
4) Visual Context Graph m
5) Textual Context Graph m
Diagram Parsing
1) Diagram Graph*
GCN* ATTENTION*
Image
Text
Context Part Question Part
Dependency Tree
[image:3.595.73.514.65.222.2]Diagram
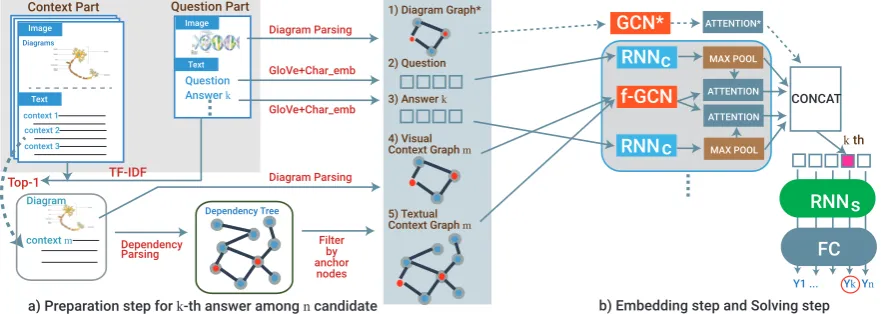
Figure 3:Overall framework of our model: (a) The preparation stepfor thek-th answer amongncandidates.
The contextm is determined by TF-IDF score with the question and thek-th answer. Then, the context mis
converted to a context graph m. The question and thek-th answer are also embedded by GloVe and character
embedding. This step is repeated forncandidates.(b) The embedding stepusesRN NCas a sequence embedding
module and f-GCN as a graph embedding module. With attention methods, we can obtain combined features. After
concatenation,RN NSand the fully connected module predict final distribution in the solving step.
Brown et al., 2018) also have dealt with graph structure to solve VQA problems.
3 Problem
Formally, our problem can be defined as follows:
ˆ
a= argmax
a∈Ωa
p(a|C, q;θ) (1)
where C is given contexts which consist of
tex-tual and visual contents andq is a given question
which can contain question diagrams for diagram
problems.θdenotes the trainable parameters. With
givenCandq, we are to predict the best answerˆa
among a set of possible answersΩa.
The TQA contexts contain almost all items in textbooks: topic essay, diagrams and images, lesson summaries, vocabularies, and instructional videos. Among them, we mainly use topic essay as textual contexts and diagrams as visual contexts.
Among various issues, the first problem we tackle is the complexity of contexts and variety
in data formats as shown in Table 1. Especially,
analysis of textual context in Figure 2(a) shows
that the average length of contexts in the TQA is 668 words which is almost 5 times larger than that of the SQuAD which has 134 words on
av-erage. Also, in (Kembhavi et al., 2017),
analy-sis of information scope in TQA dataset provides two important clues that about 80% of text ques-tions only need 1 paragraph and about 80% of di-agram questions only need 1 context image and 1 paragraph. Due to those evidences, we need to add an information retrieval step such as TF-IDF
(term frequency–inverse document frequency) to narrow down scope of contexts from a lesson to a paragraph, which significantly reduces the com-plexity of a problem. Moreover, a graph structure can be suitable to represent logical relations be-tween scientific terms and to merge them with vi-sual contexts from diagrams. As a result, we de-cide to build a multi-modal context graph and ob-tain knowledge features from it.
In Figure2(b), we obtain the percentage of how
much the terms in the validation set are appear-ing in the trainappear-ing set. Obviously, the ratio of the TQA (79%) is lower than that of the SQuAD (84%) which can induce out-of-vocabulary and domain problems more seriously in the TQA task. To avoid aforementioned issues, we apply a novel self-supervised learning process before learning to solve questions.
4 Proposed Method
Figure3 illustrates our overall framework which
consists of three steps. In a preparation step, we use TF-IDF to select the paragraph most relevant to the given question or candidate answers. Then, we convert it into two types of context graphs for text and image, respectively. In the embedding
step, we exploit an RNN (denoted as RNNC in the
Visual Context Graph
Textual Context Graph
GCN
GCN
Attention
GCN
Fused Graph Representation
Weighted Sum
Ht
Hd
Hc
[image:4.595.73.287.72.156.2]c c
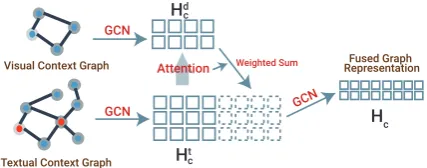
Figure 4: Illustration of f-GCN. Both of textual and
vi-sual contexts are converted intoHd
c andHct. With
atten-tion methods, we obtain combined features ofHt
c and
Hd
c (f-GCN1). Finally, we use GCN again to propagate
over entire features of context graphs (f-GCN2).
of concatenated features from the embedding step.
We exploit another RNN (RNNS) to cope with
the variable number of answer candidates which varies from 2 to 7 that can have sequential rela-tions such as “none of the above” or “all of the above” in the last choice. Final fully connected layers decide probabilities of answer candidates. Note that notation policies are included in the sup-plementary.
4.1 Multi-modal Context Graph Understanding
4.1.1 Visual and Textual Context graphs
For the visual contexts and the question diagrams, we build a visual context graph using UDPnet (Kim et al.,2018). We obtain names, counts, and relations of entities in diagrams. Then we can es-tablish edges between related entities. Only for question diagrams, we use counts of entities trans-formed in the form of a sentence such as “There are 5 objects” or “There are 6 stages”.
We build the textual context graphs using some parts of the lesson where the questions can focus on solving problems as follows. Each lesson can be divided into multiple paragraphs and we extract one paragraph which has the highest TF-IDF score using a concatenation of the question and one of
the candidate answers (leftmost of Figure3(a)).
Then, we build the dependency trees of the extracted paragraph utilizing the Stanford
depen-dency parser (Manning et al.,2014), and designate
the words which exist in the question and the can-didate answer as anchor nodes. The nodes which have more than two levels of depth difference with anchor nodes are removed and we build the tex-tual context graphs using the remaining nodes and edges (Process 1 in the supplementary).
4.1.2 Graph Understanding using f-GCN
Next, we propose f-GCN to extract combined graph features for visual and textual context
graphs as shown in Figure 4. Each of context
graphs has its own graph matrixCcontaining node
features and a normalized adjacency matrix which are used as inputs of a GCN to comprehend the
contexts. Here, the graph matrixCis composed of
the word embeddings and the character represen-tation. First, we extract propagated graph features from both of context graphs based on one-layer GCN as
Hct=f(Ct,At) =σ(AtCtWt)
Hcd=f(Cd,Ad) =σ(AdCdWd), (2)
where At andAd are the adjacency matrices for
the text and visual contexts,WtandWdare
learn-ing parameters of linear layer for the text and
vi-sual contexts, and the element-wise operationσis
thetanhactivation function.
After that, we use dot product function to get
at-tention matrixZ of visual contextHcdagainst
tex-tual contextHct which contains main knowledge.
Then we concatenate features of textual context
Hctand weighted sumZTHcdto get entire context
features,
Hc1= [Hct;ZTHcd], (3)
where [·; ·]is the concatenation operator.
Com-pared to the textual-context-only case, we can ob-tain double-sized features which can be more in-formative. Finally, we use a GCN again to propa-gate over entire features of context graphs:
Hc2 =f(Hc1,At) =σ(AtHc1Wc). (4)
We denote this module except the last GCN as
f-GCN1 (eq. (3)) and the whole module including
the last GCN as f-GCN2 (eq. (4)).
4.2 Multi-modal Problem Solving
The f-GCN and RNNs are used to embed the con-texts and answer the questions as shown in Figure
3(b). Two different RNNs are used in our
archi-tecture. One is thecomprehendingRNN (RNNC)
which can understand questions and candidate
an-swers and the other is the solvingRNN (RNNS)
which can answer the questions.
The input of the RNNC is comprised of the
represented aseqi/eaiby using a pre-trained word
embedding method such as GloVe (Pennington
et al.,2014). The character representationcqi/caiis
calculated by feeding randomly initialized charac-ter embeddings into a CNN with the max-pooling
operation. The occurrence flag fqi/fai indicates
whether the word occurs in the contexts or not.
Our final input representationqwi for the question
word qi in RNNC is composed of three
compo-nents as follows:
eqi =Emb(qi), cqi =Char-CNN(qi)
qwi = [eqi;cqi;fqi].
(5)
The input representation for the candidate answers is also obtained in the same way as the one for the
question. Here,Embis the trainable word
embed-dings andChar-CNNis the character-level
convo-lutional network. To extract proper representations for the questions and candidate answers, we ap-ply the step-wise max-pooling operation over the
RNNChidden features.
Given each of the question and the candidate an-swer representations, we use an attention mecha-nism to focus on the relevant parts of the contexts for solving the problem correctly. The attentive
in-formationAttq of the question representationhq
against the context featuresHcas in (3) or (4) is
calculated as follows:
Attq= K
X
k=1
αkHck, αk=
exp(gk)
PK
i=1exp(gi)
,
gk=hTqMHck.
(6)
Here, K is the number of words in the
con-text C which equals the dimension of the square
adjacency matrix A. M is the attention matrix
that converts the question into the context space. The attentive information of the candidate answers
Attais calculated similar toAttq.
RNNScan solve the problems and its input
con-sists of the representations of the question and the candidate answer with their attentive information on the contexts as:
IRN Nt
S = [hq;ha;Att
c q;Attca],
IRN Nd S = [hq;ha;Attqc;Attca;Attqdq ;Attqda ] (7)
whereIt
RN NS is for the text questions andI
d
RN NS
is for the diagram questions. Finally, based on
the outputs of RNNS, we use one fully-connected
layer followed by a softmax function to obtain a probability distribution of each candidate answer and optimize those with cross-entropy loss.
context
Top-1
context m
Top-2
context
Top-n TF-IDF
Top-1 is correct
Context Graph m
Same structure as normal training
Diagrams
context 1 context 2 context 3
Question Answer k Text
Image Image
Text
Context Part Question Part
f-GCN RNN
RNN
MAX POOL
MAX POOL ATTENTION ATTENTION
CONCAT
FC Y1 ... Yk Yn c
c k th
[image:5.595.306.513.60.216.2]RNNs GCN* ATTENTION*
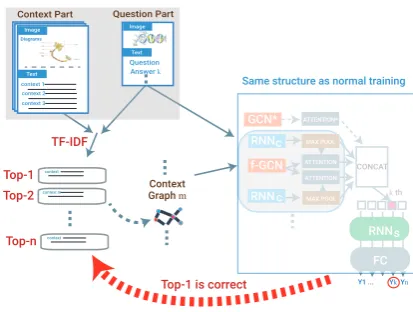
Figure 5: Self-supervised open-set comprehension step in our model. We set contexts as candidates we should
predict for the question and thek-th answer. For each
answer, we obtainn context candidates from TF-IDF
methods and set the top-1 candidate as the correct
con-text. While we use the same structure as in Figure3, we
can predict final distribution after all the steps.
4.3 Self-supervised open-set comprehension
To comprehend out-of-domain contexts, we pro-pose a self-supervised prior learning method as
shown in Figure5. While we exploit the same
ar-chitecture described in the previous section, we have reversed the role of the candidate answer
and the contexts in (1) as a self-supervised one.
In other words, we set the problem as inferring the Top-1 context for the chosen answer candidate. We assume TF-IDF to be quite reliable in measur-ing closeness between texts.
The newly defined self-supervised problem can be formalized as follows:
ˆ
c= argmax
c∈Ωc
p(c|Ak, q;θ) (8)
where Ak is given k-th answer candidate among
ncandidates andqis the given question. Then we
infer the most related contextcˆamong a set of
con-textsΩcin a lesson.
For each candidate answerAk(k= 1, .., n), we
get the set of paragraphsΩcof sizejfrom the
cor-responding context. Here, Ωc is obtained by
cal-culating TF-IDF between [q;Ak]and each
para-graph ω, i.e.,Tω = tf-idf([q;Ak], ω), and
select-ing the top-jparagraphs. Among thejparagraphs
ωi(i = 1,· · · , j)inΩc, the one with the highest TF-IDF score is set as the ground truth:
yi=
(
1, ifωi = argmaxω∈ΩcTω,
0, otherwise. (9)
With Ak, q andωi ∈ Ωc, we conduct the same
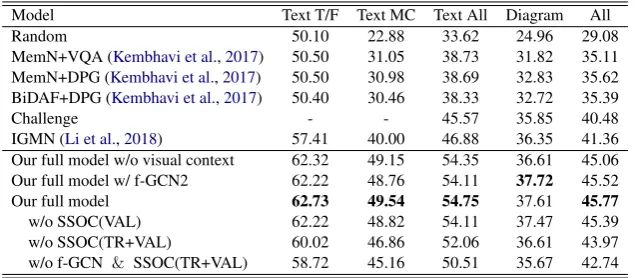
Model Text T/F Text MC Text All Diagram All
Random 50.10 22.88 33.62 24.96 29.08
MemN+VQA (Kembhavi et al.,2017) 50.50 31.05 38.73 31.82 35.11
MemN+DPG (Kembhavi et al.,2017) 50.50 30.98 38.69 32.83 35.62
BiDAF+DPG (Kembhavi et al.,2017) 50.40 30.46 38.33 32.72 35.39
Challenge - - 45.57 35.85 40.48
IGMN (Li et al.,2018) 57.41 40.00 46.88 36.35 41.36
Our full model w/o visual context 62.32 49.15 54.35 36.61 45.06
Our full model w/ f-GCN2 62.22 48.76 54.11 37.72 45.52
Our full model 62.73 49.54 54.75 37.61 45.77
w/o SSOC(VAL) 62.22 48.82 54.11 37.47 45.39
w/o SSOC(TR+VAL) 60.02 46.86 52.06 36.61 43.97
[image:6.595.141.459.62.201.2]w/o f-GCN & SSOC(TR+VAL) 58.72 45.16 50.51 35.67 42.74
Table 2: Comparison of performance with previous methods (Top) and results of ablation studies (Bottom). We demonstrate the accuracies of each type of questions, Text T/F (true-false in text only), Text MC (multiple-choices in text only), Text all (all in text only), Diagram and All. Note that previous methods only used textual context.
RN NS,IRN Ni S. After repeating itjtimes, we put
all IRN Ni
S,(i = 1· · ·, j) into RN NS
sequen-tially and optimize this step with the cross-entropy loss. We repeatedly choose all answer candidates
Ak, and conduct the same process in this step.
With this pre-training stage which shares pa-rameters with the supervised stage, we expect that our model can deal with almost all contexts in a lesson. Moreover, it becomes possible to learn contexts in the validation set or the test set with a self-supervised manner. This step is analogous to a student who reads and understands a textbook and problems in advance.
5 Experiments
5.1 Dataset
We perform experiments on the TQA dataset, which consists of 1,076 lessons from Life Sci-ence, Earth Science and Physical Science text-books. While the dataset contains 78,338 sen-tences and 3,455 images including diagrams, it also has 26,260 questions with 12,567 of them having an accompanying diagram, split into ing, validation and test at a lesson level. The train-ing set consists of 666 lessons and 15,154 ques-tions, the validation set consists of 200 lessons and 5,309 questions and the test set consists of 210 lessons and 5,797 questions. Since evaluation for test is hidden, we only use the validation set to evaluate our methods.
5.2 Baselines
We compare our method with several recent meth-ods as followings:
• MemN+VQA, MemN+DPG Both exploits Memory networks to embed texts in lessons and
questions. First method uses VQA approaches for diagram questions, and the second one exploits Di-agram Parse Graph (DPG) as context graph on
dia-grams built by DsDP-net (Kembhavi et al.,2016).
• BiDAF+DPG It incorporates BiDAF
(Bi-directional Attention Flow Network) (Seo et al.,
2016), a recent machine comprehension model
which exploits a bidirectional attention mecha-nism to capture dependencies between question and corresponding context paragraph.
For above 3 models, we use experimental
re-sults newly reported in (Li et al.,2018).
• Challenge This is the one that obtained the
top results in TQA competition (Kembhavi et al.,
2017). The results in the table are mixed with
each of top score in the text-question track and the diagram-question track.
• IGMN It uses the Instructor Guidance with
Memory Nets (IGMN) based on Contradiction Entity-Relationship Graph (CERG). For diagram questions, it only recognizes texts in diagrams.
•Our full model w/o visual contextThis method excludes visual context to compare with previous methods on the same condition. It uses only one-layer GCN for textual context and self-supervised open-set comprehension (SSOC).
•Our full model w/ f-GCN2From now, all meth-ods include visual context. This method uses f-GCN2 and SSOC.
Following methods are for our ablation study:
• Our full model This method uses both of our methods, f-GCN1 and SSOC on the training and the validation sets.
•Our model w/o SSOC (VAL)This method only uses training set to pretrain parameters in SSOC.
only uses f-GCN as Graph extractor and was trained only in a normal supervised learning man-ner.
• Our model w/o f-GCN & SSOC (TR+VAL)
This method ablates both f-GCN module and SSOC process. It replaces f-GCN as vanilla RNN, other conditions are the same.
5.3 Quantitative Results
5.3.1 Comparison of Results
Overall results on TQA dataset are shown in Table
2. The results show that all variants of our model
outperform other recent models in all type of ques-tion. Our best model shows about 4% higher than state-of-the-art model in overall accuracy. Espe-cially, an accuracy in text question significantly outperforms other results with about 8% margin. A result on diagram questions also shows more than 1% increase over the previous best model. We believe that our two novel proposals, context graph understanding and self-supervised open-set comprehension work well on this problem since our models achieve significant margins compared to recent researches.
Even though our model w/o visual context only uses one-layer GCN for textual context, it shows better result compared to MemN+VQA and MemN+DPG with a large margin and IGMN with about 3% margin. IGMN also exploits a graph module of contraction, but ours outperforms es-pecially in both text problems, T/F and MC with over 5% margin. We believe that the graph in our method can directly represents the feature of con-text and the GCN also plays an important role in extracting the features of our graph.
Our models with multi-modal contexts show significantly better results on both text and di-agram questions. Especially, results of didi-agram question outperform over 1% rather than our model w/o visual context. Those results indicate that f-GCN sufficiently exploits visual contexts to solve diagram questions.
5.3.2 Ablation Study
We perform ablation experiments in Table2. Our
full model w/ f-GCN2 can achieve best score on diagram questions but slightly lower scores on text questions. Since the overall result of our full model records the best, we conduct ablation study of each module of it.
First, we observe an apparent decrease in our model when any part of modules is
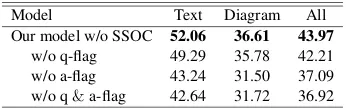
elimi-Model Text Diagram All
Our model w/o SSOC 52.06 36.61 43.97
w/o q-flag 49.29 35.78 42.21
w/o a-flag 43.24 31.50 37.09
[image:7.595.330.503.56.110.2]w/o q&a-flag 42.64 31.72 36.92
Table 3: Results of ablation study about the occurrence flags. We demonstrate the accuracies of Text only, Dia-gram, and total questions without SSOC method.
nated. It is surprising that self-supervised open-set comprehension method provides an improve-ment on our model. Our full model shows about 2% higher performance than the model without SSOC(TR+VAL). It is also interesting to com-pare our full model with our model without SSOC(VAL). The results show that using the ad-ditional validation set on SSOC can improve over-all accuracy compared to using only training set. It seems to have more advantage for learning un-known dataset in advance.
Our model without f-GCN & SSOC
elimi-nates our two novel modules and replace GCN with vanilla RNN. That model shows 1% of per-formance degradation compared with the model without SSOC(TR+VAL) which means that it might not sufficient to deal with knowledge fea-tures with only RNN and attention module. Thus, context graph we create for each lesson could give proper representations with f-GCN module.
Table3shows the results of ablation study about
occurrence flag. All models do not use SSOC
method. In (5), we concatenate three components
including the occurrence flag to create question or answer representation. We found that the oc-currence flag which explicitly indicates the exis-tence of a corresponding word in the contexts has a meaningful effect. Results of all types degrade significantly as ablating occurrence flags. Espe-cially, eliminating a-flag drops accuracy about 7% which is almost 4 times higher than the decrease due to eliminating f-flag. We believe that disentan-gled features of answer candidates can mainly de-termine the results while a question feature equally affects all features of candidates. Our model with-out both flags shows the lowest results due to the loss of representational power.
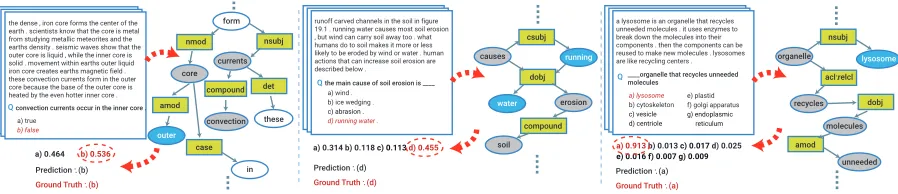
5.4 Qualitative Results
Figure 6 shows three qualitative results of
text-type questions without visual context. We illus-trate textual contexts, questions, answer candi-dates and related subgraphs of context graphs.
runoff carved channels in the soil in figure 19.1 . running water causes most soil erosion , but wind can carry soil away too . what humans do to soil makes it more or less likely to be eroded by wind or water . human actions that can increase soil erosion are described below .
the main cause of soil erosion is ____ Q
a) wind . b) ice wedging .
c) abrasion . d) running water .
causes dobj csubj running erosion compound water soil a) 0.314 b) 0.118 c) 0.113 d) 0.455
Prediction : (d) Ground Truth : (d)
the dense , iron core forms the center of the earth . scientists know that the core is metal from studying metallic meteorites and the earths density . seismic waves show that the outer core is liquid , while the inner core is solid . movement within earths outer liquid iron core creates earths magnetic field . these convection currents form in the outer core because the base of the outer core is heated by the even hotter inner core .
convection currents occur in the inner core . Q a) true b) false currents form nsubj det these compound convection
a) 0.464 b) 0.536 Prediction : (b) Ground Truth : (b)
a lysosome is an organelle that recycles unneeded molecules . it uses enzymes to break down the molecules into their components . then the components can be reused to make new molecules . lysosomes are like recycling centers .
____organelle that recycles unneeded molecules Q a) lysosome b) cytoskeleton c) vesicle d) centriole organelle acl:relcl nsubj lysosome dobj molecules recycles amod a) 0.913 b) 0.013 c) 0.017 d) 0.025
e) 0.016 f) 0.007 g) 0.009
Prediction : (a) Ground Truth : (a) nmod core amod outer case in e) plastid f) golgi apparatus
g) endoplasmic reticulum
[image:8.595.75.524.62.159.2]unneeded
Figure 6: Qualitative results of text-type questions without visual context. Each example shows all items for a question in the textbook and a textual context subgraph to solve a question. And our predicted distribution for answers and ground truths are also displayed. In the subgraph, gray circles represent words in questions and blue circles represent words related to answers. Green rectangles represent relation types of the dependency graph.
earthquakes are used to identify plate boundaries ( figure 6.14 ) . when earthquake locations are put on a map , they outline the plates . the movements of the plates are called plate tectonics . the lithosphere is divided into a dozen major and several minor plates . each plate is named for the continent or ocean basin it contains . some plates are made of all oceanic lithosphere . a few are all continental lithosphere .
what lies exactly below the lithosphere? Q
a) asthenosphere. b) volcanoes.
c) trench. d) oceanic crust.
lithosphere a) 0.383c) 0.186 b) 0.232d) 0.199
Prediction : (a)
Ground Truth : (a)
few continental oceanic asthenosphere lithosphere Diagram Oceanic Crust
the cell membrane is like the bag holding the jell-o . it encloses the cytoplasm of the cell . it forms a barrier between the cytoplasm and the environment outside the cell . the function of the cell membrane is to protect and support the cell ...
which part forms a barrier between the cytoplasm and the environment outside the cell? Q
a) cell wall. b) golgi vesicles.
c) cell membrane.
d) golgi apparatus.
cytoplasm cell
evironment
barrier membrane
cell wall ndgplasmic
ribosomes Diagram
Diagram
a) 0.085 b) 0.025 c) 0.872d) 0.018 Prediction : (c)
Ground Truth : (c)
cytoplasm vacuole nuciqoius vesicle lysosome centriole cytoplasm membrane protect
Figure 7: Qualitative results of diagram-type questions. We illustrate intermediate subgraphs, and predicted distribution for answers and ground truths.
T/F question. Three words, “currents”, “core” and “convection” are set as anchor nodes as shown in
the left of Figure 6. Within two levels of depth,
we can find “outer” node which is the opposite to “inner” in the question sentence. As a result, our model predicts the true and false probabilities of this question as 0.464 and 0.536, respectively, and correctly solves this problem as a false statement. Next example is a multiple choice problem which is more complicated than T/F problem. With an-chor nodes which consist of each answer candi-date and a question such as “causes”, “erosion” and “soil”, the context graph can be established including nodes in two depth of graph from an-chor nodes. Among the 4 candidates, choice (d) contains the same words, “running” and “water”, as our model predicts. Therefore, our model can estimate (d) as the correct answer with the high-est probability of 0.455. The last example shows a more complicated multiple choice problem. In the context graph, we set “organelle”, “recycles”,
“molecules” and “unneeded” as anchor nodes with each word in answer candidates. Then we can eas-ily find an important term, “lysosome” in choice (a). Therfore, choice (a) has a probability close to one among 7 candidates.
Figure7demonstrates qualitative results of
di-agram questions. We exclude relation type nodes in subgraphs of the dependency tree for simplicity and also illustrate diagram parsing graphs of visual contexts and question diagram. The example in the top shows intermediate results of subgraphs on a diagram question without visual context. Even though chosen paragraph in textual context do not include “asthenosphere”, graph of a question di-agram contain relation between “asthenosphere” and “lithosphere”. Then our model can predict (a) as the correct answer with probability of 0.383. The bottom illustration describes the most com-plex case which has diagrams in both of context and question parts. We illustrate all subgraphs of text and diagrams. While our model can collect sufficient knowledge about cell structure on broad information scope, “cell membrane” can be cho-sen as correct answer with the highest probability. These examples demonstrate abstraction abil-ity and relationship expressiveness which can be huge advantages of graphs. Moreover, those re-sults could support that our model can explicitly interpret the process of solving multi-modal QA.
6 Conclusion
[image:8.595.76.286.230.434.2]References
Akira Fukui, Dong Huk Park, Daylen Yang, Anna Rohrbach, Trevor Darrell, and Marcus Rohrbach. 2016. Multimodal compact bilinear pooling for visual question answering and visual grounding.arXiv preprint arXiv:1606.01847.
Justin Johnson, Bharath Hariharan, Laurens van der Maaten, Li Fei-Fei, C Lawrence Zitnick, and Ross Girshick. 2017. Clevr: A diagnostic dataset for compositional language and elementary visual reasoning. InComputer Vision and
Pattern Recognition (CVPR), 2017 IEEE Conference on,
pages 1988–1997. IEEE.
Aniruddha Kembhavi, Mike Salvato, Eric Kolve, Minjoon Seo, Hannaneh Hajishirzi, and Ali Farhadi. 2016. A di-agram is worth a dozen images. InEuropean Conference
on Computer Vision, pages 235–251. Springer.
Aniruddha Kembhavi, Minjoon Seo, Dustin Schwenk, Jonghyun Choi, Ali Farhadi, and Hannaneh Hajishirzi. 2017. Are you smarter than a sixth grader? textbook ques-tion answering for multimodal machine comprehension.
In2017 IEEE Conference on Computer Vision and
Pat-tern Recognition (CVPR), pages 5376–5384. IEEE.
Daesik Kim, YoungJoon Yoo, Jee-Soo Kim, SangKuk Lee, and Nojun Kwak. 2018. Dynamic graph generation net-work: Generating relational knowledge from diagrams. In
The IEEE Conference on Computer Vision and Pattern
Recognition (CVPR).
Thomas N Kipf and Max Welling. 2016. Semi-supervised classification with graph convolutional networks. arXiv
preprint arXiv:1609.02907.
Juzheng Li, Hang Su, Jun Zhu, Siyu Wang, and Bo Zhang. 2018. Textbook question answering under instructor guid-ance with memory networks. InProceedings of the IEEE
Conference on Computer Vision and Pattern Recognition,
pages 3655–3663.
Jiasen Lu, Jianwei Yang, Dhruv Batra, and Devi Parikh. 2016. Hierarchical question-image co-attention for visual ques-tion answering. InAdvances In Neural Information
Pro-cessing Systems, pages 289–297.
Christopher Manning, Mihai Surdeanu, John Bauer, Jenny Finkel, Steven Bethard, and David McClosky. 2014. The stanford corenlp natural language processing toolkit. In
Proceedings of 52nd annual meeting of the association for
computational linguistics: system demonstrations, pages
55–60.
Tri Nguyen, Mir Rosenberg, Xia Song, Jianfeng Gao, Saurabh Tiwary, Rangan Majumder, and Li Deng. 2016. Ms marco: A human generated machine reading compre-hension dataset.arXiv preprint arXiv:1611.09268.
Will Norcliffe-Brown, Stathis Vafeias, and Sarah Parisot. 2018. Learning conditioned graph structures for inter-pretable visual question answering. InAdvances in Neural
Information Processing Systems, pages 8344–8353.
Jeffrey Pennington, Richard Socher, and Christopher Man-ning. 2014. Glove: Global vectors for word representa-tion. InProceedings of the 2014 conference on empirical
methods in natural language processing (EMNLP), pages
1532–1543.
Pranav Rajpurkar, Jian Zhang, Konstantin Lopyrev, and Percy Liang. 2016. Squad: 100,000+ questions for machine comprehension of text. arXiv preprint arXiv:1606.05250.
Matthew Richardson, Christopher JC Burges, and Erin Ren-shaw. 2013. Mctest: A challenge dataset for the open-domain machine comprehension of text. InProceedings of the 2013 Conference on Empirical Methods in Natural
Language Processing, pages 193–203.
Minjoon Seo, Aniruddha Kembhavi, Ali Farhadi, and Hannaneh Hajishirzi. 2016. Bidirectional attention flow for machine comprehension. arXiv preprint
arXiv:1611.01603.
Damien Teney, Lingqiao Liu, and Anton van den Hengel. 2017. Graph-structured representations for visual ques-tion answering. InProceedings of the IEEE Conference
on Computer Vision and Pattern Recognition, pages 1–9.
Huijuan Xu and Kate Saenko. 2016. Ask, attend and an-swer: Exploring question-guided spatial attention for vi-sual question answering. In European Conference on
Computer Vision, pages 451–466. Springer.
Zichao Yang, Xiaodong He, Jianfeng Gao, Li Deng, and Alex Smola. 2016. Stacked attention networks for image ques-tion answering. InProceedings of the IEEE Conference
on Computer Vision and Pattern Recognition, pages 21–
29.
Zhou Yu, Jun Yu, Jianping Fan, and Dacheng Tao. Multi-modal factorized bilinear pooling with co-attention learn-ing for visual question answerlearn-ing.
A Notations
We denote the question text, question diagram, candidate answer, text context and diagram
context as Qt = {q1t, q2t,· · · , qIt}, Qd =
{q1d, qd2,· · · , qJd}, A = {a1, a2,· · · , aK}, Ct = {ct1, ct2,· · · , ctL}, and Cd = {cd1, cd2,· · ·, cdM},
respectively where qit/qjd/ak/ctl/cdm is the
ith/jth/kth/lth/mth word of the question text
Qt and the question diagram Qd, candidate
answer A, text context Ct and diagram context
Cd (C is unified notation for the Ct and Cd).
The corresponding representations are denoted as
ht
q,hdq,ha,HctandHcd, respectively. Note that we
use the diagram contextCd only in the diagram
questions.
B Implementation Details
We initialized word embedding with 300d GloVe vectors pre-trained from the 840B Common Crawl corpus, while the word embeddings for the out-of-vocabulary words were initialized randomly. We also randomly initialized character embed-ding with a 16d vector and extracted 32d char-acter representation with a 1D convolutional net-work. And the 1D convolution kernel size is 5. We
used 200 hidden units of Bi-LSTM for the RNNc
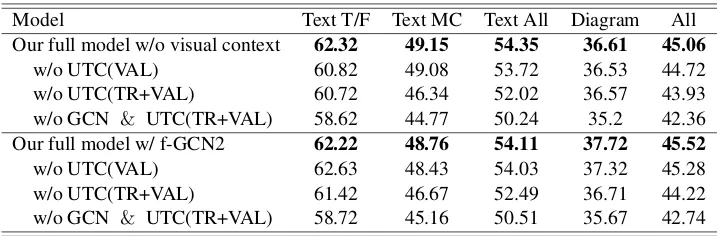
Model Text T/F Text MC Text All Diagram All
Our full model w/o visual context 62.32 49.15 54.35 36.61 45.06
w/o UTC(VAL) 60.82 49.08 53.72 36.53 44.72
w/o UTC(TR+VAL) 60.72 46.34 52.02 36.57 43.93
w/o GCN & UTC(TR+VAL) 58.62 44.77 50.24 35.2 42.36
Our full model w/ f-GCN2 62.22 48.76 54.11 37.72 45.52
w/o UTC(VAL) 62.63 48.43 54.03 37.32 45.28
w/o UTC(TR+VAL) 61.42 46.67 52.49 36.71 44.22
[image:10.595.119.479.61.179.2]w/o GCN & UTC(TR+VAL) 58.72 45.16 50.51 35.67 42.74
Table 4: Results of additional ablation studies. We demonstrate the accuracies of each type of questions: Text T/F (true-false in text only), Text MC (multiple-choices in text only), Text all (all in text only), Diagram and All (total questions). Results of our full model without visual context are on the top of the table and results of our full model with f-GCN2 are in the bottom.
and the candidate answers. The maximum se-quence length of them is set to 30. Likewise, the
number of hidden units of the RNNs is the same
as the RNNcand the maximum sequence length is
7 which is the same as the number of the maxi-mum candidate answers. We employed 200d one layer GCN for all types of graphs, and the num-ber of maximum nodes is 75 for the textual con-text graph, 35 for the diagrammatic concon-text graph, and 25 for the diagrammatic question graph,
re-spectively. We use tanh for the activation
func-tion of the GCN. The dropout was applied after all of the word embeddings with a keep rate of 0.5. The Adam optimizer with an initial learning rate of 0.001 was applied, and the learning rate was decreased by a factor of 0.9 after each epoch.
1. Select one sample from dataset
Q. Wegeners idea is correctly referred to as
a1. the continental drift hypothesis a2. the continental drift theory a3. the plate tectonics hypothesis a4. the plate tectonics theory
2. We select one candidate answer from question-candidate pairs in the first step
Q. Wegeners idea is correctly referred to as
a1. the continental drift hypothesis
3. Next, we choose a number j which is the number of new candidate contexts answers. Then we extract Top - j paragraphs from the lesson according to TF-IDF scores. (e.g. j=3)
Paragraph 1 Paragraph 2 Paragraph 3
4. We designate the candidate answer which connect to the top-1 paragraph as a correct answer, and others as wrong answers.
Paragraph 1 Paragraph 2 Paragraph 3
Top-1 Top-2
Top-3
TF-IDF
Correct
Q + a1
+ Q + a1
+ Q + a1
+
Q. Wegeners idea is correctly referred to as
a1. the continental drift hypothesis
Figure 8: Additional examples of SSOC steps.
C Additional explanation for SSOC
In Figure8, we illustrate examples about detailed
steps of SSOC. In the first step, we select one
can-didate answer from question-cancan-didate answers
pairs (2). Next, we choose a numberj, the
num-ber of candidate contexts for the pair of question-candidate answer, in the range 2 to 7 like the
orig-inal dataset (3). Ifj is higher than the number of
contexts in the lesson, we setjto be the number of
contexts. Then, we extract topjparagraphs using
the TF-IDF scores to set them as candidate
con-textsΩc (3). We build each context graph in the
same way as the original method and get embed-dings with the question-candidate answer pair we selected. Finally, we designate the final candidate which connects to the top 1 paragraph as a correct answer, and others as wrong answers (4).
D Results of additional ablation study
We perform additional ablation studies for variants of our model. For both our full model without vi-sual context and our full model with f-GCN2,
re-sults of ablation studies are shown in Table4. Both
studies seem to demonstrate similar tendency as performances are degraded for ablating each mod-ule. We can conclude that our two novel modules have sufficient contributions to improve the per-formance our model in the TQA problem.
E Process of Building Textual Context
Graph
The procedure for converting the textual context into the graph structures is shown in Process 1. After constructing the dependency trees, we set the nodes included in the question or the candidate answer as anchor nodes and built the final context
graphCby removing the nodes which have more
than two levels of depth difference with anchor nodes. We also constructed the adjacency matrix
[image:10.595.72.291.488.665.2]Process 1Build textual context and adjacency
ma-tricesC,A
Input:a paragraph, a set ofanchor nodesV
1: Construct a dependency tree on each sentence
of the given paragraph
2: Split the tree into multiple units each of which
represents two nodes and one edge u =
{v1, v2}
3: U ←a set of units
4: E←an empty set of edges
5: fordepth←1to2do
6: forall nodesv∈V do
7: forall unitsu∈U do
8: ifv∈uthen
9: E ←E∪ {u}
10: end if
11: end for
12: end for
13: V ←a set of all nodes inE
14: end for
Output: context matrixC fromV with
em-bedding matrices, adjacency matrixAfromE
F Additional Qualitative Results
In next pages, we present additional qualitative results of questions in three types. We explicitly demonstrates all intermediate results as subgraphs of visual context and question diagram. Note that we add a legend that indicates which types of data are used in this figure to avoid confusion. In
Fig-ure9and Figure10, we illustrate intermediate and
final results on text-type question with visual con-text. Next, we demonstrate intermediate and final results on diagram-type question without visual
context in Figure 11 and Figure 12. Finally, we
present intermediate and final results of the most complicated type, diagram-type question with
vi-sual context in Figure13and Figure14. We hope
Diagram
Prediction : (d) Ground Truth : (d)
[["continental", "thospheve"], ["convectlon", "cell"], ["oceanic", "lithosphere"], ["mid", "oceanic", "ridge"], ["outer", "core"], ["subduction"], ["inner", "core"], ["mantle"], ["trench"], ["ho"], ["ocean"], ["there", "are", "11", "objects"], ["there", "are", "2", "stages"]]
convection within the earths mantle causes the plates to move . mantle material is heated above the core . the hot mantle rises up towards the surface ( figure 6.16 ) . as the mantle rises it cools . at the surface the material moves horizontally away from a mid-ocean ridge crest . the material continues to cool . it sinks back down into the mantle at a deep sea trench . the material sinks back down to the core . it moves horizontally again , completing a convection cell .
plates move over earths surface because of _________ Q
a) conduction within the crust. b) radiation from the inner core. c) subduction in the outer core.
d) convection within the mantle. Context
Question move
causes
plates move
convection
to
a) 0.07 b) 0.089 c) 0.083 d) 0.758
thospheve
Diagram Parsing
Textual Context graph
Visual Context graph
Diagram
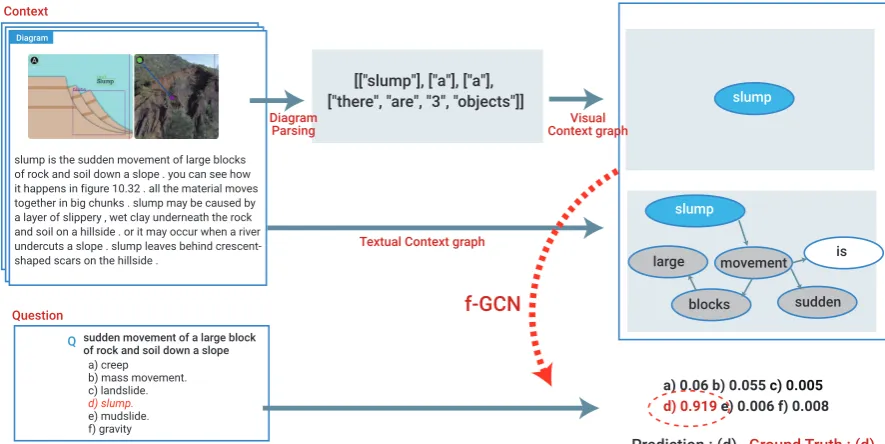
[["slump"], ["a"], ["a"], ["there", "are", "3", "objects"]]
slump is the sudden movement of large blocks of rock and soil down a slope . you can see how it happens in figure 10.32 . all the material moves together in big chunks . slump may be caused by a layer of slippery , wet clay underneath the rock and soil on a hillside . or it may occur when a river undercuts a slope . slump leaves behind crescent-shaped scars on the hillside .
sudden movement of a large block of rock and soil down a slope Q
a) creep b) mass movement. c) landslide.
d) slump.
e) mudslide. f) gravity
Context
Question sudden
movement
blocks large
slump
is
a) 0.06 b) 0.055 c) 0.005
d) 0.919 e) 0.006 f) 0.008 slump
f-GCN
Diagram Parsing
Textual Context graph
Visual Context graph
Prediction : (d) Ground Truth : (d)
f-GCN
continental
convection
oceanic
out core
[image:12.595.77.520.386.608.2]lithosphere cell Context Text Image QuestionText Image
Diagram
Prediction : (d) Ground Truth : (d)
[["osculum", "excurrent", "pore"], ["amebocyte"], ["spicule"], ["sporo cyte"], ["seculum"], ["rwater", "flow"], [ "lchoanocy", "te", "collar", "cell"], ["there" , "are", "7", "objects"], ["there", "are", "6", "stages"]]
___opening through which water flows out of a sponge
Q
a) porocyte. b) coral reef. c) spicule. d) osculum. Context
Question osculum
called
flows opening
through
the
a) 0.014 b) 0.008 c) 0.017 d) 0.918
a) 0.011 b) 0.021 c) 0.011
Diagram Parsing
Textual Context graph
Visual Context graph
Diagram
[["compounc", "or", "moleculc"], ["tissue"], ["organelle"], ["organ"], ["levels", "of", "organizatior"], ["atoms"], ["organism"], ["cell"], ["there", "are", "9", "objects"]]
______structure composed of two or more types of tissues that work together to do a specific task
Q
Context
Question
tissues
structure
composed types
organ
a
a) 0.144 b) 0.042 c) 0.709
d) 0.022e) 0.027 f) 0.028 g)0.028
f-GCN
Diagram Parsing
Textual Context graph
Visual Context graph
Prediction : (c) Ground Truth : (c)
sponges have several different types of specialized cells , although they lack tissues . you can see the basic sponge body plan and specialized cells in figure 12.4 . as water flows t hrough the sponge ,
oxygen diffuses from the water to the sponges cells . the cells also expel wastes into the water . the water then flows out of the sponge through an opening called the osculum .
e) porifera. f) amebocyte. g) cnidaria.
spicule seculum
osculum
amebocyte
sporo cyte pore excurrent
sponge
cells and organelles are made of biochemical mole cules . these include nuclei c acids and proteins . mole cules , in turn , are made of atoms . figure 3.6 shows these different levels of organization in living things . tissues may be organized
into organs . an organ is a structure composed of two or more types of tissue that work together to do a specific task . for example , the heart is an organ . it consists of muscle , nerve , and other types of tissues . its task is to pump blood . organ s may be organized into organ systems .
a) cell membrane. b) prokaryotic cell. c) organ. d) eukaryotic cell.
e) organelle. f) nucleus. g) ribosome.
organ organelle
compounc
tissue
atoms cell moleculc
or
f-GCN
[image:13.595.77.520.126.356.2]Context Text Image QuestionText Image
Diagram
Prediction : (c) Ground Truth : (c)
[["volcano", "links", "to", "continental", "crust"], ["oceanic", "crust", "links", "to", "continental", "crust"], ["contin ental", "crust"], ["volcano"], ["moun tam", "rangef", "l"], ["aerriding", "1", " plate"], ["trench"], ["asthenosphere"], ["oceanic", "crust"],["subducting", "pla te"],["there", "are", "12", "objects"] ]
a) mountain range. b) continental crust. Context
Question
crust destroyed
always collisons
is
oceanic
a) 0.036 b) 0.101 c) 0.803 d) 0.06 Diagram
Parsing
Textual Context graph
Question Diagram graph
f-GCN a convergent plate boundary forms where two
plates collide . that collision can happen between a continent and oceanic crust , between two oceanic plates , or between two continents . oceanic crust is always destroyed in these collisions .
c) oceanic crust. d) lithosphere.
oceanic seculum
crust
crust
asthenosphere trench volcano continental
GCN
which part of the earth is always destro yed at a convergent plate boundary ? Q
Diagram
Prediction : (a) Ground Truth : (a)
[["centrosome", "matrlx", "links", "to", "c entrioles"], ["centrosome", "matrlx", "lin ks", "to", "microtllamem"], ["centrosome ", "matrlx", "links", "to", "mlcrovllli"], ["mi crotllamem", "links", "to", "mlcrovllli"], [" microtllamem", "links", "to", "microtubu le"], ["microtubule", "links", "to", "mlcro vllli"], ["plasma", "membrane", "links", "to", "nucleus"], ["plasma", "membrane" , "links", "to", "nuclear", "envelope"], ["in termediate", "filaments", "links", "to", "o bject"], ["smooth", "endoplasmic", "retic ulum", "links", "to", "nucleolus"], ["nucle olus", "links", "to", "chromatins"], ["nucl eus", "links", "to", "nuclear", "envelope"], ["mitochondrion", "links", "to", "lysosom e"], ["mitochondrion", "links", "to", "cytos ol"], ["lysosome", "links", "to", "cytosol"], ["there", "are", "21", "objects"], ["there", "are", "20", "stages"]]
a) lysosome. b) nucleus. Context
Question
lysosome organelle
molecules unneeded
recycles
a
a) 0.962 b) 0.014 c) 0.014d) 0.01 Diagram
Parsing
Textual Context graph
Question Diagram graph a lysosome is an organelle that recycles unneed
ed molecules . it uses enzymes to break down the molecules into their components . then the components can be reused to make new mole cules . lysosomes are like recycling centers .
c) plasma membrane. d) chromatin.
lysosome seculum
mitochondrion
cytosol
microtllamem reticulum nucleolus chromatins
GCN
which of the following is an organelle that recycles unneeded molecules ? Q
f-GCN
Q
mlcrovllli
endoplasmic
microtubule matrix
smooth
[image:14.595.76.521.127.633.2]Context Text Image QuestionText Image
Prediction : (d) Ground Truth : (d)
[["plasma", "membrane", "links", "to", "m itochondria"], ["rough", "endoplasmic", "reticulum", "links", "to", "ribosomes"], ["nucleus"], ["plasma", "membrane"], ["cytoplasm"], ["lysosome"], ["golgi", "apparatus"], ["rough", "endoplasmic", "reticulum"], ["ribosomes"], ["smooth", "endoplasmic", "reticulum"], ["mitocho ndria"], ["there", "are", "10", "objects"], ["there", "are", "9", "stages"]]
a) plasma membrane. b) lysosome.
Context
Question
reticulum molecules
receives sent
packages
endoplasmic
a) 0.135 b) 0.069 c) 0.045 d) 0.75 Diagram
Parsing
Textual Context graph
Question Diagram graph
f-GCN
the golgi apparatus is a large organelle that sends proteins and lipids where they need to go . its like a post office . it receives molecules from the endoplasmic reticulum . it packages and labels the molecules . then it sends them where they are needed . some molecules are sent to different parts of the cell . others are sent to the cell membrane for transport out of the cell . small bits of membrane pinch off the golgi apparatus to enclose and transport the proteins and lipids . you can see a golgi apparatus at work in this animation :
c) mitochondria.
d) the rough endoplasmic reticulum and smooth endoplasmic reticulum.
rough plasma
ribosomes
apparatus
golgi GCN
where does the golgi apparatus receive molecules from ?
Q
Diagram
Prediction : (d) Ground Truth : (d)
[["nucleolus", "links", "to", "nucleus"], ["cell", "membrane", "links", "to", "mito chondrion"], ["cell", "membrane", "links", "to", "cell", "wall"], ["nuclear", "memb rane", "links", "to", "chloroplast"], ["nucl ear", "membrane", "links", "to", "nucleus"] , ["centrosome", "links", "to", "vacuole"], ["amyloplast", "links", "to", "chloroplast"] , ["chloroplast", "links", "to", "nucleus"], ["nucleolus"], ["cell", "membrane"], ["nuclear", "membrane"], ["golgi", "body"], ["cytoplasm"], ["cell", "wall"], ["centrosome"], ["ribosomes"], ["amy loplast"], ["mitochondrion"], ["chloro plast"], ["vacuole"], ["rougher"], ["smo other"], ["nucleus"], ["there", "are", "15", "objects"], ["there", "are", "15", "stages"]]
a) golgi body. b) ribosomes.
Context
Question
cells supports
membrane surrounds
protects
a) 0.048 b) 0.037 c) 0.072d) 0.843 Diagram
Parsing
Textual Context graph
Question Diagram graph
the cell wall is a rigid layer that surrounds the cell membrane of a plant cell . its made mainly of the complex carbohydrate called cellulose . the cell wall supports and protects the cell . the cell wall isnt solid like a brick wall . it has tiny holes in it called pores . the pores let water , nutrients , and other substances move into and out of the cell .
c) vacuole. d) cell wall.
cell rougher
cell
membrane nucleus nuclear membrane
GCN
which part surrounds and protects the cell ?
f-GCN
Q
mitochondrion
amyhloplast chloroplast
vacuole Diagram
reticulum endoplasmic
reticulum endoplasmic smooth
membrane
wall
[image:15.595.76.521.129.637.2]wall Context Text Image QuestionText Image
Prediction : (b) Ground Truth : (b)
[["amoeba"], ["cytoplasm"], ["food", "va cuole", "digests", "food"], ["contractile", "vacuols", "excretes", "water", "and", "waste"], ["food", "being", "engulfed", "by", "aseudopods"], ["nucleus"], ["cell" , "membrane"], ["pseudopod"], ["pseu dopods"], ["enchaniedleavnina", "com"], ["a"], ["there", "are", "11", "objects"], ["there", "are", "9", "stages"]]
a) contractile vacuole.
b) pseudopods.
Question
a) 0.028 b) 0.877 c) 0.03 d) 0.065
Diagram Parsing
Question Diagram graph
f-GCN
c) food vacuole. d) cell membrane.
cell
cytoplasm
GCN
what are temporary extensions of the cytoplasm ?
Q
pseudopod
contractile
[["flagellum"], ["euglena"], ["pseudopod"] , ["paramecium"], ["amoeba"], ["cilla"], ["b"], ["c"], ["a"], ["there", "are", "9", "objects"], ["there", "are", "3", "stages"]]
Context
pseudopod
extension
cytoplasm temporary
are
Diagram Parsing
Textual Context graph
Visual Context graph animal-like protists are called protozoa ( protozo
an , singular ) . most protozoa consist of a single cell . protozoa are probably ancestors of animals . protozoa are like animals in two ways : 1 . proto zoa are heterotrophs . heterotrophs get food by eating other organisms . some protozoa prey on bacteria . some are parasites of animals . others graze on algae . still others are decompo sers that break down dead organic matter . 2 . almost all protozoa can move . they have special appendages for this purpose . you can see differ ent types in figure 9.3 . cilia ( cilium , singular ) are short , hair-like projections . pseudopods are temporary extensions of the cytoplasm . flagella are long , whip-like structures . flagella are also found in most prokaryotes .
paramecium flagellum
pseudopod
amoeba cilla
heterotrophs
Diagram Diagram
euglena
vacuols
water
excretes
amoeba
membrane nucleus
Prediction : (b) Ground Truth : (b)
[["nuclear", "pore", "links", "to", "nucleo lus"], ["nuclear", "pore", "links", "to", "ribosomes"], ["nucleolus", "links", "to" , "nucleoplasm"], ["ribosomes", "links" , "to", "nucleolus"], ["heterochromatin" , "links", "to", "euchromatin"], ["heter ochromatin", "links", "to", "nucleolus"] , ["inner", "membrane", "links", "to", "outer", "membrane"], ["nuclear", "pore"] , ["nucleolus"], ["nucleoplasm"], ["ribos omes"], ["heterochromatin"], ["nuclear" , "envelope"], ["chromatin"], ["iological" , "diagram", "of", "a", "hum", "by", "char tsanddiagrams"], ["inner", "membrane"] , ["outer", "membrane"], ["euchromatin" ], ["human", "nucleus", "cell"], ["zizzle"], ["there", "are", "13", "objects"], ["there", "are", "8", "stages"]]
a) 1. b) 2 . c) 3. d) 4. Question
a) 0.157 b) 0.518 c) 0.189 d) 0.136
Diagram Parsing
Question Diagram graph
f-GCN
nucleoplasm
membrane GCN
how many membrane layers are there ?
Q
membrane nuclear
[["two", "layers", "of", "phospholipid", "molecules"], ["hydrophilic", "head"], ["hydrophobic", "tail"], ["there", "are", "3", "objects"], ["there", "are", "2", "sta ges"]]
Context
two
membrane
cytoplasm composed
layers
Diagram Parsing
Textual Context graph
Visual Context graph
the structure of the cell membrane explains how it can control what enters and leaves the cell . the membrane is composed mainly of two layers of phospholipids . figure 3.8 shows how the phosp holipids are arranged in the cell membrane . each phospholipid molecule has a head and two tails . the heads are water loving ( hydrophilic ) , and the tails are water fearing ( hydrophobic ) . the water-loving heads are on the outer surfaces of the cell membrane . they point toward the watery cytoplasm within the cell or the watery fluid that surrounds the cell . the water-fearing tails are in t he middle of the cell membrane .
phospholipid
two
molecules of
phospholipids
Diagram Diagram
layers
pore
nucleolus
ribosomes
outer
heterochromatin inner hydrophilic
head
hydrophobic tail
structure cell
[image:16.595.88.511.111.652.2]Context Text Image QuestionText Image
Prediction : (c) Ground Truth : (c) [["anal", "pore"], ["macronucleus"],
["micronucleus"], ["food", "vacuolesf"], ["cilia"], ["there", "are", "5", "objects"], ["there", "are", "5", "stages"]] Question
a) 0.107 b) 0.188 c) 0.558 d) 0.147
Diagram Parsing
Question Diagram graph
f-GCN
GCN
what are the hair-like protrusions on the outside called ? Q
cilla anal
[["flagellum"], ["euglena"], ["pseudopod"] , ["paramecium"], ["amoeba"], ["cilla"], ["b"], ["c"], ["a"], ["there", "are", "9", "objects"], ["there", "are", "3", "stages"]] Context
projections
are hair-like short
Diagram Parsing
Textual Context graph
Visual Context graph
animal-like protists are called protozoa ( protozo an , singular ) . most protozoa consist of a single cell . protozoa are probably ancestors of animals . protozoa are like animals in two ways : 1 . protoz oa are heterotrophs . heterotrophs get food by eating other organisms . some protozoa prey on bacteria . some are parasites of animals . others graze on algae . still others are decomposers that break down dead organic matter . 2 . almost all protozoa can move . they have special appendages for this purpose . you can see different types in figure 9.3 . cilia ( cilium , singular ) are short , hair-like projections . pseudo pods are temporary extensions of the cytoplasm . flagella are long , whip-like structures . flagella are also found in most prokaryotes .
paramecium flagellum
pseudopod
amoeba cilla
cilla
Diagram
euglena
pore
food
vacuoles
micronucleus macronuclueus
Prediction : (d) Ground Truth : (d) [["object", "links", "to", "golgi", "vesicles"]
, ["filamentous", "cytoskeleton", "links", "to", "jlasma", "membrane"], ["smooth", "endoplasmic", "reticulum", "links", "to", "ribosomes"], ["nucleus", "links", "to", "l", "nucleolus"], ["nucleus", "links", "to" , "luclear", "envelope"], ["cell", "wall", "links", "to", "object"], ["cell", "wall", "lin ks", "to", "jlasma", "membrane"], ["cyt oplasm", "links", "to", "peroxisome"], ["l", "nucleolus", "links", "to", "luclear", "envelope"], ["tonoplast", "links", "to", "l", "vacuole"], ["object", "links", "to", "jlasma", "membrane"], ["there", "are", "21", "objects"], ["there", "are", "23", "stages"]]
a) amyloplast. b) smoother . c) ribosome. d) large central vacuole.
Question
a) 0.115 b) 0.155 c) 0.146 d) 0.584 Diagram
Parsing
Question Diagram graph
f-GCN
nucleoplasm
membrane GCN
which part of the following cell takes up the most its volume ?
Q
membrane nuclear
[["large", "central", "vacuole"], ["cell", "wall", "cellulose"], ["nucleus", "with", "nucleolus"], ["cell", "membrane"], ["smoother"], ["golgi", "body"], ["roug her"], ["mitochondria"], ["amyloplast"], ["ribosome"], ["chloroplast"], ["there", "are", "11", "objects"], ["there", "are", "9", "stages"]]
Context
large
volume
helps vacuole
central Diagram
Parsing
Textual Context graph
Visual Context graph
most plant cells have a large central vacuole . it can make up as much as 90 percent of a plant cells total volume . the central vacuole is like a large storage container . it may store substances such as water , enzymes , and salts . it may have other roles as well . for example , the central vacuole helps stems and leaves hold their shape . it may also contain pigments that give flowers their colors .
phospholipid two
molecules of
most
Diagram
layers
pore
nucleolus
ribosomes
outer
heterochromatin inner hydrophilic
head
hydrophobic tail
total cells Context Text Image QuestionText Image
Diagram Diagram
a) anal pore. b) macronucleus.
[image:17.595.89.512.110.661.2]c) cilia. d) oral groove.