RD expenditures - growth nexus in
Turkey
Ulger, Ozlem and Uçan, Okyay
4 April 2018
Online at
https://mpra.ub.uni-muenchen.de/91060/
R&D EXPENDITURES - GROWTH NEXUS IN TURKEY
* Assistant Professor Özlem ÜLGER1Associate Professor Okyay UÇAN2
ABSTRACT
Technological development and investment in knowledge seem to be very important in order for countries to demonstrate effective growth performance. The first concept that comes to mind when investing in information is the R&D activities. In the past, efforts to develop in countries for years can be realized within months nowadays and technological developments have rapidly changed and can be worn out in a short period of time. Therefore, it can be said that the information economy is the speed economy. The aim of this study is to investigate the relationship between R&D expenditures and GDP in Turkey for the period 1996-2014 with the help of VAR analysis. Before the study, it was determined whether the series were stationary by Augmented Dickey Fuller (ADF) and Phillips-Peron (PP) unit root tests and it was determined that the variables of GDP and R&D expenditure were stationary in the level values. According to the results of variance decomposition and effect-response functions; It is seen that the effect of GDP changes in Turkey on R&D expenditures is negligible. However, it is seen that R&D expenditures are significantly affected by the changes in GDP.
Key Words: R&D Investments, R&D Incentives, Technological Development, Economic Growth, Innovatıon
TÜRKİYE’DE AR
-
GE HARCAMALARI VE BÜYÜME ARASINDAKİ İLİŞKİ
ÖZET
Ülkelerin etkili bir büyüme performansı gösterebilmesi için teknolojik gelişmenin ve bilgiye yatırım yapılmasının oldukça önemli olduğu görülmektedir. Bilgiye yapılan yatırım denilince de ilk akla gelen kavram Ar-Ge
faaliyetleridir. Geçmişte ülkelerde yıllarca devam eden gelişme çabaları günümüzde aylar içinde gerçekleşebilmekte ve teknolojik gelişmeler hızlı bir şekilde değişim göstererek kısa bir süre içinde yıpranabilmektedir. Dolayısıyla bilgi ekonomisinin hız ekonomisi olduğu söylenebilir. Bu çalışmanın amacı, Türkiye’de 1996-2014 dönemi için Ar-Ge harcamaları ve GSYİH arasındaki ilişkiyi VAR analizi yardımıyla
araştırmaktır. Çalışmada önce durağanlığın belirlenmesi için Augmented Dickey Fuller (ADF) ve Phillips-Peron
(PP) birim kök testiyle serilerin durağan olup olmadıkları belirlenmiş ve GSYİH ile Ar-Ge harcamaları
değişkenlerinin seviye değerlerinde durağan oldukları tespit edilmiştir. Varyans ayrıştırma ve etki-tepki
fonksiyonlarına ait sonuçlara göre; Türkiye’de GSYİH değişimlerinin Ar-Ge harcamaları üzerinde etkisinin yok
denilebilecek kadar az olduğu görülmüştür. Ancak Ar-Ge harcamalarının GSYİH’daki değişimlerden oldukça
etkilendiği görülmektedir.
Anahtar Kelimeler: AR-GE Yatırımları, AR-GE Teşvikleri, Teknolojik Gelişme, Ekonomik Büyüme, İnovasyon
*This article is produced from doctorate thesis.
1Assistant Professor Özlem ÜLGER, Batman University, [email protected]
2Associate Professor Okyay UÇAN, Nigde Omer Halisdemir University, [email protected]
Makale Gönderim Tarihi / Received : 04.05.2018
58
Introduction
New technologies are emerging as the end result of R&D activities and at the same time productivity is increasing and economic growth is taking place. The role of R&D in economic growth is seen more in the theoretical and empirical studies. Since a large number of countries are aware of this, it is seen that they have given serious support to R&D activities in recent years.
It is important for the countries to achieve a sustainable economic growth. What is important in terms of countries is ensuring a sustainable economic growth. It can be said that one of the most important elements of this is R&D. Because countries that increase technological capacity and raise the quality of education through supporting R&D activities seem to be able to achieve sustainable growth.
Today, it is possible to measure the development levels of the country's economies with some R&D indicators. These indicators countable as scientific publications, communication expenditures, patents, trademark numbers, R&D employment and advanced technology exports. It is better understood when the R&D activities in Turkey are compared with those of developed countries.
In this context, this study consists of six parts. In the first part, a general conceptual framework of R&D activities is dealt with. In the second part, in Turkey R&D expenditures and their importance is given. In the third chapter, the relationship between R&D expenditures and growth is addressed. In the fourth chapter, literature search was done and in the fifth part, the data and method of the research are discussed. In the conclusion section, research findings were also evaluated.
1.
General Framework of R&D Activities
As the English philosopher Francis Bacon noted in the early 17 th century, "Information is a Power Source" of science reveals how important science is in terms of the prosperity and development of mankind. Today, the most important condition for competing in the international arena is investing in knowledge, namely R&D.
59
The concept of R&D covers three main activities (OECD,2004):
Basic Research; It is the study of the acquisition of new information on the facts that are
observable with theoretical or practical work and the elements underlying the phenomena. These studies are usually published in scientific journals if they are not specific.
Applied Research; It is original activities aimed at acquiring new information for a certain
practical purpose or goal. The information obtained here is mostly patented but may be kept confidential, if necessary.
Experimental Development; It is systematic studies for the production of tools, products and new materials for the creation of services, systems and new processes, or improvement of existing ones, using information gained from research and practical experience.
R&D is also one of the most important channels that international investment creates added value. It is seen that more than two thirds of all R&D activities carried out in the world by the industry are carried out by international companies (YASED, 2013). Therefore, the development of R&D activities along with the increase of R&D investments and the withdrawal of international technology investments by the underdeveloped countries into their own borders is very important for their growth and development. The increase in the capacity of technology transfer and assimilation of technology seems to explain very well the great differences between the growth rates of both developing countries
and the growth rates in the past (Öz, 2011).
It is ensuring a sustainable economic growth that is important for the governments of the country. Innovation, which has become a driving force in achieving sustainable growth by years, has become so important in terms of economic policies that it is important in terms of science and technology policies (Korkmaz, 2010: 3321). Innovation activities cover all financial, commercial, organizational, scientific and technological steps that will actually leading or leading to the realization of innovations. Innovation may or may not include R&D activities. One of the essential features of innovation must be realized (OECD, 2005). In this context, The difference between R&D and innovation is expressed in a simple but clear way by the former president of Finland, Esko Aho, as a process that turns knowledge
of R&D money and returns innovation knowledge to the currency (Anlağan, 2011).
Production of new information technologies in conjunction with R&D are provided. New technologies are the result of R&D activities, which in turn increases productivity and leads to economic growth. The technology used to promote economic growth, to address social problems such as the environment and health, and at the same time to increase the productivity of production factors in order
to improve living standards, is produced by R&D. (Doruk ve Söylemezoğlu, 2014:2). That is why,
60
countries that give more importance to the development of R&D are developing new technologies and providing competitive advantage (Bozkurt, 2015:188).
Research and development efforts are almost a war of existence in today's hard and ruthless competition environment. Therefore, businesses that are active in a dynamic environment that is rapidly changing economically and technically need to take part in a continuous change so that they can realize their objectives and maintain their assets. It is one of the main purposes of the R&D function to ensure that enterprises operating in a constantly changing environment are able to keep up with these changes, help them to develop and grow, and consequently ensure the continuity of their assets (Zerenler vd., 2007:657-658).
According to Romer, in the model consisting of three sectoral structures (R&D sector, intermediate goods sector and final goods sector), R&D sector uses human capital together with current stock of knowledge to produce new information.The new manufacturer produces more durable designs. An intermediate commodity sector is always using new designs in the R&D sector together with previously known products so that it can produce a large number of goods that are available for use in final goods production (Romer, 1990: 79). In this context, information will contribute to the production process to produce a new design, a more modern breakthrough. Therefore, the reason why the new design is affecting the efficiency of the human capital in the R&D sector in the positive direction is the increase in the total stock of information available in the economy. These contributions, which are related to the production phase of knowledge, will contribute to economic growth by providing an increase in the efficiency of the inputs used in the production of final products.The objective is to open the public partly to the fact that profit-oriented prosperity and rational economic units are innovating and profit-making benefits are minimized.As a result of this situation, the information technology will continue to grow at an accelerated rate, but internalized technological progress will be achieved (Ercan, 2000: 132).
2.
R&D Expenditures in Turkey
The ability of developing countries to sustain and at the same time strengthen their competitive position in the global environment is dependent on their growth being linked to productivity gains and creating new areas of comparative advantage. Depending on this, It is of great importance to increase the capacity of science and technology, to attach importance to innovativeness, to the effective use of information and communication technologies. In other words, it can be said that the way to innovation is the importance given to R&D (ISTKA, 2017).
61
level of technological development is of great importance. It can also be said that developed countries' budgets to allocate for R&D activities also contribute to the economic growth and development stages
(İncekara vd., 2014:2).
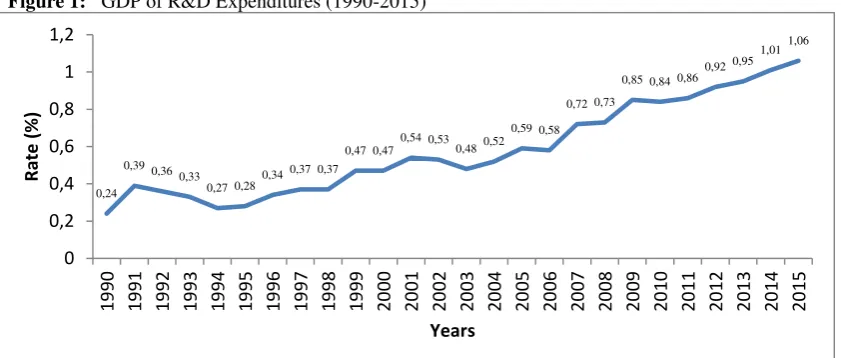
Figure 1: GDP of R&D Expenditures (1990-2015)
Source: OECD, (Online) https://data.oecd.org/rd/gross-domestic-spending-on-r-d.htm, Date of access: 23.12.2016
Technologically developed economies are characterized as developed countries, and these countries have the opportunity to compete with world economies. In terms of developed countries, it is observed that Turkey is inadequate when R&D indicators are compared. Accurate adoption of new economic understanding in Turkey will make an important contribution to the development of technologically. In the new economic order is used knowledge-based production instead of labor and capital. At the same time, it depends on which to what extent employees have adopted information so that they can survive on good terms and to what extent they are clear to innovations so that firms can
profitably survive their assets. In addition to this, ıt is provided to productivity and efficiency increase,
ıt is also obtained cost and competitive advantage. With this success to be provided in micro units
country economies can to derive benefit from advantage of the new economy in issues of employment,
growth and foreign trade (Ünal and Nisa, 2013: 12-13).
The increase in the ratio of R&D spending to GDP in Turkey over the years is shown in figure 1, accordingly, the R&D expenditure to GDP ratio in Turkey in 1990 24%, it is observed that an increase of 15% to 39% in 1991. The ratio of R&D expenditures to GDP shows an upward trend with a fluctuating course from 1990 to 2014. It is possible to say that it reached the highest level in 2015.
It is imperative that Turkey attaches more importance to R&D and efficiency activities in order to reach to the top 10 economies in 2023 and to reach the determined national targets (domestic automobile, domestic aircraft, domestic helicopter etc.). Despite the significant increase in the resources allocated to R&D and innovation in our country, the share of R&D expenditures in GDP is still not at the desired level (GDPRD\GDP). Considering the R&D intensity targets set of other countries for the years 2020, it is also important to identify motivational R&D targets to contribute to the 100 th anniversary of the Republic of Turkey to have a higher competitive power. In this context, it is
0,24
0,39 0,360,33
0,27 0,280,34 0,37 0,37
0,47 0,470,54 0,530,480,52 0,59 0,58
0,72 0,73
[image:6.595.74.495.139.318.2]62
[image:7.595.77.463.167.352.2]assessmented that the target of the GDPRD/GDP ratio of our country can be determined as 3%. For the target rate of 3% for 2023, an increase of 18% per year in R&D expenditures and 10% per annum in GDPRD\GDP is required (TÜBİTAK, 2011).
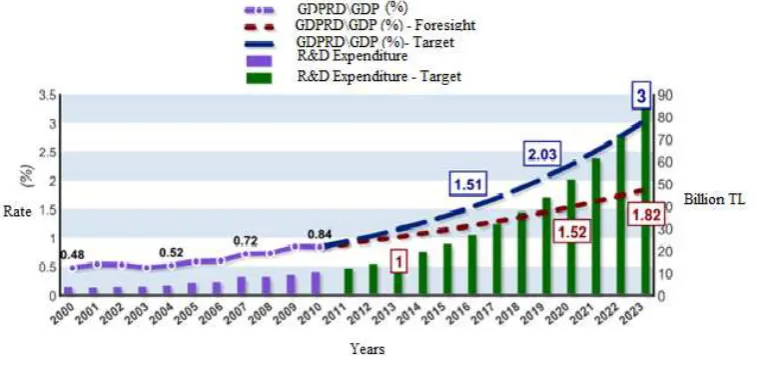
Figure 2: R&D Intensity and R&D Spending Targets and Foresights In 2023
Source: TÜBİTAK, 2011, Ulusal Yenilik Sistemi 2023 Yılı Hedefleri (2011\101),
https://www.tubitak.gov.tr/tubitak_content_files//BTYPD/BTYK/btyk23/BTYK_23_yeni_kararlar_toplu.pdf, Date of access:14.10.2016.
When figure 2 is examined, It is seen that R&D expenditure must reach at least 85 billion TL in order for the ratio of R&D intensity to reach 3% in 2023. It falls to the private sector an important role in this regard. Given that private sector R&D spending is the driving force and that it is aimed to increase the role of the private sector in existing policies and support mechanisms, particularly in the National Science, Technology and Innovation Strategy 2011-2016, the vast majority of R&D expenditure of 85 billion TL needs to be realized and expected by the private sector (TÜBİTAK, 2011).
63
3.
Relationship Between R&D Expenditures and Economic Growth
Economists generally put forward that per capita income is a determining factor in growth through the development of the effects of long-term growth potential. In the short term, productivity and employment growth can be improved to some extent through investments, but what is important is the development of long-term productivity intensity. The main determinant of productivity growth is education investments in R&D and human capital investments. Endogenous growth models in terms of policy implementation usually depends on long-term growth rate of savings\investment rates. Public policy, R&D subsidies and training investments, which help to increase saving rates, can be effective the growth of economies. The key element of the internal growth theories is internalization of the GDP ratio. Therefore, production can not only explain the physical capital such as building and equipment in terms of material, but also must be taken into consideration the intangible capital such as human capital and R&D. In the model of new growth theory, the development of R&D and indirect knowledge have an important place. R&D not only provides profitability but also contributes to other actors of the economy. Therefore it is necessary to encourage the spreading effects of knowledge, skills and knowledge (Bozkurt, 2015: 189-190).
Basically, there are two ways to increase productivity in the economy. The first is to increase the number of entries in the production process. The second is to find a new way of getting more output with the same number of entries. In this instance, when we look at the positive relationship between R&D expenditures and growth, in the years 1870-1950, an examination of the US economy was carried out, taking into account the increase in labor and capital inflows and the increase in output. A unit labor and one unit capital increase were reached 15% of the contribution to economic growth. To explain statistically, it was found that there was an unexplained "residue" of 85% between the input and the output. In the same way, Robert Solow, who won the Nobel Prize, achieved the same results by using a different method and a different time period. Most of the economists have come to the conclusion that 85% of originated from technological innovations (Rosenberg, 2004: 1-2).
In order to provide a positive contribution to economic growth, a number of advantages must need to gain from the economic activities of R&D expenditures. These advantages can be listed as follows (SMMO, 2016):
Competitive Advantage: R&D expenditure in technological development is one of the most
important factors determining the country's competitiveness at international level.
Pulling Foreign Capital: The technological capability of the country is an important factor both
in attracting direct foreign capital investments to the country and in making foreign companies' technology-oriented investments in the country.
Productivity Growth: R&D expenditures are the most important factor to increase productivity
64
information and technology emerging as a result of R&D expenditures, it will be beneficial for humanity by solving the problems in fields such as environment, health, economy.
Escaping from Technological Dependence: R&D expenditures are also among the factors that
save countries from being dependent on other countries in the technological direction. At the same time, R&D activities are an important influence not only production increase and ensure economic performance, but also at realizing social objectives.
R&D expenditures have been pointed out as an important engine for growing internal models according to the claim behind the speed of technological progress of economic and theoretical factors (Bebczuk, 2002: 110). Therefore, in the majority of empirical studies show that there is an important and positive relationship between economic growth and R&D expenditures. The role of R&D is to develop new production techniques which are the production of current products and to produce new products. R&D is a necessary input in the production process, but it should not be seen as a silver bullet to promote economic growth rapidly. In this context, the countries that have gained competitive advantage produce products that are technologically advanced. Likewise, with an important relationship between the resources allocated to R&D and economic growth, increasing the number of personnel working in the field of R&D reveals an important relationship between economic growth (Sylwester, 2001: 72).
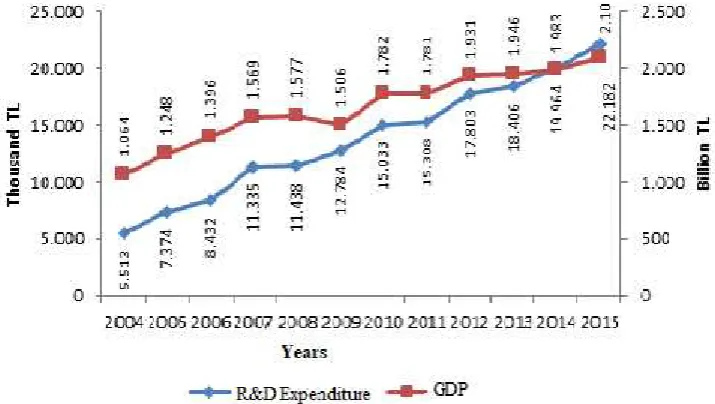
65 Figure 3: R&D Expenditures and GDP Comparison In Turkey (2004-2015)
Source: TÜİK, 2016, (Online), http://www.tuik.gov.tr/PreTablo.do?alt_id=1082, Date of access: 15.05.2016
At the Figure 3 is compared R&D expenditures and GDP. According to this, while R&D expenditure was 5.513 thousand TL in 2004, GDP was 1.064 billion TL. In 2009, there was a decrease in GDP and although R&D expenditures were realized as 1.404 thousand TL, R&D expenditures increased and it was realized as 11.921 thousand TL. Furthermore, while R&D expenditure was realized as 22.182 thousand TL in 2015, GDP was realized as 2.101 billion TL.
1.
Literature
When we look at the literature, it is seen that there are many studies examining the relation between R&D expenditures and growth. Literature review which is done is available in the following.
Lichtenberg (1993) examined the relationship between private sector and public-sector financed R&D expenditures and economic growth using the Mankiw-Romer-Weil (MRW) model in him 1964-1989 period and 74 countries. According to this, R&D expenditures financed through the private sector have been found a positive and significant relationship not only in growth but also in productivity, but there has been found no causal a link between R&D expenditures and economic growth in the public sector.
66
Park (1995) studied the relationship between R&D expenditures and factor productivity in the period of 1970-1987 and 10 OECD countries. In him work, using panel data set, it has concluded that the increase in total factor productivity is an important determinant.
Ceo and Helpman (1995), in the study covering the period 1971-1990 and 24 countries, have examined the relationship between total factor productivity, domestic R&D activities and foreign R&D activities. They have used cointegrated equations in their work and have found that all variables are a coherent relationship with each other.
Griliches (1998), in studying that he had done by handling the US economy, has examined the relationship between R&D expenditures financed through the private sector and the public sector and economic growth by making Regression Analysis. In the investigation, he has found that a 10% increase in R&D spending resulted in a 7% increase in real income. Another finding in the study is that the R&D expenditures provided by the private sector are higher in economic growth than the R&D expenditure provided by the public sector.
Bilbao-Osorio and Rodriguez-Pose (2004) have used the Linear Regression Model to investigation the R&D spending in countries that are members of the European Union, by taking into account the relationship both innovation and economic growth. Accordingly, they have reached the conclusion that R&D expenditures accelerated the process of economic growth by creating positive effects in the innovation phase.
Zachariadis (2004) in order to examine the effect of R&D expenditures on economic growth, has examined the period of 1971-1995 with the help of Regression Analysis in him study covering 10 OECD countries. As a result of the study, the increase in R&D spending has reached both the growth rate in productivity and the positive effect of the increase in the output level.
Falk (2007) examined the relationship between R&D expenditures and high-tech R&D investments in per capita income for the period 1970-2004 through Panel Data Model, taking into account 15 OECD countries. According to the results of the study, the increase in R&D expenditures and R&D investments for high technology have been reached the result not only in per capita GDP but also a positive effect on GDP per worker.
Wang (2007) applied Autoregressive and Random Walk Models using data from 23 OECD countries and 7 OECD countries. According to this, he has reached the conclusion that countries need to use R&D expenditures effectively so that they can achieve a more efficient economic growth performance.
67
that R&D expenditures in federal countries as well as the relationship between R&D expenditures in defense sector and growth are strong.
Samimi and Alerasoul (2009) analyzed the relationship between R&D expenditures and economic growth using the Panel Data Method in their study of 30 emerging economies in the period 2000-2006. According to the results of the study, they have stated that developing countries such as Turkey should develop their R&D activities to achieve a more efficient economic growth rate, even though there is a meaningless relationship across the panel.
Horvath (2011), in his study, has examined the relationship between R&D activities and long-run economic growth using the Bayesian Model. Accordingly, he has reached to the conclusion the positive effect of R&D activities on long-term growth.
Eid (2012) tried to explain the impact of R&D expenditure on productivity growth through the Dynamic Panel Data Analysis, taking into account 17 OECD countries with high income levels in the period 1981-2006. Accordingly, he has reached the conclusion that a meaningful and positive effect emerged the increase which occur in productivity in the later periods after the year when the R&D expenditures took place.
Mike and Oransay (2015) used the Extended Dickey Fuller (ADF) Unit Root Test in relation to between the number of patents and foreign direct investment in Turkey using 1975-2013 period data. At the same time, they have applied the Vector Autoregression (VAR) Model and the cointegration analysis to determine the optimal lag length. According to the result of the study, they have reached a conclusion that GDP has a positive relationship between foreign direct investment and foreign exchange, as well as the number of infrastructures and patents.
Ülger and Durgun (2017), have used VAR analysis to explain the relationship between R&D expenditure and GDP in selected OECD countries (France, Italy, Slovenia and Poland) using 1996-2015 period data.In order to determine the stability before the study, they have performed Augmented Dickey Fuller (ADF) and Philliphs Perron (PP) unit root test.According to the unit root test results, all series are found to be stable at the level.The results of variance decomposition and impact-response functions reached the conclusion that any change in R&D had no significant effect on the GDP balance, but that GDP had a significant effect on R&D.
Ülger (2017) has tested the relationship between R&D and Growth for 38 OECD countries with Panel Data Causality Test using 1996-2015 data.First, whether or not the series have unit root has determined by Im, Peseran and Shin (2003) unit root test.According to the unit root test results, the first differences of the GDP and R&D series have found to be stable.R&D has increased by 1 unit while GDP has increased by 11,484 units, which means that there is a positive relationship between them.
Tarı and Alabaş (2017) has analyzed the relationship between R&D expenditures and economic
68
consist of four parts. The first chapter ‘’entrance’’ part consist of. In the second part, the studies in the literature and theoretical foundations of relationship between R&D and economic growth have
discussed. “Methodology and Terminology” in the third section, belongs to a part of the study methods
and data applications have introduced; the fourth section presents the results of practice tests have given. As a result of the findings obtained, it has concluded that spending on R&D affects positively the economic growth in the short and long term. It is important for the Turkish Economy to increase the expence of R&D sistematically in the long term in order to achieve sustainability.
2.
Empirical Method
Before starting to work with the series, it is necessary to investigate whether the series are stationary.For this reason, firstly, whether the series are stationary or not is tested with a unit root test. The effects of R&D expenditures on Gross Domestic Product has been investigated with the Vector AutoRegressive Model (VAR) model developed by Sims (1980) and based on the Granger causality test model, which allows the analysis of the relationship between selected variables. Since the individual coefficients in the predicted Vector AutoRegressive Model (VAR) models are difficult to interpret, effect-response analysis and variance decomposition methods have been investigated how shocks in the error terms affect the variables in the VAR model in what direction and in what extent.
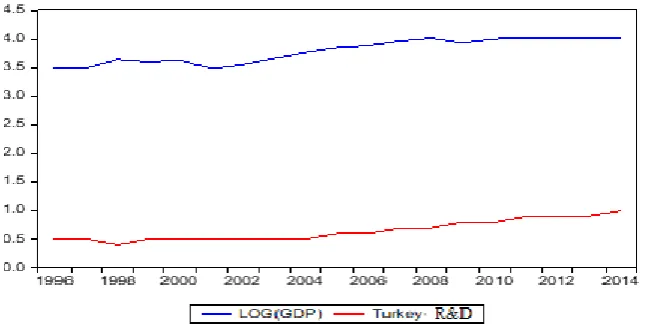
Between 1996 and 2014, R&D expenditures and Gross Domestic Product (GDP) annual data has been used in the study. For all tests and estimates, Econometric Views (Eviews, version 9.0) computer package program has been used. The series used in the study has taken from the OECD. The variables used in the analysis of the series are listed below.
Data used in the study:
R&D; R&D expenditures (Million dollars)
[image:13.595.69.392.574.739.2]GDP; Gross Domestic Product (Million dollars)
69
The causality relationship between every the two variables has been tested by the causality test developed by Granger (1969). For this reason, the data has been first subjected to the stationarity test. Augmented Dickey-Fuller (ADF) and Johansen Cointegration unit root test have been used in the stationarity test.
3.
Stability Test
Granger & Newbold (1974) stated that a spurious regression problem could be encountered when working with non-stationary time series. Using the non-stationary series may lead to unreliable results, while no problems are observed in the results obtained in studies where stationary series are
used. Namely, ıt may be come across with a spurious regression problem in the regression to be obtained.
In this case, the result obtained by the regression analysis does not reflect reality. The time series used in this study have been looked to be stationary in the first difference with the Extended Dickey-Fuller (ADF) test, and it has been shown the ADF test results of the variables in table 1. In the first stage of the time series used in this study, the logarithm of this variable has been taken to stabilize the variance and for the average of the GDP variable. The ADF exam results for variables are shown in table 1.
Table 1: Augmented Dickey-Fuller Unit Root Test Results in Turkey
Augmented Dickey-Fuller Unit Root Test Results
Constant-Trend in Level Constant-Trend in First Difference
Variables Test Statistic Prob. Value Test Statistic Prob. Value
R&D Expenditure -3,1198 0,1349 5,3880 0,0022
Log(GDP) -2,5422 0,3066 -2,8808 0,0066
[image:14.595.71.511.586.653.2]As seen in table 1, it can be seen that the R&D and GDP variables for Turkey are stable in the first differences. Since both variables are I (1), cointegration may be done. Whereas one of the first steps of the Granger causality test, which is widely used to determine the direction of the relationship between variables, is the unit root test, the Lag length being used in the model in the next stage must be determined. For this purpose, Lag lengths of variables are determined together.
Table 2: VAR Lag Order Selection Criteria for Turkey
Lag LogL LR FPE AIC SC HQ
0 12.26181 NA 0.001096 -1.140201 -1.041271 -1.126560 1 55.82702 72.60868* 1.36e-05* -5.536335* -5.239545* -5.495412* 2 58.03845 3.194300 1.70e-05 -5.337606 -4.842955 -5.269400
* indicates lag order selected by the criterion
LR: sequential modified LR test statistic (each test at 5% level) FPE: Final prediction error
AIC: Akaike information criterion SC: Schwarz information criterion HQ: Hannan-Quinn information criterion
70 Table 3: Johansen & Juselius Co-integration Test
Unrestricted Cointegration Rank Test (Trace)
Hypothesized Trace 0.05
No. of CE(s) Eigenvalue Statistic Critical Value Prob.**
None * 0.850697 34.25263 15.49471 0.0000 At most 1 0.001143 0.020586 3.841466 0.8858
Trace test indicates 1 cointegrating eqn(s) at the 0.05 level * denotes rejection of the hypothesis at the 0.05 level **MacKinnon-Haug-Michelis (1999) p-values
Unrestricted Cointegration Rank Test (Maximum Eigenvalue)
Hypothesized Max-Eigen 0.05
No. of CE(s) Eigenvalue Statistic Critical Value Prob.**
None * 0.850697 34.23204 14.26460 0.0000 At most 1 0.001143 0.020586 3.841466 0.8858
Max-eigenvalue test indicates 1 cointegrating eqn(s) at the 0.05 level * denotes rejection of the hypothesis at the 0.05 level
**MacKinnon-Haug-Michelis (1999) p-values
[image:15.595.73.315.448.763.2]From the table 3, it is seen that there is 1 long-term relationship between both maximum
equivalence and trace tests. The rejection of the "none" null hypothesis indicates that there is at
least one cointegration vector. In the table below shows the error correction model.
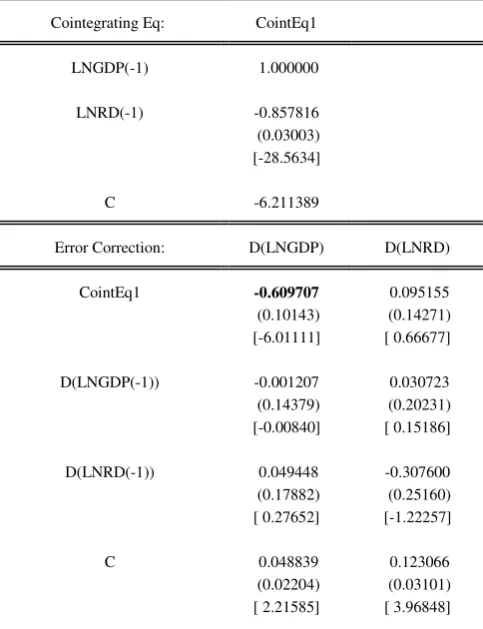
Table 4: Vector Error Correction Estimate for Turkey
Cointegrating Eq: CointEq1
LNGDP(-1) 1.000000
LNRD(-1) -0.857816
(0.03003) [-28.5634]
C -6.211389
Error Correction: D(LNGDP) D(LNRD)
CointEq1 -0.609707 0.095155
(0.10143) (0.14271)
[-6.01111] [ 0.66677]
D(LNGDP(-1)) -0.001207 0.030723
(0.14379) (0.20231)
[-0.00840] [ 0.15186]
D(LNRD(-1)) 0.049448 -0.307600
(0.17882) (0.25160)
[ 0.27652] [-1.22257]
C 0.048839 0.123066
(0.02204) (0.03101)
71
The 0.60 value shown in bold according to the table is the error correction coefficient. This number should be between 0 and -1 and the T statistic should be statistically significant. According to this, the T-statistic is 6.011 so coefficient is significant. 0.60 means 1 / | 0.60 | = 1.66 is the indicator that the volatility in the short term will be eliminated and converges the long term equalance. Since annual data is used, 1.66 is called as about 1.66 years.
Conclusion
The most important conditions to take place in the developed countries category in terms of development and international competition of Turkey is to the development of new technologies and the production of products with high value. It was seen that R&D and innovation were not needed in Turkey before the 1980s but with the "export-based and open-ended economic growth model" adopted on January 24, 1980, domestic producers were face to face external competition, creating a need for R&D and innovation. It is observed that with the importance on R&D and innovation, it also prevents brain migration.Thanks to new and different investments to be realized, the successful science, science and scientists present in the country will not go to the more developed countries. As a result, brain migration will have prevented thanks to the importance given to R&D and innovation. In this context, the relationship between R&D expenditures and growth in Turkey has been tried to be examined empirically.
In this study, the relationship between R&D expenditures and growth in Turkey between 1996 and 2014 has been examined using VAR Analysis. Firstly, with Augmented Dickey Fuller (ADF) and Phillips-Perron (PP) unit root tests have been determined whether the series have stationary and GDP with R&D expenditure variables have been found to be stationary in the level values. On the other hand, the direction of the short-term relationship between the variables has been tested with the Granger Causality Test. Then, the appropriate delay length for the VAR Analysis has been determined to be three and Variance Decomposition and Impulse Response Analyzes have been performed according to the length of this delay. According to the results of the obtained variance decomposition, it has been seen that the effect of GDP changes in Turkey on R&D expenditures is negligible. In addition, it has been reached a conclusion that GDP has also been affected by changes but only in R&D by 0.46% in the 9 th period. However, it is seen that R&D expenditures are significantly affected by the changes in GDP.
REFERENCES
Anlağan, Ö. (2011). Temel Ar-Ge ve Yenilik Kavramları. 27 Ocak, Ankara, http://www.emo.org.tr
Bebczuk, R. N. (2002). R&D Expenditures And The Role Of Government Around The World. Estudios De Economia, Vol. 29, No. 1, pp. 109-121, p.110.
Bilbao-Osorio, B. & Rodriguez-Pose, A. (2004). From R&D To Innovation and Economic Growth In The EU. Growth and Change, 35 (4), pp.434-455.
72
Bursa Serbest Muhasebeci Mali Müşavirler Odası. (2016). (çevrimiçi)
http://www.bursa.smmmo.org.tr/bsmmmo2/?blm=makale&ksm=132AGE.pdf, Erişim Tarihi:
15.07.2016
Ceo, D. T. & Helpman, E. (1995). International R&D Spillovers, European Economic Review. Vol. 39, No. 5, pp. 859-887.
Doruk, Ö.T. & Söylemezoğlu, E. (2014). Gelişmekte Olan Ülkelerde Ar-Ge’ye Dayalı Büyümenin Varlığının
Sınanması.Üretim Ekonomisi Kongresi, ss. 1-13.
Eid, A. (2012). Higher Education R&D and Productivity Growth: An Emprical Study on High Income OECD Countries. Education Economics, 20(1), pp.53-68.
Ercan, N. Y. (2000). İçsel Büyüme Teorisi: Genel Bir Bakış. Planlama Dergisi Özel Sayı-DPT’nin Kuruluşunun
42. Yılı.
European Commission. (2013). Research and Innovation Performance in Turkey. (Online) http://www.abmerkezi-arastirma.itu.edu.tr, Date of Access: 25.10.2016
Falk, M. (2007). R&D Spending in The High-Tech Sector and Economic Growth. Research in Economics, 61, pp 140-147.
Goel, R. K., James E.P. and Rati, P. (2008). R&D Expenditures and U.S. Economic Growth: A Disaggreted Approach. Journal of Policy Modeling, Vol. 30, Issue.2, pp 237-250.
Griliches, Z. (1998). R&D and Productivity: The Econometric Evidence. National Bureau of Economic Research, (Online), http://www.nber.org\books\gril198-1, Date of Access: 10.09.2016, pp.251-268.
Güzel, S. (2009). Ar‐Ge Harcamaları ve Vergi Teşvikleri: Belirli Ülkeler Karşısında Türkiye’nin Durumu.
Eskişehir Osmangazi Üniversitesi İİBF Dergisi, 4(2), ss 29‐48.
Hall, B. H. & J. Lerner. (2009). The Financing of R&D and Innovation. Handbook of The Economics of Innovation, Elsevier-North Holland, (Online), http://eml.berkeley.edu, Date of Access:12.08.2016
Horvath, R. (2011). Research & Development and Growth: A Bayesian Model Averaging Analysis. Economic Modelling, 28, pp 2669-2673.
İstka (2012). Türkiye ve İstanbul Bölgesinde Ar-Ge ve Yenilik. (Çevrimiçi), http://www.istka.org.tr/content/pdf/AA-turkiye-ve-istanbul-bolgesinde-arge-ve-yenilik.pdf, Erişim Tarihi: 12.08.2016,
İncekara, A., Selim D. & Mehmet A. (2014). Ar-Ge Harcamalarına Yapılan Teşviklerin Etkinliği: Türkiye BRICS
Ülkeleri Karşılaştırmalı Analiz.Journal of Economıc PolicyResearches, Cilt:1, Sayı: 2, ss 1-30.
Jones, C. I. (1995). R&D Based Models of Economic Growth. The Journal of Political Economy, Vol. 103, Issue. 4, pp. 759-784.
Korkmaz, S. (2010). Türkiye’de Ar-Ge Yatırımları ve Ekonomik Büyüme Arasındaki İlişkinin VAR Modeli İle Analizi. Journal of Yasar Universty, 20(5), ss 3320-3330.
Lichtenberg, F. R. (1992). R&D Investment and International Productivity Differences. NBER Working Paper Series, Vol. W4161, pp 1-37.
Luh, Y. H. & Chang, S. K. (1997). Building The Dynamic Linkages Between R&D and Productivity Growth. Journal of Asian Economics, 8(4), pp 525-545.
Mıke, F. & Oransay, G. (2015). Altyapı veİnovasyon Değişimlerinin Doğrudan Yabancı Yatırımlar Üzerine
73
OECD (2004). Frascati Manual; The Measurement of Scientific and Technological Activities, Prpposed Standard Practice for Surveys on Research and Experimental Development. 6th Edition, (Online), http://www.oecd.org\sciencelinnal, Date of Access:10.05.2016
OECD (2005). Oslo Manual, The Measurement of Scientific and Technological Activities. (Online), http://www.oecd.org, Date of Access:10.05.2016
OECD (2013). OECD Factbook 2013. (Online), http://dx.doi.org\10.1787\factbook-2013-en. Date of Access: 15.07.2016
OECD (2015). Frascati Manual; The Measurement of Scientific, Technological and Innovation Activities,
Guidelines for Collecting and Reporting Data on Research and Experimental Development”, 7th Edition, (Online), http://www.oecd.org\sti\inno\Frascati-Manual-2015-Flyer-EN.pdf, Date of Access:12.08.2016.
Öz, S. (2011). Sürdürülebilir Büyümenin Kaynağı: Teknolojik Gelişme, Politika notu 11-04. Ekonomik Araştırma Formu, Nisan, (Çevrimiçi), http://www.eaf.ku.edu.tr, Erişim Tarihi: 15.10.2016.
Park, W., G. (1995). International R&D Spillovers and OECD Economic Growth. Economic Inquir, Vol. 33, No, 4, pp. 571-591.
Rosenberg, N. (2004). Innovatıon and Economic Growth. (Online), http://www.oecd.org\dataoecd\55\49\34267902.pdf, Date of Access: 01.09.2016, (pp 1-2)
Romer, P. M. (1990). Endogenous Technological Change. The Journal of Political Economy. 98(5), pp. 71-102.
Samimi, A. J. & Alerasoul, S. M. (2009). R&D and Economic Growth: New Evidence From Some Developing Countries. Australian Journal of Basic and Applied Sciences, 3(4), ISSN: 1991-8178, pp.3464-3469
Sylwester, K. (2001). R&D and Economic Growth. Journal of Development Economics, Vol. 13, No. 4, pp. 71-84.
Tarı, R. & Alabaş, M. (2017). The Relationship Between R&D Expenditures And Economic Growth: The Case
Of Turkey (1990-2014). Abant İzzet Baysal Üniversitesi, Sosyal Bilimler Enstitüsü Dergisi, Cilt:17,
Yıl:17, Sayı: 2, 17: 1-17, , DOI: http://dx.doi.org/10.11616/AbantSbe.
TÜBİTAK (2011). Ulusal Yenilik Sistemi 2023 Yılı Hedefleri (2011\101). (Çevrimiçi), https://www.tubitak.gov.tr/tubitak_content_files//BTYPD/BTYK/btyk23/BTYK_23_yeni_kararlar_topl
u.pdf, Erişim Tarihi: 14.10.2016.
TÜBİTAK (2016). (Çevrimiçi), https:\\www.tubitak.gov.tr\tr\destekler\sanayi\sanayi-teşvikleri
\icerik-tc-maliye-bakanlığı-ar-ge-indirimi. Erişim Tarihi: 11.08.2016.
Ülger, Ö. & Durgun Ö. (2017). Seçilmiş OECD Ülkelerinde Ar-Ge Harcamalarının Büyüme Üzerine Etkileri.
NiğdeÖmer Halisdemir Üniversitesi İİBF Dergisi, Cilt-Sayı 10(4), ISSN: 2564-6931, Ekim 2017, ss:105-130, DOI:10.25287/ohuiibf.337318, http://dergipark.gov.tr/ohuiibf/.
Ülger, Ö. (2017). OECD Ülkelerinde Ar-Ge Harcamalarının Büyüme Üzerine Etkileri: Panel Veri Analizi (1996-2015). Sosyal Bilimler Dergisi (SOBİDER), Yıl: 4, Sayı: 15, Ekim 2017, ss:183-194, ISSN: 2149-0821, DOİ Number: http://dx.doi.org/10.16990/SOBIDER.3809, http://www.sobider.com/.
Ünal, T. & Nisa S. (2013). Ar-Ge Göstergeleri Açısından Türkiye ve Gelişmiş Ülkelerle Kıyaslaması.İşletme ve
İktisat Çalışmaları Dergisi, Cilt:1, Sayı:1, ss.12-25.
YASED (2013). Uluslararası Yatırımcıların Ar-Ge Yatırımlarını Türkiye’ye Çekmek İçin Gereksinimlerin
Belirlenmesi. (Çevrimiçi), http://www.yased.org.tr, Date of Access:12.08.2016.
74 Zerenler, M. Türker, N. & Şahin, E. (2007). Küresel Teknoloji, Araştırma-Geliştirme ve Yenilik İlişkisi. Selçuk
Üniversitesi Sosyal Bilimler Enstitüsü Dergisi, 17, ss 653-668.