Munich Personal RePEc Archive
Requiem for the Interest-Rate Controls
in China
Sun, Rongrong
School of Economics, Henan University
June 2018
Online at
https://mpra.ub.uni-muenchen.de/87700/
1
Requiem for the Interest-Rate Controls in China
Rongrong Sun1
Abstract: This paper reviews the retail interest-rate-control deregulation in China over the 1993-2015 period and provides a preliminary assessment of the PBC’s replacement monetary framework. I show that the interest-rate controls triggered the development of deposit substitutes that banks used to circumvent the restrictions, which in turn drove deposits out of commercial banks. This gave rise to concerns about deterioration of bank profits and build-up of financial frangibility, which have pushed up
the PBC’s deregulation acceleration over the post-2012 period. I quantify the distortionary effects of these controls: disintermediation, a rising shadow banking system and financial repression. Despite the official lift-off of the controls, the retail interest rates are still subject to the PBC’s window guidance and other pricing mechanism guidance. The interest-rate corridor does not function well in confining money market rates. This suggests that the PBC adopt a target money market rate system.
Key words: interest-rate control, deregulation, China, financial repression, interest-rate corridor
JEL-Classification: E52, E58
1 School of Economics, Henan University, Rongrong.Sun@cfds.henuecon.education. I thank seminar participants at many
2
1. Introduction
October 24th 2015 marked the official phase-out of the direct control on retail interest rates in China, with the lift-off of the interest-rate ceiling on deposits. This control could trace back to the planned-economy era. It limited the interest rate that banks could pay on their deposits as well as the interest rate that banks could charge on their loans. That is, banks set their deposit- and lending-rate according to the benchmark rates specified by the central bank (the People’s Bank of China, hereafter the PBC), subject to the limited adjustment bands. The deregulation started in 1993, featured with three periods. In the first period, 1993 through 2004, the PBC relaxed the lending-rate ceiling in several steps, with it finally abolished in October 2004 together with the deposit-rate floor. Between 2005 and 2011, no further deregulation actions took place. The last period, 2012 through 2015, saw deregulation acceleration, with intensive actions sequenced. In 2013, the lending rate was freed from the floor control. Then in 2015, the final control, i.e., the ceiling on the deposit rate, was abolished.
There is rich literature studying deposit-rate ceilings in the U.S., which is known as Regulation Q and was in effect from 1933 to 1986. For example, Gilbert (1986) overviews this history, documenting the legislative objectives of this regulation and its effect on financial system. More studies focus on the impact of Regulation Q on transmission mechanisms as well as the possible changes in transmission mechanisms over time when encountering the abolishment of Regulation Q (see, among others, Boivin,
Kiley, and Mishkin 2010; Koch 2015). By contrast, there has been so far no study that formally documents this history in China. Only a few works study the link between the regulated retail rate and market interest rates (see, e.g., Chen, Chen, and Gerlach 2013; Fan and Johansson 2010; He and Wang 2012; Ma and Wang 2014).
The purpose of this paper is to fill this gap by providing a review of the retail interest-rate-control deregulation over the 1993-2015 period as well as some thoughts on the new replacement monetary policy framework. I examine objectives of these controls and their distortionary effects on the economy. Then, this paper ends with a preliminary assessment of the replacement policy framework that is under construction, the interest-rate corridor system, and its role in guiding market interest rates.
interest-3
rate corridor system does not function well in effectively confining money market interest rates to the
corridor. It suggests that the PBC adopt a target money market rate system rather than a system of both a target interest rate and the interest-rate corridor.
The paper is organized as follows. Section 2 reviews the deregulation of interest-rate controls since 1993. Section 3 introduces a supply-demand framework to assess whether these controls fulfil its objectives. Section 4 examines and quantifies the distortionary effects of these controls. Section 5 presents the conclusion and a preliminary assessment of the interest-rate corridor system.
2. Gradualist deregulation of interest-rate controls
The current monetary policy in China is featured with a multiple-instrument and multiple-objective operating regime, with growth rates of M2 and the new total bank lending as its intermediate targets (see, e.g., Bell and Feng 2013; Klingelhöfer and Sun 2017, 2018; Sun 2015, forthcoming; Zhang and Ji 2012).2 The PBC’s policy objectives are threefold: price stability, economic growth, and financial stability, with the former two defined in Article 3 of the People’s Bank of China Act (amended in 2003) and the last defined in Article 2.3 To achieve various policy objectives, the PBC uses a mix of quantity- and price-based monetary and credit policy instruments, together with administrative tools. They include, for example, the open market operations, central bank lending, the interest rate, the required reserve ratio
and window guidance.4
Direct controls on retail interest rates can be traced back to the planned economy era, when economic activities were centrally planned with various quantities and prices set by central planners, rather than market determined. The economic reforms started in 1978 and gradually, the Chinese economy has been in transition to a market economy. The central bank reform followed in 1984, separating regular commercial banking activities from the PBC and passing them to commercial banks. But until the mid-1990s, the PBC was still responsible for setting all kinds of interest rates and asset prices (China
Monetary Policy Report 2003-1: 6). The market-based interest-rate reform has been evidenced, first, in
the liberalization of China interbank money market rate (CHIBOR) and bond market rate (including the repo rate) in 1996 and 1997, as listed in Table 1, when these two markets started to operate. Ever since, these interest rates are market-determined, with market participants restricted to institutions (e.g., banks, other financial institutions, but not individual investors). This system with the coexistence of regulated bank retail rates with market-determined money and bond rates is described as a dual-track interest-rate system in the literature (see, among others, Chen, Chen, and Gerlach 2013; El-Shagi and Jiang 2017; He
2In 2012, the PBC started to frame its intermediate targets as “money supply and new lending, (…) complemented by
analysis of aggregate social financing” in the 12th Five-Year Plan for Financial Sector Development and Reform (China
Monetary Policy Report 2012-3: 18).
3It is “to maintain the stability of the value of the currency and thereby promote economic growth” (Article 3) and to “guard
4
and Wang 2012; Yi 2015). “Partial liberalization creates a dual-track price system and distorts the
market. The price within the controlled track is usually lower and that outside the track is higher,” as YI Gang (2015) puts it.5 The market segmentation ensures the coexistence of two tracks and two prices.
Table 1. Liberalization of the money and the bond market
Source: China Monetary Policy Report (2002Q4).
In addition to these two principal movements as listed in Table 1, the reforms of the money and the bond market have been evidenced with the introduction of new financial products over time. For example, the
(transfer) discount rate started to be determined by banks with the reference to the PBC’s rediscount rate in 1998; the Shanghai Interbank Offered Rate (SHIBOR) was introduced as a prime interest rate in the money market in January 2007; interbank deposits were introduced in December 2013; the certificate of deposit (CD) was introduced in June 2015 (China Monetary Policy Report 2002Q4 and 2003Q4; China
Financial Stability Report 2016).
The reform on two most important retail interest rates, the interest rates on bank loans and deposits, lagged behind. The PBC used to set the benchmark deposit rates and lending rates (of various maturities) for banks to follow. The regulation on retail interest rates are clearly stated in The Provisional
Regulations of the People’s Republic of China on the Control of Banks (promulgated by the State Council on 7 January 1986) and the later 1995 Law on Commercial Banks (amended twice, 2003 and
2015). More precisely, Article 31 and 38 of Law require all commercial banks to set their deposit as well as lending interest rates in accordance with the upper and lower limits for the interest rates prescribed by the PBC. Violation of these regulations is subject to fine and punishment (Article 74).
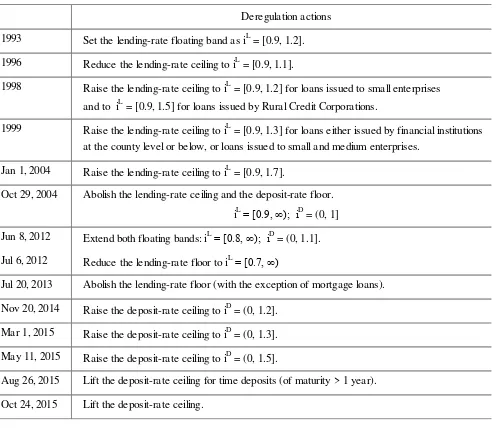
Table 2 lists the key policy actions to deregulate these two interest rates. Only in 1993, banks were allowed to adjust lending rates around the benchmark within a limited band, with the ceiling at 20% above and the floor at 10% below the benchmark rates (see also Ma 2017). The ceiling for lending rates was reduced to 10% above the benchmark rates in 1996. This floating band was widened in 1998-1999
5 Such a dual-track approach to marketization is not rare in China as it has been widely used to tackle the fundamental issues
inherited from the central planning regimes in, inter alia, the price reform and agricultural market liberalization reform (see, e.g., Qian 2017; Song and Xiong 2018). Qian (2017) lists this approach as one of examples of Chinese “transitional
institutions” arrangements that are not “best practice institutions” but “incentive-compatible institutions”. Such transitional
institutions made reforms “efficiency improving and interest compatible” as “reform without losers”, but at the cost of its
unneglectable distortions on the market. With reforms going deeper in the price reform and agricultural market liberalization reform, the state-protected pricing track has been eventually shut down.
On 3 Jan, The interbank borrowing market started to operate.
On 1 Jun, the interbank money market rate (CHIBOR) was liberalised and market-determined. Jun 1997 The interbank bond market started to operate.
5
and 2004. Meanwhile, the deposit rate was under strict regulation. In October 2004, the PBC abolished
[image:6.595.49.547.216.644.2]the lending-rate ceiling and the deposit-rate floor. Following a long quite period, deregulation retook off in 2012, when the floating bands for both the lending rate and the deposit rate were extended. Since then, deregulation had been accelerating. In July 2013, the lending-rate floor was abolished. In November 2014 and March 2015, the deposit-rate upper band was extended to 1.2 and 1.3 above the benchmark, which was abolished on October 24th 2015.
Table 2. Deregulation of retail interest-rate controls over time (1993-2015)
Note: 𝑖𝐿 denotes the lending rate and 𝑖𝐷 stands for the deposit rate. The floating band, for example, 𝑖𝐿 = [0.9, 1.2] in 1993, means that banks were allowed to adjust lending rates around the benchmark, with the ceiling at 20% above and the floor at 10% below the benchmark.
Source: Author’s summary based on China Monetary Policy Report (2002Q4: 5;2003Q1: 6; 2003Q4: 6) and China Financial Stability Report (2016: 133-136).
Besides the legacy of economic planning, one consideration that has guided the PBC to retain the interest rate controls after the 1984 central bank reforms is that low interest rates are necessary to stimulate investment, while high interest rates are not as necessary to mobilize savings given that
Deregulation actions
1993 Set the lending-rate floating band as iL = [0.9, 1.2].
1996 Reduce the lending-rate ceiling to iL = [0.9, 1.1].
1998 Raise the lending-rate ceiling to iL = [0.9, 1.2] for loans issued to small enterprises and to iL = [0.9, 1.5] for loans issued by Rural Credit Corporations.
1999 Raise the lending-rate ceiling to iL = [0.9, 1.3] for loans either issued by financial institutions at the county level or below, or loans issued to small and medium enterprises.
Jan 1, 2004 Raise the lending-rate ceiling to iL = [0.9, 1.7].
Oct 29, 2004 Abolish the lending-rate ceiling and the deposit-rate floor. iL = [0.9, ∞); iD = (0, 1]
Jun 8, 2012 Extend both floating bands: iL = [0.8, ∞); iD = (0, 1.1].
Jul 6, 2012 Reduce the lending-rate floor to iL = [0.7, ∞)
Jul 20, 2013 Abolish the lending-rate floor (with the exception of mortgage loans).
Nov 20, 2014 Raise the deposit-rate ceiling to iD = (0, 1.2].
Mar 1, 2015 Raise the deposit-rate ceiling to iD = (0, 1.3].
May 11, 2015 Raise the deposit-rate ceiling to iD = (0, 1.5].
Aug 26, 2015 Lift the deposit-rate ceiling for time deposits (of maturity > 1 year).
6
Chinese households do not have many other alternative investment choices. As Song and Xiong (2018:
5-7) argue, “the Chinese government developed the financial system with a mission to finance China’s economic reform” and “the financial system served mainly to support the inefficient state sector rather than funding the booming private sector.”
The third possible explanation for the interest-rate controls is that the central bank uses these controls in attempt to ensure banks’ profits by limiting the competition among banks for deposits. This view is widely used to explain Regulation Q in the U.S. It was believed that “competition for deposits not only reduced bank profits by raising interest expenses, but also might cause banks to acquire riskier assets
with higher expected returns in attempts to limit the erosion of their profits” (Gilbert 1986: 23). Analogously, this argument applies to controls on bank loan rates as competition tends to reduce interest rates charged on loans and erodes bank profits. Again, to offset the shrinkage of bank profits, banks might take some extra risks somewhere else. Indeed, studies on the competition and stability nexus show that there is a trade-off: An intensification of competition reduces bank profits, encouraging banks to take more risks (see, e.g., Hellmann, Murdock, and Stiglitz 2000; Jiang, Levine, and Lin 2017; Keeley 1990).
It is plausible that out of financial stability considerations, the PBC guarantees banks’ profits through the
regulations on retail interest rates and leaving a fixed interest-rate spread. Also, one of Chinese
characteristics is that banks in China, especially big state-owned banks, are required to issue loans in support of the government industry development plan. They are not free to decide all their investment projects. In return, the government uses other distortions, for example, the interest-rate controls, to
guarantee banks’ profits (see, e.g., Lardy 2008; Song and Xiong 2018).
In summary, interest-rate controls in China were inherited from the planned economy, but were retained in the 1984-2015 period to keep the capital cost low to stimulate investment. The third consideration for these controls is that the PBC tried to limit competition for deposits / loans to ensure banks’ profits and safeguard financial stability.
The next question is whether these interest-rate controls were binding. A binding lending-rate floor refers to the case when the regulated floor is above the market equilibrium rate, while a binding deposit-rate ceiling refers to the one that the ceiling is below the market equilibrium deposit-rate. Only binding regulated prices would bring about distortions. This question is explored in two ways.
7
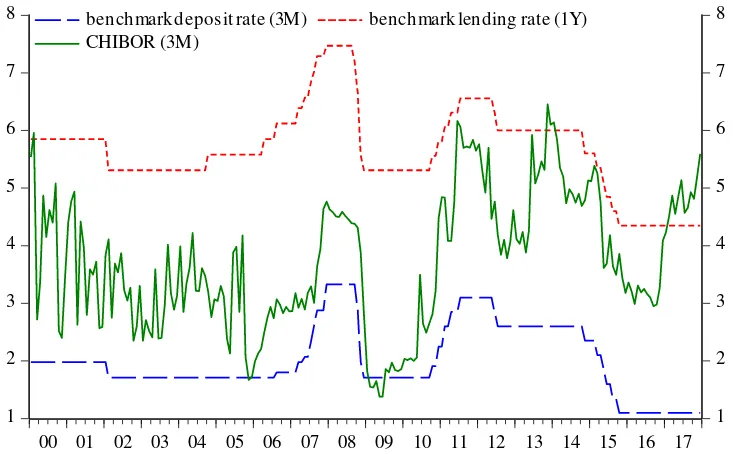
do not have access to the interbank money market), it is somehow not surprising to observe persistent
divergence of these two interest rates. On the other hand, Chinese savers would have earned higher returns on deposits if the deposit rate were market determined. It is the ceiling regulation that has kept the deposit rate low, suggesting for a binding deposit-rate ceiling over time.
[image:8.595.81.449.302.529.2]Another regulated interest rate, the benchmark lending rate, remained above the CHIBOR in the pre-2017 period (with the exception of three months around the 2013-2014 turning point). Then in pre-2017 after an upswing of the money market rate, the lending rate turned out lower than the CHIBOR, indicating relatively cheap bank lending over the year. Yet, this comparison is not sufficient to conclude whether the lending rate floor was binding as the money market was not strictly comparable to the bank lending.
Figure 1. Two regulated retail interest rates and the money market rate, 2000-2017
1 2 3 4 5 6 7 8
1 2 3 4 5 6 7 8
00 01 02 03 04 05 06 07 08 09 10 11 12 13 14 15 16 17
benchmark deposit rate (3M) benchmark lending rate (1Y) CHIBOR (3M)
Notes: The benchmark deposit rate and the CHIBOR are of 3-month maturity, while the benchmark lending rate is of 1-year maturity. Source: The PBC and China Foreign Exchange Trading System.
8
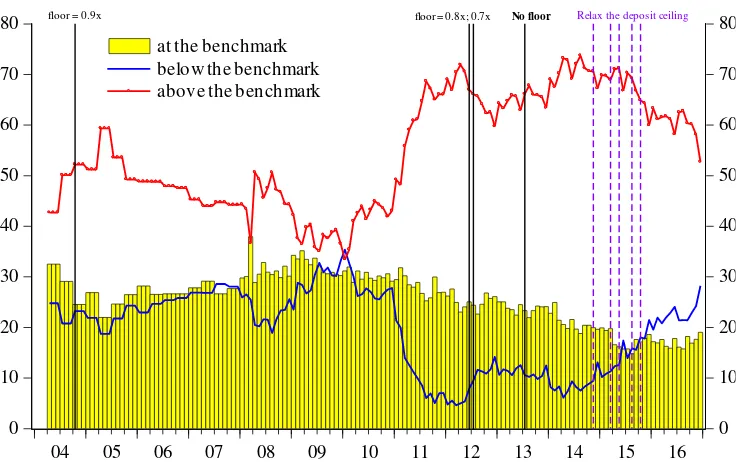
below the benchmark accounted for the smallest share, with a sample mean of 19.5%. At the lowest, this
[image:9.595.76.447.195.426.2]share was around 5% in early 2012 and remained below 10% in 2014. Yet, during the period of 2004-2010, about 25-30% of the total bank loans was issued at the floor lending rate (i.e., 90% of the benchmark). The existence of this share throughout the whole sample period suggests that to some extent, the lending-rate floor was binding (see also Xu, van Rixtel, and van Leuvensteijn 2016).
Figure 2. Shares of the total loans issued at /below /above the benchmark, 2004-2016
0 10 20 30 40 50 60 70 80
0 10 20 30 40 50 60 70 80
04 05 06 07 08 09 10 11 12 13 14 15 16
at the benchmark below the benchmark above the benchmark
Relax the deposit ceiling
No floor
floor = 0.8x; 0.7x floor = 0.9x
Notes: The vertical lines mark the dates when the actions were taken to deregulate the lending rate (with solid black lines) and the deposit rate (with violet dashed lines).
Source: Author’s compilation from various issues of China Monetary Policy Report.
The figure marks the dates when the actions were taken to deregulate the lending rate (with vertical black solid lines) and the deposit rate (with vertical violet dashed lines). There seems to be no pattern suggesting any structural break associated with these vertical lines. Rather, a rising share of the loans issued above the benchmark seems to be more likely at times when the economy shows high uncertainty, for example, in 2012 and 2014. Plausibly, the driving force of the fluctuations of these shares are
economic conditions and banks’ perceptions about the risk, rather than the deregulation timeline.
Neither are the data on the deposit rates publicly available. However, the discussions in the PBC’s China
Monetary Policy Report shed some light on the question whether the deposit-rate ceiling was binding.
For example, it is pointed out that during the period of 2004-2008, “financial institutions often offered
9
(China Monetary Policy Report 2012Q2: 10-11). Similarly, after the adjustment in November 2014 and
March 2015, banks responded but differently (China Monetary Policy Report 2014Q4; 2015Q1). All these suggest that over the early period the deposit-rate ceiling was binding on various banks, while it continued to be binding over the later period, at least to the extent on certain deposit products or on those less competitive small- and medium-sized banks (see also He and Wang 2012; Ma, Yan, and Liu 2013).6
3. Interest-rate controls and bank profits
As mentioned above, the arguments for the interest-rate controls are based on the beliefs that imposing controls could increase bank profits and financial stability. In this part, I show the effects of interest-rate controls on bank profits, as Gilbert (1986) does in assessing the U.S. Regulation Q. Then the Gilbert’s framework is extended to show the effects of the interest-rate ceiling on financial stability, highlighting that the PBC has been forced to speed up the deregulation in 2015 due to the the financial innovations, for example, WMPs and MMFs.
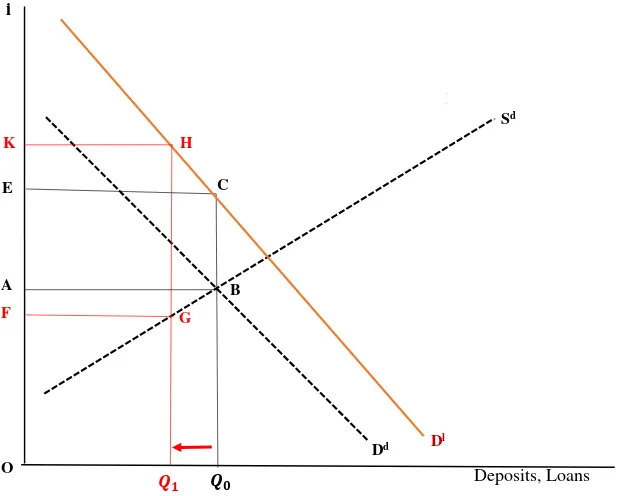
Fig. 3 is adopted from Gilbert (1986), showing the supply and demand for loans and deposits in the
banking system. The total amount of loans available in the banking system (loan supply 𝑆𝑙) is assumed
to equal the amount of deposits at each level of deposits. The solid dark red line, labeled as 𝐷𝑙, is the
investors’ demand curve for loans. The downward-sloping dashed line, labeled as 𝐷𝑑, is the banks’ demand curve for deposits.7 The other dashed line, upward-sloping and labeled as 𝑆𝑑, is the depositors’ supply curve of deposits to banks; it indicates the interest rates that banks must pay to attract various
amounts of deposits.
With no interest rate controls, banks will pay the interest rate OA on deposits and charge OE on loans.
The level of deposits and loans will equal 𝑄0. The profits of the banking system equal ABCE. Suppose the government considers these profits to be too small for a safe and sound banking system and sets a ceiling interest rate on the deposits of OF that is binding, below the rate OA that banks would pay with
no ceiling rate in effect. With that ceiling rate, the quantity of deposits that banks can attract falls to 𝑄1. With a lower quantity level of deposits available to lend, the interest rate on loans rises to OK. So does the interest rate differential that banks earn from issuing loans rise to EF. The profits of the banking system shift from ABCE to FGHK.
The impact of imposing the ceiling deposit interest rate on bank profit is ambiguous as this control has both quantity (smaller) and price (larger) effects. The difference between profits with the ceiling rate in
6 Overall, the weighted average deposit rate of the whole banking system is within the upper limit. For example, it was 1.17
times of the benchmark (with the upper bound of 1.2 times) by the end of 2014 (China Monetary Policy Report 2014Q4:16); it remained below the upper limit of 1.3 times the benchmark in March 2015 (China Monetary Policy Report 2015Q1:24). The PBC interprets the divergent responses of banks to the adjustments of the benchmark deposit rate as the increase of the pricing capabilities (China Monetary Policy Report 2014Q4; 2015Q1).
10
effect (FGHK) and profits with no ceiling rate (ABCE) depends on the shapes of the demand curve for
loans (𝐷𝑙) and the supply curve of deposits (𝑆𝑑). With the slopes of these two curves sufficiently steep,
the banking system’s profits would be higher with a binding ceiling rate on deposits in effect. This might be the case in China in the 1990s and 2000s when both the investors’ demand for loans and the
[image:11.595.95.410.245.493.2]depositors’ supply of deposits were less elastic with respect to the interest rate: Chinese investors and depositors did not have many other alternatives rather than bank loans for financing their projects and bank deposits for investing their savings.
Figure 3. Effects of a binding deposit interest-rate ceiling
O
i
Deposits, Loans
LM
B
A
C E
G F
K H
Dd Dl
Sd
Source: Adopted from Gilbert (1986: 23).
The same figure can be used to analyze the effects of a binding floor on the lending interest rate that are indeed parallel to those of a binding deposit interest-rate ceiling. Focus on Fig. 3. The profits of the banking system without interest-rate controls are shown in area ABCE. Now, suppose the government sets a floor interest rate on the loans (OK) that is above the lending interest rate (OE) at which banks would be willing to make loans with no floor rate in effect. With this floor rate, the quantity of loans demanded in this economy is 𝑄1. With this lower level of loans demanded, the interest rate that banks
11
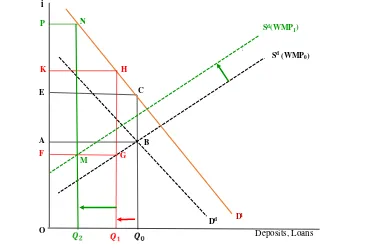
labelled 𝑆𝑑(WMP). WMPs yield a higher return than the deposit interest rate and are regarded as close
substitutes to bank deposits. WMPs have grown fast (it will be elaborated in the ensuring Section), for example, from WMP0 to WMP1. Some, but not all, depositors will shift a part of their savings from
deposits to WMPs. This is reflected in Fig. 4 where the supply curve of deposits shifts from 𝑆𝑑(WMP0)
to the left to 𝑆𝑑(WMP1). With less supply of deposits, the quantity of deposits that banks can attract at
[image:12.595.68.457.249.500.2]the ceiling rate level of OF falls even further to 𝑄2. At this lower quantity level of deposits to lend, the interest rate on loans rises to OP. The bank profits are measured with the area of FMNP.
Figure 4. Effects of a binding deposit interest-rate ceiling, with WMPs incorporated in Sd
O
i
Deposits, Loans
LM
B A
C E
G F
K H
Dd Dl
M N P
Sd(WMP 0)
Sd(WMP 1)
Source: Modified from Gilbert (1986: 27).
Compared to the bank profits obtained in two other scenarios (the case with no ceiling rate, measured with ABCE, and the case with the ceiling rate, measured with FGHK), it is very likely that the decline of deposits supply as a result of fast developments of substitutes for bank deposits (in form of WMPs and MMFs that offer higher interest rates) will lead to shrinkage in bank profits, as measured with FMNP. Following the theoretic analysis, this section presents an estimate of bank profits. Chinese banks function as traditional financial intermediaries, taking deposits and making loans (see, e.g., Klingelhöfer and Sun 2017). The profit of the banking sector, Π𝑡, arisen from the loan-deposit interest spreads, can be
roughly estimated as follows:
Π𝑡= 𝑖𝑡1𝑌𝐿𝐿𝑡+ 𝑖𝑡𝑅𝑅𝑅𝑅𝑅𝑡𝐷𝑡− (13 𝑖𝑡𝐷𝐷 +23 𝑖𝑡1𝑌𝐷)𝐷𝑡
12
deposits, respectively; while 𝑖𝑡𝑅𝑅 stands for the interest rate paid on the required reserves. Bank deposits
are composed of demand deposits (around 1/3, an average share over the period) and time deposits (around 2/3)8. For simplicity, this calculation does not further explore the term structures of bank loans or time deposits. Rather, the one-year interest rates on loans and time deposits are used to proxy the average of them at various terms. Neither has this calculation taken the cost into consideration.9
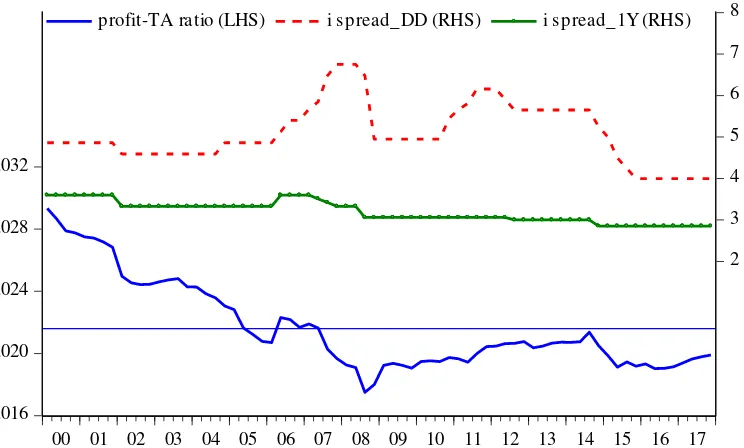
[image:13.595.101.473.385.609.2]Using the aggregate balance sheet of financial institutions from the PBC, I quantify the bank profits on a quarterly basis over the 2000-2017 period. Fig. 5 shows these profits, scaled as the profit-to-total-asset ratio. The interest spreads between the benchmark loan rate and two deposit rates are presented in the figure as well. Over the period, the interest spreads were large (with the mean of 5.1% (3.2%) when comparing with the demand deposit rate (the one-year deposit rate)) though they dropped from 6.75% (3.6%) in the early period to 4% (2.85%) in 2017. Not surprisingly, bank profits were substantial, on average about RMB 2.5 trillion and accounting for about 4% of GDP. However, the profit that each unit of total asset (TA) creates, measured with the profit-to-TA ratio, was continuously declining over time, from about 0.03 to 0.02.
Figure 5. Bank profits and the interest rate spreads, 2000-2017
.016 .020 .024 .028 .032
2 3 4 5 6 7 8
00 01 02 03 04 05 06 07 08 09 10 11 12 13 14 15 16 17
profit-TA ratio (LHS) i spread_DD (RHS) i spread_1Y (RHS)
Source: Author’s calculation with the data from the PBC’s Summary of Sources and Uses of Credit Funds of Financial Institution (2000-2017) and the National Bureau of Statistics.
In short, bank profits in China were guaranteed by interest-rate regulation that imposed a floor for the loan rate and a ceiling for the deposit rate, which left a spread around 3-5 percentage points (see, e.g.,
8 The average shares are obtained, using the PBC’s Summary of Sources and Uses of Credit Funds of Financial Institution (2007-2017), where the decomposition of bank deposits into demand and time deposits is reported only since 2007. It is assumed that these shares are not substantially different in the 2000-2006 period.
9 The fixed cost or the cost that is proportionate to the size of the balance sheet will downgrade the size of the profit, but will
13
Song and Xiong 2018). Nevertheless, the simple calculation above indicates that the unit profit was
shrinking. This is inconsistent with the PBC’s intention of retaining interest-rate controls to guarantee bank profits, but consistent with what the simple supply-demand framework in Fig. 4 where the substitutes of bank deposits are incorporated predicts. Of course, one explanation for the declining unit profit was that the loan-deposit interest spread was narrowed over time, as shown in Fig. 5. Another possible explanation might be that the deposits that banks have attracted decreased, as predicted in Fig. 4. Indeed, the share of bank deposits in the balance sheet dropped from 0.93 in 2000 to 0.85 in 2017. This implies a rising funding cost facing banks, given that deposits at lower-than-market regulated rates were a cheap funding source.
4. Distortionary effects of interest-rate controls
Disintermediation and a rising shadow banking system: As Fig. 1 shows, the deposit rate has been lying
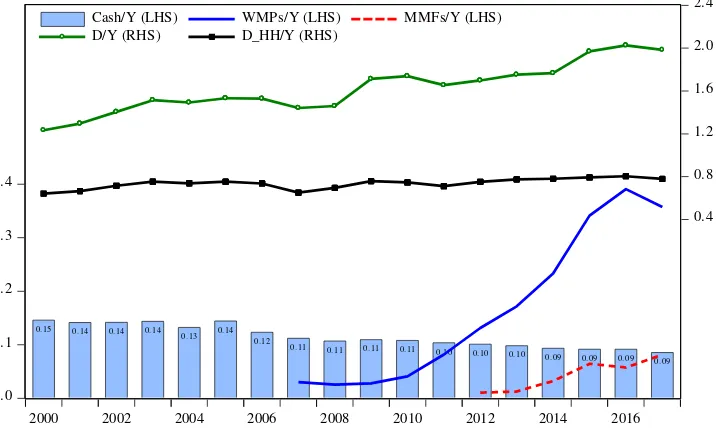
constantly below the market interest rate of the same maturity over time, indicating that bank deposits earn lower-than-market returns. One of possible consequences of the binding deposit-rate ceiling is that it might drive deposits out of the regulated commercial banks and into close substitutes like WMPs and MMFs. This process of the loss of deposits from the banking system is so-called disintermediation. To explore this disintermediation process over time, I compare the evolutions of financial products,
including cash, bank deposits, WMPs and MMFs, and present them in Fig. 6, all scaled by nominal GDP. The competition for funding among banks led to the rise of WMPs around 2007, which are saving instruments, offering fixed rates of return but above the deposit rate ceiling. They are typically actively
managed by banks, with other firms commonly used as ‘channels’, but few are recorded on banks’
balance sheets. This led to rich shadow banking activities (see, e.g., Hachem and Song 2016; Perry and Weltewitz 2015; Song and Xiong 2018). The blue solid line in Fig. 6 plots the outstanding value of WMPs issued by the banking sector as percentage of GDP. It increased from 1.1% in 2007 to the peak of 39% in 2016, though this strong growth slowed down in 2017 with the share dropping to 36%.
Also in China, MMFs have seen fast developments since 2013. For example, Yu’e Bao was established as online platform for deposit accounts in June 2013 by Alibaba. It corporates with Tian Hong, a money market fund (MMF), and sell the MMF products to retail investors at a time-varying interest rate
14
the household sector to GDP, presented in the black squared line in the figure, did not rise at any similar
[image:15.595.96.454.137.351.2]fast speed. Rather, the rise of this ratio was modest, from 0.65 to 0.78.
Figure 6. Financial products: cash, bank deposits, WMPs and MMPs, 2000-2017
.0 .1 .2 .3 .4
0.4 0.8 1.2 1.6 2.0 2.4
2000 2002 2004 2006 2008 2010 2012 2014 2016
0. 15 0. 14 0. 14 0. 14
0. 13 0. 14 0. 12
0. 11 0. 11 0. 11 0. 11 0. 10 0. 10 0. 10 0. 09 0. 09 0. 09 0. 09
Cash/Y (LHS) WMPs/Y (LHS) MMFs/Y (LHS)
D/Y (RHS) D_HH/Y (RHS)
Note: This figure shows the shares of cash, the outstanding value of wealth management products of the banking sector, the outstanding value of money market funds, deposits as well as the deposits of the household sector with respect to nominal GDP over the time.
Source: Author’s calculation. The nominal GDP data are from the NBS; the data on cash and deposits are collected from the PBC’s
Summary of Sources and Uses of Credit Funds of Financial Institution (2000-2017); the data on the outstanding value of WMPs of the banking sector are collected from China Banking Regulatory Commission Annual Reports (2007-2012) and China Assets Management Products Market Report of the Banking Sector (2013-2017); the data on the outstanding value of MMFs are collected from monthly statistic tables (2012-2017) of funds management companies of the Asset Management Association of China (AMAC).
Indeed, a closer look at the allocation of the household financial assets over the 2004-2014 period, where the data are available, shown in Fig. 7, indicates that the share of the bank deposits dropped from 0.72 in 2004 to below 0.5 in 2014. In 2010, the household sector started to hold more WMPs and other investment vehicles, which were not specified in the data. The share of cash in the financial assets shrank over time, in both Fig. 6 and 7.
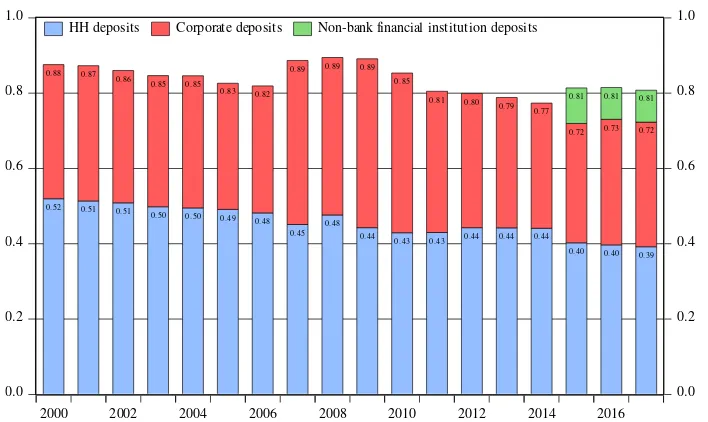
Apparently, some other sectors must have contributed to the large increase in bank deposits. Fig. 8 shows the decomposition of the total bank deposits over the 2000-2017 period. Indeed, the share of deposits by the household sector dropped from 0.52 to 0.39. Yet, corporate deposits have increased along with the total bank deposits such that its share remained around 0.33-0.35; and over the 2007-2010 period, corporate deposits grew at an even higher rate such that its share reached to about 0.42-0.45. Two possible sources might account for this increase. First, a part of raised funds from issuing WMPs were held as deposits by the companies that got these funds. For example, this share was about 21% by
the end of 2012 (China Banking Regulatory Commission Annual Report 2012: 37). Second, it is due to the increased bank deposits from money market fund management companies. Indeed, many of these companies held a large share of their raised funds in bank deposits. For example, according to Annual
15
respectively. Overall, the deposits from the non-banking financial institutions accounted for about
[image:16.595.64.419.150.373.2]8.5%-9.5% of the total deposits in the recent three years when the PBC started to publish the data, as shown in the figure.
Figure 7. Allocation of the household financial assets, 2004-2014
Source: Author’s calculation based on the data from Table 8-1 in Li, Zhang, and Chang (2015: 97-98).
Figure 8. Composition of the total bank deposits, 2000-2017
0.0 0.2 0.4 0.6 0.8 1.0 0.0 0.2 0.4 0.6 0.8 1.0
2000 2002 2004 2006 2008 2010 2012 2014 2016
0. 52 0. 88 0. 51 0. 87 0. 51 0. 86 0. 50 0. 85 0. 50 0. 85 0. 49 0. 83 0. 48 0. 82 0. 45 0. 89 0. 48 0. 89 0. 44 0. 89 0. 43 0. 85 0. 43 0. 81 0. 44 0. 80 0. 44 0. 79 0. 44 0. 77 0. 40 0. 72 0. 81 0. 40 0. 73 0. 81 0. 39 0. 72 0. 81
HH deposits Corporate deposits Non-bank financial institution deposits
Source: Author’s calculation using the data from the PBC’s Summary of Sources and Uses of Credit Funds of Financial Institution
(2000-2017).
A part of deposits that are attracted away from the household sector flow back to the banks’ balance
sheet as the deposits from other sectors, which partially neutralizes the disintermediation effects of WMPs and MMFs. However, these processes do have scattered quite amount of bank deposits out into the world of shadow banking. The rising shadow banking imposes a high risk on financial stability, as
pointed out by the PBC’s new Governor, YI Gang, in his 2018 April interview with Caixin (Caixin
0.0 0.2 0.4 0.6 0.8 1.0
2004 2005 2006 2007 2008 2009 2010 2011 2012 2013 2014
cash share deposits share equity share WMPs share
0.10 0.10 0.09 0.08 0.08 0.08 0.08 0.07 0.06 0.06 0.06 0.72 0.72 0.68 0.54 0.67 0.65 0.64 0.63 0.55 0.52 0.49 0.08 0.07 0.10 0.17
[image:16.595.75.429.424.635.2]16
2018). For example, one concern with the WMPs is implicit repayment guarantee, known also as rigid
repayment, as pointed out in the newly issued “Guidelines on Standardizing Asset Management
Businesses of Financial Institutions” (issued on April 27 2018). That is, there has been no default case
and banks pay the promised returns even in case of an investment loss of some WMP projects, but with the funds raised from other sources. The increased indebtedness will encourage banks to take more risks. At the aggregate level, this raising funds from other sources will result in higher interconnectedness of financial institutions, which will threaten the stability of the whole financial system.10
Meanwhile, the change in the deposit composition implies shrinking bank profits, which might encourage banks to take more risks and result in building-up of financial instability. Indeed, large institution depositors, such as Yu’e Bao, are able to negotiate the deposit at a higher rate, very likely close to the ceiling, compared to those small household depositors. This leads to a rise of the costs for banks and further erodes the bank profits. It is very likely that the bank profits, calculated in Section 3, can be even smaller in the post-2007 or post-2013 period. To the real economy, the prolonged funds chain will also lead to an increase in the capital cost, as YI Gang pointed out (Caixin 2018).
Financial repression in China: Financial repression, defined as the low and even negative real return on
deposits, is most clearly evident in China from the point of view of households (Lardy 2008). The real return on deposits is measured as the difference between the nominal interest rate that households
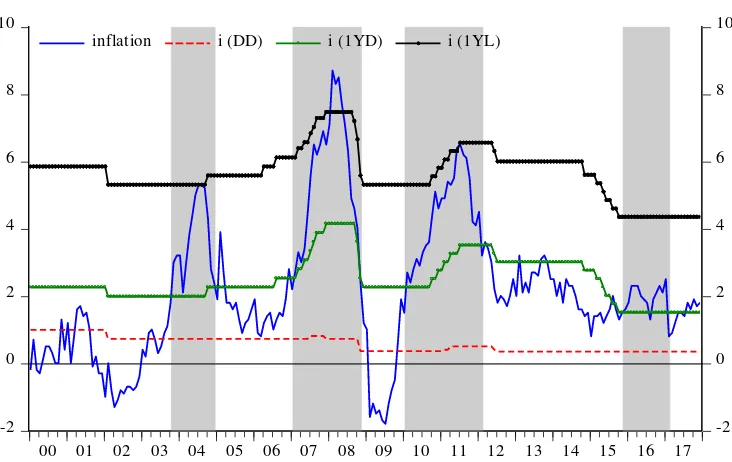
receive on deposits and the rate of consumer price inflation. Fig. 9 presents the annualized rate of consumer price inflation11 on the monthly basis over the 2000-2017 period, together with two benchmark deposit rates and the benchmark one-year loan rate. Chinese households have received positive real return on savings deposits till the mid-2003 when inflation remained moderate or even negative. Since then, inflation has risen but the rise of deposit rates has been modest, which let to negative real returns on deposits. The interest rate on demand deposits has been lying below inflation since mid-2003, except the 2009 deflation period. Meanwhile, the real interest returns on the short- and medium-term savings deposits (from example, from 3 months to 3 years) were negative for about half of the time since mid-2003, as highlighted in grey shaded areas in Fig. 9 where the referred 1-year benchmark deposit rate was lying below inflation.
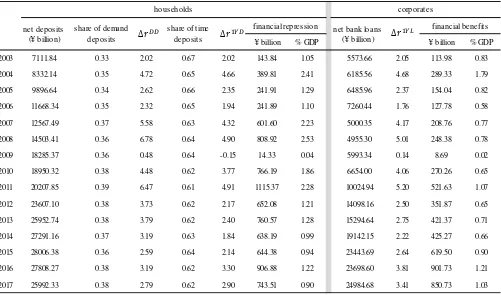
I then follow Lardy (2008)12 to quantify the financial repression facing households by the decline in the real return on savings deposits over the post-2002 period by estimating how much higher household interest income would have been if households had received the same real returns on their net deposits as in 2002. The results of this exercise, on a yearly basis, are reported in Table 3. Chinese households
10 It is worth noting that the overall size of shadow banking remains modest in China and its rapid development started to
slow down in 2016 and 2017 because of various tightening regulations, such as incorporating shadow banking activities into
the PBC’s macroprudential policy framework and imposing required capital on banks for such activities (as specified in the new Guidelines) (see, e.g., Song and Xiong 2018).
11 The year-over-year CPI inflation rate from the NBS is used.
12 This estimate, far from precise but simple, sheds some light on the magnitudes of financial repression/financial benefits in
17
are net savers with the net deposits larger than zero, defined as the difference between household
deposits and bank loans (both as averages throughout the year, using the monthly data from the PBC’s
Summary of Sources and Uses of Credit Funds of Financial Institution). The real return equals to the
[image:18.595.92.458.190.421.2]average of a nominal interest rate over the year minus the CPI inflation rate, which is then compared with the corresponding real return in 2002, denoted as ∆𝑟.
Figure 9. Inflation, the benchmark deposit and lending rates, 2000-2017
-2
0 2 4 6 8 10
-2 0 2 4 6 8 10
00 01 02 03 04 05 06 07 08 09 10 11 12 13 14 15 16 17
inflation i (DD) i (1YD) i (1YL)
Note: The grey shaded areas mark four periods when the interest rate on one-year savings deposits was lying below inflation: 2003M10-2004M12, 2007M01-2008M11, 2010M01-2012M02 and 2015M11-2017M02.
Source: Data from the NBS and the PBC.
The calculated financial repression13 is positive, suggesting for an existence of financial repression throughout the post-2002 period if the real returns in 2002 are taken as the benchmark. In general (except the deflation year 2009), this financial repression was significant, accounting for more than one
percent of China’s GDP. It turned out enormous in the years of negative real rates on short- and medium-term time deposits, amounting to more than two percent of the total GDP, which was, for example, 2.3 % (equivalent RMB 1 trillion) in 2011 and 2.5 % (equivalent RMB 808 billion) in 2008. The next question is who benefited from this large implicit tax on household? Chinese corporations might be the major beneficiary of financial repression given that the real interest rate on loans has fallen with a rising CPI inflation rate since 2002 (except the 2009 deflation year). For example, the 1-year benchmark nominal lending rate, presented in Fig. 9, was not significantly different from inflation around the 2004 and 2011 inflation hikes; also, this lending rate was below inflation over the 2008 high-inflation months. In China, most of bank loans go to corporations: corporate bank loans accounted for
13 Household deposits are composed of demand and time deposits. The term of time deposits runs from three months to five
18
more than 80% in the 2000s; this share started to fall in 2010 and dropped to 69% and 66% in 2016 and
[image:19.595.49.550.174.469.2]2017, respectively. Corporations are net borrowers. The net benefits to corporations are quantified as how much higher corporate interest costs would have been if they had paid the same real lending rates on their net borrowing as in 2002.
Table 3. Household financial repression and corporate financial benefits, 2003-2017
Note: ∆𝑟𝑡𝐷𝐷= 𝑟2002𝐷𝐷 − 𝑟𝑡𝐷𝐷, ∆𝑟𝑡1𝑌𝐷= 𝑟20021𝑌𝐷− 𝑟𝑡1𝑌𝐷, ∆𝑟𝑡1𝑌𝐿= 𝑟20021𝑌𝐿 − 𝑟𝑡1𝑌𝐿, where 𝑡 = 2003, 2004 …, 𝑟2002𝐷𝐷 = 1.54, 𝑟20021𝑌𝐷 = 2.80 and
𝑟20021𝑌𝐿 = 6.16.
Source: Author’s calculation with the data from the NBS and the PBC.
The calculated corporate net benefits over the post-2002 period are listed in Table 3. In most cases, they
accounted for about 0.65% to 1% of China’s GDP. It suggests that about a half of household financial repression went to corporations, with the rest to banks and the government. Repressing the household sector has resulted in a tilted economic growth model with low consumption. After all, this distorted interest rate structure in China is a significant obstacle to China’s sustainable economic growth.
Despite various problems, Chinese financial markets have been maintained stable so far, mainly due to the Chinese government’s guarantee to be the saviour of last resort (see, e.g., Song and Xiong 2018).14 Interest rates on both deposits and bank loans were under strict controls to guarantee low-lending rates to support industry policies as well as guarantee a large interest spread to ensure bank profits. The distortionary effects of these controls are threefold. First, binding interest-rate controls feedbacked as
14 For example, to ensure the functioning of state-owned banks, a large amount of nonperforming loans on their balance sheet
were either written off or moved to asset management companies around 2003-2004.
net deposits net bank loans
(¥ billion) ¥ billion % GDP (¥ billion) ¥ billion % GDP
2003 7111.84 0.33 2.02 0.67 2.02 143.84 1.05 5573.66 2.05 113.98 0.83
2004 8332.14 0.35 4.72 0.65 4.66 389.81 2.41 6185.56 4.68 289.33 1.79
2005 9896.64 0.34 2.62 0.66 2.35 241.91 1.29 6485.96 2.37 154.04 0.82
2006 11668.34 0.35 2.32 0.65 1.94 241.89 1.10 7260.44 1.76 127.78 0.58
2007 12567.49 0.37 5.58 0.63 4.32 601.60 2.23 5000.35 4.17 208.76 0.77
2008 14503.41 0.36 6.78 0.64 4.90 808.92 2.53 4955.30 5.01 248.38 0.78
2009 18285.37 0.36 0.48 0.64 -0.15 14.33 0.04 5993.34 0.14 8.69 0.02
2010 18950.32 0.38 4.48 0.62 3.77 766.19 1.86 6654.00 4.06 270.26 0.65
2011 20207.85 0.39 6.47 0.61 4.91 1115.37 2.28 10024.94 5.20 521.63 1.07
2012 23607.10 0.38 3.73 0.62 2.17 652.08 1.21 14098.16 2.50 351.87 0.65
2013 25952.74 0.38 3.79 0.62 2.40 760.57 1.28 15294.64 2.75 421.37 0.71
2014 27291.16 0.37 3.19 0.63 1.84 638.19 0.99 19142.15 2.22 425.27 0.66
2015 28006.38 0.36 2.59 0.64 2.14 644.38 0.94 23443.69 2.64 619.50 0.90
2016 27808.27 0.38 3.19 0.62 3.30 906.88 1.22 23698.60 3.81 901.73 1.21
2017 25992.33 0.38 2.79 0.62 2.90 743.51 0.90 24984.68 3.41 850.73 1.03
households
financial repression financial benefits
corporates
share of demand deposits
share of time deposits
19
they triggered the development of deposit substitutes that banks use to circumvent the restrictions
imposed by the controls and compete for funding. Second, these substitutes do not show up in bank balance sheet. A rising shadow banking system has brought out a real risk to financial stability. Third, Chinese households are financially repressed, which undermines consumption and dampens the long-run economic growth path.
5. Conclusion and discussion
Though the last control on the interest rate was lifted off in 2015, it is widely believed that the interest rate in China, on both deposits and loans, is not market determined. Rather, they are still subject to the
PBC’s window guidance and other pricing mechanism guidance (see, e.g., Song and Xiong 2018; Chen et al. 2017). For example, upon the abandonment of the deposit ceiling in 2015, the PBC announced that out of the consideration of path dependence, it would continue publishing the benchmark interest rates (both on deposits and loans) over a period of time for banks and the market to refer to (China Monetary
Policy Report 2015Q3: 17; Yi 2015).15 Banks are believed to closely follow them. Meanwhile, a
financial institution self-regulatory pricing mechanism for market interest rates and a loan prime rate (LPR) centralized quote and release mechanism was established in 2013. This mechanism represents an expansion of the Shibor’s role in the credit market (China Monetary Policy Report 2013Q3: 16). Since
then, this loan prime rate16has closely followed the PBC’s published benchmark loan rate.
Then on April 10 2018, the new PBC’s governor, YI Gang, emphasized the importance to further fully marketize the interest rate in China (Yi 2018). He pointed out that the existence of the dual track distorted the market and the best strategy is to merge two tracks (benchmark regulated retail interest rates and money market interest rates). It seems that two and half years after the final lifting off of the interest-rate controls, the PBC has managed to overcome its worries17 and get ready to put aside its parents’ meticulous caring.
International experience has shown that interest-rate liberalization usually progresses in tandem with the gradual transformation of the monetary policy framework. In the 1970s and 1980s, along with the rapid progress in interest-rate liberalization in the major economies, their monetary policy frameworks gradually moved from quantity-based to price-based. The Chinese government has also expressed its resolution in the 12th Five-Year Plan for Financial Sector Development and Reform as well as the 13th
15 Indeed, it kept on publishing the benchmark loan rates after the bank lending-rate floor was abandoned in 2013.
Be noticed that there has been no updating of benchmark rates since October 2015 (till May 2018 when this paper is written). No updating of the benchmark rates could be also the case when the PBC feels that there is no need to modify them over this period. Over the same period, the loan prime rate has not changed either.
16 It is a reference prime loan interest rate of 1-year maturity published on the website of the National Interbank Funding
Center at 11.30 a.m. (http://www.chinamoney.com.cn/fe/Channel/6623480), based on quotes collected from 10 big commercial banks every morning.
20
Five-Year Plan for Economic and Social Development18 to shift its monetary operation framework from
quantity-oriented management to price-oriented management. In particular, the 12th Plan emphasises to
“strengthen the role of open market operations in guiding money-market interest rates” (China Monetary
Policy Report 2012-3: 18) and the 13th Plan emphasises to build a target interest rate and interest-rate
corridor system (China Monetary Policy Report 2018-1: 23).
With the abolishment of interest-rate controls, the PBC is building its interest-rate corridor system. In 2015, the PBC started to talk that it would “explore an interest-rate corridor mechanism, enhance the interest-rate adjustment capability, and improve the mechanism for the transmission of central-bank policy rates to the financial market and the real economy” (China Monetary Policy Report 2015Q4: 65). At the ceiling of the corridor is the interest rate of the standing lending facility (SLF) that was introduced in early 2013, at the floor is the interest rate that the PBC pays on banks’ excessive reserves (currently at 0.72%), and, most important, there would be a market-determined interest rate above the floor and below the ceiling. Through the SLF, the central bank can inject liquidity to the money market,19 while banks can withdraw liquidity from the money market at the lower bound of the corridor when the money market interest rate falls below this level. The PBC’s open market operations would be transmitted to the money market interest rate that is market-determined, but lies within the upper and lower bounds. Yet, the PBC has never clearly announced which money market interest rate that it is targeting. Neither has it
ever announced the explicit target value of the money market interest rate (see also Sun 2018).
There are some guesses about the PBC’s candidates of the money market target rate, including the repo rate or the interbank pledged repo rate.20 They are both available as transaction-weighted averages on a daily basis. The argument in favour of the interbank pledged repo rate is that it applies to bank-to-bank transactions only while the repo also applies to the transactions between banks and non-banking financial institutions in the money market. Given the SLF and MLF are eligible for banks only; it is desirable to target a policy rate purely for bank-to-bank transactions (see BBVA 2016, 2017).
Fig. 10 presents two repo rates, together with the SLF rate, all of 7-day maturity, for the 2015M06-2018M05 period. The reference money market interest rate, the SHIBOR, is presented in the figure as well, which is quote-based, analogous to the LIBOR, and was introduced in January 2007 in China. The change of the upper bound, the SLF rate, is rare, three times over this period. The market interest rates
18 The 12th (13th) five-year plan covers the 2010-2015 (2016-2020) period.
19 In addition to the SLF, the central bank has other liquidity injection tools with longer tenors of 3-month, 6-month and
1-year, namely the Medium-term Lending Facility (MLF) that was introduced in September 2014. However, a preliminary assessment done in Sun (2018) indicates that the immediate effects of changes in these two central bank lending rates on market interest rates are limited.
In the meantime, the PBC conducts open market operations (OMO), mainly including repo and reverse repo transactions, to align the policy rate target with policymakers’ desired level. In 2016, the PBC increased the frequency of OMO to a daily -basis from two days per week previously.
20 Under an (outright) repo transaction the ownership of collateral is transferred to the cash lender for the length of the
21
are much more volatile. The SHIBOR rate remains the lowest among these three money market rates,
[image:22.595.117.488.311.568.2]but still far above the lower bound (the interest rate on the excess reserves), which is 0.72% throughout the period and not presented in the figure. The money market rates, in all three measures, were low before 2017 and lying below the upper bound of the SLF rate. Afterwards, the market interest rates, especially two repo rates, went up in March 2017. Though the SLF was also adjusted upwards, both the repo rate and the interbank pledged repo rate happened to be very volatile and broke through the upper bound of the corridor on many days. It seems that since 2017, these two money market interest rates have not been effectively confined to the corridor. Only the reference money market rate, the SHIBOR, has moved within the corridor. The possible reason for this ineffective upper bound might be due to the fact that the banks cannot borrow from the PBC as much as they wanted with the SLF, which in turn has resulted in a market interest rate above the SLF rate on those days of high demand for liquidity.
Figure 10. The SLF rate and the money market interest rates, 2015M06-2018M05
1 2 3 4 5 6 7
1 2 3 4 5 6 7
06 07 10 01 04 07 10 01 04 07 10 01 04
2015 2016 2017 2018
pledged repo repo
shibor SLF
Source: Data from the PBC and China Foreign Exchange Trade System (CFETS).
22
References
BBVA. 2016. "China Looking for New Monetary Policy Tools in the Liberalized-Interest-Rate Environment." In. Hong Kong: BBVA.
———. 2017. "China Monetary Policy: New Framework, New Stance." In. Hong Kong: BBVA.
Bell, Stephen, and Hui Feng. 2013. The Rise of the People's Bank of China (Harvard University Press: MA). Bernanke, Ben S, and Kenneth N Kuttner. 2005. 'What Explains the Stock Market's Reaction to Federal Reserve
Policy?', The Journal of Finance, 60: 1221-57.
Boivin, Jean, Michael T. Kiley, and Frederic S Mishkin. 2010. 'How Has the Monetary Tansmission Mechanism Evolved Over Time?' in Benjamin M. Friedman and Michael Woodford (eds.), Handbook of Monetary
Economics.
Caixin. 2018. 'Exclusive Interview with YI Gang', Caixin, 2018/05/07.
Chen, Hongyi, Qianying Chen, and Stefan Gerlach. 2013. 'The Implementation of Monetary Policy in China: The Interbank Market and Bank Lending', International Finance Review, 14: 31-69.
Chen, Hongyi, Michael Funke, Ivan Lozev, and Andrew Tsang. 2017. 'To Guide or Not to Guide? Quantitative Monetary Policy Tools and Macroeconomic Dynamics in China', BOFIT Discussion Papers, 3/2017. El-Shagi, Makram, and Lunan Jiang. 2017. 'Monetary Policy Transmission in China: Dual Shocks with Dual
Bond Markets', CFDS Discussion Paper, No. 2-2017.
Fan, Longzhen, and Anders C. Johansson. 2010. 'China’s Official Rates and Bond Yields', Journal of Banking &
Finance, 34: 996-1007.
Gilbert, R Alton. 1986. 'Requiem for Regulation Q: What It Did and Why It Passed Away', Federal Reserve Bank
of St. Louis Review.
Hachem, Kinda Cheryl, and Zheng Michael Song. 2016. 'Liquidity Regulation and Unintended Financial Transformation in China', National Bureau of Economic Research Working Paper Series, No. 21880. He, Dong, and Honglin Wang. 2012. 'Dual-Track Interest Rates and the Conduct of Monetary Policy in China',
China Economic Review, 23: 928 - 47.
Hellmann, Thomas F, Kevin C Murdock, and Joseph E Stiglitz. 2000. 'Liberalization, Moral Hazard in Banking, and Prudential Regulation: Are Capital Requirements Enough?', American Economic Review: 147-65. Jiang, Liangliang, Ross Levine, and Chen Lin. 2017. 'Does Competition Affect Bank Risk?', National Bureau of
Economic Research Working Paper Series, No. 23080.
Keeley, Michael C. 1990. 'Deposit Insurance, Risk, and Market Power in Banking', The American Economic
Review: 1183-200.
Klingelhöfer, Jan, and Rongrong Sun. 2017. 'Macroprudential Policy, Central Banks and Financial Stability: Evidence from China', MPRA Paper, 79033.
———. 2018. 'China's regime-switching monetary policy', Economic Modelling, 68: 32-40.
Koch, Christoffer. 2015. 'Deposit Interest Rate Ceilings as Credit Supply Shifters: Bank Level Evidence on the Effects of Regulation Q', Journal of Banking & Finance, 61: 316-26.
Kuttner, Kenneth N. 2001. 'Monetary Policy Surprises and Interest Rates: Evidence from the Fed Funds Futures Market', Journal of monetary economics, 47: 523-44.
Lardy, Nicholas R. 2008. 'Financial Repression in China', Peterson Institute for International Economics Policy
Brief, 08-8.
Li, Yang, Xiaojing Zhang, and Xin Chang. 2015. China National Balance Sheet 2015 (China Social Science Publishing House).
Ma, Guonan, Xiandong Yan, and Xi Liu. 2013. 'China’s Evolving Reserve Requirements', Journal of Chinese
Economic and Business Studies, 11: 117-37.
Ma, Jun, and Honglin Wang. 2014. 'Theoretical Model of the Transmission Mechanism of the Central Bank Policy Rate in China (in Chinese)', Journal of Financial Research, 2014: 1-22.
Ma, Qing-Ping. 2017. 'Contribution of Interest Rate Control to China’s Economic Development', Journal of
Chinese Economic and Business Studies, 15: 325-52.
Perry, Emily, and Florian Weltewitz. 2015. 'Wealth Management Products in China', RBA Bulletin, 2015: 59-68. People's Bank of China. Annual Reports, various issues.
People's Bank of China. China Financial Stability Report, various issues. People's Bank of China. China Monetary Policy Report, various issues.
Qian, Yingyi. 2017. How Reforms Worked in China: The Transition from Plan to Market (The MIT Press).
Song, Zheng Michael, and Wei Xiong. 2018. 'Risks in China’s Financial System', National Bureau of Economic
Research Working Paper Series, No. 24230.
23
———. 2015. 'What Measures Chinese Monetary Policy?', Journal of International Money and Finance, 59: 263-86.
———. 2018. 'Monetary Policy Announcements and Market Interest Rates's Response: Evidence from China',
MPRA Paper no. 87703.
———. forthcoming. 'A Narrative Indicator of Monetary Conditions in China', International Journal of Central
Banking.
Xu, Bing, Adrian van Rixtel, and Michiel van Leuvensteijn. 2016. 'Measuring Bank Competition under Binding Interest Rate Regulation: The Case of China', Applied Economics: 1-20.
Yi, Gang. 2015. "On Removal of the Deposit Interest Rate Ceiling." In Speeches. The People's Bank of China.
———. 2018. "Governor YI Gang Announced Measures and Timetable for Further Financial Sector Opening-Up in C." In Boao Forum for Asia. The People's Bank of China.
