Original Article
Pressure controlled ventilation on stroke volume
variation as a predictor of fluid responsiveness
in patients
Weiguang Ye1, Bin Wang2, Limin Wei1, Tianlong Wang1
1Department of Anesthesiology, Xuanwu Hospital Capital Medical University, Beijing, China; 2Department of
Mathematics and Statistics, University of South Alabama, Mobile, AL, USA
Received December 5, 2015; Accepted March 10, 2016; Epub June 15, 2016; Published June 30, 2016
Abstract: Background: Stroke volume variation (SVV), a dynamic index, shows high sensitivity and specificity in predicting the fluid responsiveness of patients undergoing mechanical ventilation. Previous studies have shown that SVV-oriented fluid management performs positive effect in the perioperative maintenance of hemodynamic and better prognosis. It also could be used to predict the fluid responsiveness under one-lung ventilation with con
-stant volume. The present study was aimed to determine the feasibility of stroke volume variation as a predictor for fluid responsiveness under pressure-controlled one-lung ventilation. Methods: Seventy patients were enrolled
and divided into two groups with distinct ventilation pressures (20 cmH2O and 25 cmH2O). ROC curve analysis was
performed to evaluate the capacity of SVV for prediction. Results: Sixty-three out of 70 patients completed the study. SVV showed weak correlation with dSVV and dSVI. The optimal threshold value of SVV to discriminate between responders and nonresponders was 9.5% (sensitivity 75.6% and specificity 54.5%). The optimal threshold value of SVV to discriminate between responders and non-responders remains to be 9.5% for both subgroups with 20
cmH2O and 25 cmH2O. Conclusion: SVV is a poor predictor of fluid responsiveness for patients undergoing
pressure-controlled one-lung ventilation.
Keywords: Goal-oriented fluid management, stroke volume variation, pressure-controlled, one-lung ventilation, fluid responsiveness
Introduction
The pattern of thoracic surgery has been expe-riencing a significant change in recent decades. Procedure of pneumonectomy is transforming from open surgery to video assisted thoraco-scopic surgery and robot-assisted pneumonec-tomy. However, the progress on surgical tech-niques didn’t effectively reduce the postopera-tive mortality, shorten the duration of hospital stays, or decrease the incidence of pulmonary complications [1, 2]. Certain factors have been proved to be associated with the pulmonary complications, among which the perioperative fluid administration is gaining more attentions [3, 4]. The goal-directed therapy is becoming an ideal strategy for fluid administration, due to the complexity of fluid resuscitation in thoracic surgeries.
presented that SVV could be used as a sensi-tive index for prediction of double-lung infusion response under mechanical ventilation [7-12]. A study conducted by Suehiro and Okutani et al reported that SVV could be used to predict the infusion response with a constant one-lung ventilation volume of 8 mL/kg [13]. However, it is still unknown whether infusion response is predictable by SVV with constant pressure one-lung mechanical ventilation. In this study, we aim to figure out the feasibility of SVV to be used as an index to predict the fluid responsive-ness in patients undergoing pressure-con-trolled one-lung ventilation.
Methods
This study has been approved by the ethics committee in Xuanwu Hospital Capital Medical University. All the patients involved have signed the informed consents.
Seventy subjects (ASA I-II) scheduled to under-go thoracoscopic lobectomy were recruited and randomly assigned to two groups (designated as group A and B, 35 subjects in each group). The ventilation pressures for group A and B are 20 cmH2O and 25 cmH2O, respectively. Subjects meeting one or more of the following conditions were excluded from the study:
Subjects with insufficiency in cardiac, renal or hepatic function; Obese subjects with body mass index (BMI) over 35; Subjects with valve disease or arrhythmia.
Subjects in two groups fasted routinely before operation. Peripheral venous were open and routine monitoring of HR, ECG, SpO2 started shortly after patients entering the operation room. Radial artery cannulation (RAC) was per-formed under local anesthesia. SBP, DBP, MBP, CO, CI, SVI and SVV were measured using FloTrac/Vigileo system. The same model of
for female) was placed by orotracheal intuba-tion 2 min later and fixed appropriately after the confirmation of correct position by auscul-tation on both lungs. The pressure-controlled mode was adopted for mechanical ventilation. Pressure was set at 20 cmH2O for group A and 25 cmH2O for group B. For both groups, the inhaled oxygen concentration was 100% and the end-tidal CO2 partial pressure was kept between 35 mmHg and 45 mmHg.
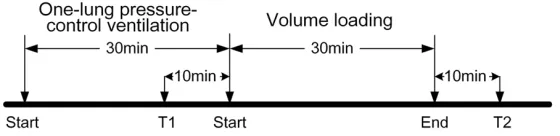
[image:2.612.90.370.73.141.2]Anesthesia was maintained with 4-5 mg/kg/h propofol and 0.2-0.3 μg/kg/min remifentanil. Depth of anesthesia was maintained at 40-60 using a BIS monitor. All patients were given 3 ml/kg of Ringer’s solution intravenously during the induction of anesthesia, and then were maintained with 2 mL/kg/h of Ringer’s solu-tion. All the clinical observations were per-formed 30 min after the one-lung ventilation at lateral decubitus position. Baseline hemody-namics, including HR, MAP, CO, CI, SVI and SVV, were measured simultaneously after induction of anesthesia when CI became stable. After a period of 10 min of stable hemodynamics, vol-ume loading was performed by the administra-tion of 500 ml colloid soluadministra-tion (6% hydroxyethyl starch, MW 70,000) over 30 min. Hemodynamic variables including HR, BP, CO, CI, SVI, and SVV were measured before (T1, 10 minutes) and after (T2, 10 minutes) volume loading (Figure 1). No volume loading steps were performed if stable baseline hemodynamic variables were not achieved for 10 minutes. The measure-ments were obtained during stable periods. Patients were excluded from this study if con-tinuous treatment with vascular active drug was needed. The FloTrac/Vigileo screen was turned away from the attending anesthesiolo-gist; and an independent research staff record-ed the FloTrac/Vigileo variables. Patients show-ing an increase in SVI of 15% or more after VE were defined as responders, whereas patients whose SVI increased by less than 15% were Figure 1. The time course of sample points T1 and T2. All patients were
studied at 30 minutes after starting one-lung ventilation.
FloTrac/Vigileo system was app- lied throughout the study.
classified as nonresponders. This cutoff value of 15% was chosen based on the findings from previous studies indicating that this difference is clinically significant for SVI and CO after VE [14, 15]. After all measurements of hemody-namic were done, the surgery was initiated.
A paired t-test was used to compare the hemo-dynamic variables in Table 1 before and after volume loading. An un-paired t-test was used to compare the changes of hemodynamic vari-ables for the responders in Table 2. The asso-ciation between SVV and each of dSVV and dSVI is assessed using Pearson correlation and regression.
The descriptive statistics for the hemodynamic variables were shown as Mean ± SD. Receiver operating characteristic (ROC) curves were gen-erated for SVV by varying the discriminating the threshold of the variable. A significance level of 0.05 was used. CRAN R software was used for statistical analysis.
Results
Among all 70 recruited subjects, 63 of them completed this study (43 males and 20 fe-
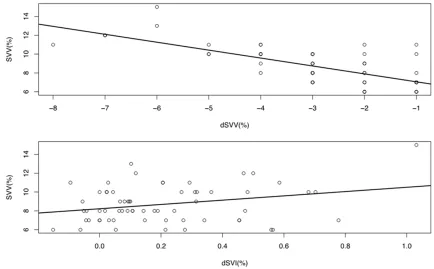
tween SVV and dSVV, but not very strong between SVV and dSVI (Figure 2).
The overall performance for SVV in predicting the responsiveness of the stroke volume to intravascular volume expansion was evaluated by constructing ROC curves. The area under the ROC curve was 0.574 for SVV (95% confidence interval 0.41-0.737). The optimal threshold value of SVV to discriminate between respond-ers and nonrespondrespond-ers was 9.5% (sensitivity 75.6% and specificity 54.5%, Figure 3).
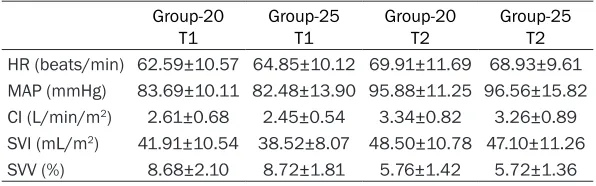
Comparative analysis was conducted between the results of the two subgroups with airway pressure 20 cmH2O and 25 cmH2O. Table 3 shows the mean and standard deviation of each of the hemodynamic variable for the two subgroups at T1 and T2, respectively. The differences between the two subgroups were compared using a t-test. Results showed that the mean values were not significantly different for all hemodynamic variables between the two groups at T1 and T2. In addition, we compared the differences between the two subgroups among the responders and the results showed that none of the differences was significant at level 0.05. In summary, no significant differ-Table 1. Hemodynamic variables at Sample Points T1
and T2
T1 T2 P value HR (beats/min) 63.63±10.34 69.46±10.71 < 0.0001 MAP (mmHg) 83.14±11.90 96.19±13.42 < 0.0001 CI (L/min/m2) 2.54±0.62 3.30±0.85 < 0.0001
SVI (mL/m2) 40.35±9.56 47.86±10.94 < 0.0001
SVV (%) 8.70±1.96 5.75±1.38 < 0.0001 CO 4.52±1.20 5.90±1.64 < 0.0001 SBP 107.44±32.62 123.52±34.47 < 0.0001
DBP 61.38±18.01 69.33±20.85 < 0.0001
Table 2. Hemodynamic data at baseline (T1) in re-sponders and nonrere-sponders to volume expansion
Responders to Volume Expan-sion (n = 22)
Nonresponders to Volume
Ex-pansion (n = 41) P value HR (beats/min) 65.57±10.85 62.55±10.03 0.2257 MAP (mmHg) 82.14±12.94 83.68±11.43 < 0.0001 CI (L/min/m2) 2.34±0.48 2.65±0.67 < 0.0001
SVI (mL/m2) 36.27±7.10 42.54±10.06 < 0.0001
SVV (%) 9.14±2.36 8.46±1.69 < 0.0001
males, 34 in group A and 29 in group B). Lobectomies were performed under tho-racoscopy in the same way for all patients. Twenty-nine patients had left-sided oper-ations and 34 had right-sided operoper-ations. BMI has a mean of 24.67 and SD of 3.23, with a maximum of 31.62.
All hemodynamic variables changed sig-nificantly after volume loading. Systolic and diastolic blood pressures were com-puted based on variable ABP in the raw data (see Table 1).
Among the 63 patients, 22 (35%) were responders to intravascular volume ex- pansion and 41 (65%) were nonrespond- ers. Their hemodynamic data at baseline (T1) are shown in Table 2 (Column 2 and 3). We found that all hemodynamic vari-ables except HR changed significantly for responders after volume loading (last col-umn of Table 1).
ence was found among all hemodynamic vari-ables between the two groups with pressure 20 and 25, respectively.
The overall performance for SVV in predicting the responsiveness of the stroke volume to
[image:4.612.88.522.71.340.2]erative period has been one of the major goals of invasive hemodynamic monitoring. Previous studies have shown the limitations of tradition-al fluid therapy monitoring method in hemody-namics [16, 17]. SVV is a sensitive index in fluid infusion response prediction and a dynamic Figure 2. Top panel: regression line SVV = 6.21-0.84 dSVV with R-squared = 0.52, Pearson correlation coefficient =
-0.722 (p-value < 0.0001). Bottom panel: regression line SVV = 8.23 + 2.28 dSVI with R-squared = 0.078. Pearson correlation coefficient = 0.28 (p-value = 0.026).
Figure 3. ROC curve for SVV in predicting the responsiveness of the stroke vol -ume to intravascular vol-ume expansion.
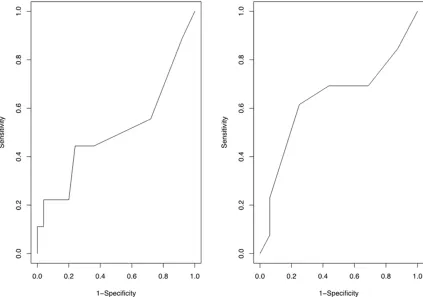
intravascular volume ex- pansion was evaluated by constructing ROC curves for the two subgroups, re- spectively (see Figure 4). The area under the ROC curve for the group with pressure 25 was 0.637, while the area for the other group was 0.507. The opti-mal threshold value of SVV to discriminate between responders and non-res- ponders remained to be 9.5% for both subgroups.
Discussion
[image:4.612.92.388.402.603.2]periop-index in patient’s volume determination. It is a hotspot for clinical practice that whether SVV measurement would be influenced by the change of venous return, pre load and pot load of heart, in the condition of thoracic operation. Flotrac/Vigileo system is one of the minimally invasive methods of monitoring for clinical application. The Vigileo/FloTrac system allows for automatic and continuous monitoring of SVV, which is easy to evaluate and may indicate fluid responsiveness during mechanical venti- lation. Positive-pressure ventilation induces cyclic changes in left ventricular stroke volume that are related mainly to the expiratory de- crease in left ventricular preload because of the inspiratory decrease in right ventricular fill-ing and ejection. SVV obtained with the Vigileo/ FloTrac system has shown good correlation for predicting fluid responsiveness in patients under VCV during major surgery [5, 14, 15]. One-lung ventilation is required in thoracic sur-gery, due to the demand of surgical vision field and operation. Routine ventilation could be divided into volume-controlled and pressure-controlled. Volume-controlled ventilation en- sures the delivery of a defined tidal volume and uses a square waveform flow delivery method that produces high peak airway pressures in low-compliance states. On the other hand, pressure-controlled ventilation (PCV) uses a decelerating inspiratory flow delivery method, which has been known to reduce the peak air-way pressure and allows a more homogeneous gas distribution [18].
The capability of SVV to predict fluid respon-siveness in patients undergoing OLV has been evaluated [15]. The ventilation in these studies was volume controlled, with tidal volume over 8 ml/kg. This setting may cause excessive peak pressure in one-lung ventilation. Previous stud-ies showed that ventilation with airway
pres-pressure, thus to decrease the risk of following ventilator-associated lung injuries [20, 21]. Pressure controlled mechanical ventilation was adopted in the present study to explore wheth-er SVV could be used to predict the fluid re- sponsiveness. Considering the difference in patients’ lung compliances, two airway pres-sures, 20 cmH2O and 25 cmH2O, were applied in this study. The results of the present study suggest that SVV before volume loading was significantly correlated with dSVV and dSVI. The linear relation was moderately strong between SVV and dSVV, but not very strong between SVV and dSVI.
The authors evaluated the overall performance of SVV in predicting the responsiveness of the stroke volume to intravascular volume expan-sion. Results showed that the area under the ROC curve was 0.574 for SVV (95% Cl 0.41-0.737), the optimal threshold value of SVV to discriminate between responders and nonre-sponders was 9.5% (sensitivity 75.6% and specificity 54.5%). SVV is not very good in pre-dicting the fluid infusion response under one-lung ventilation with constant pressure. We also performed the ROC curve analysis with varied ventilation pressure. Results showed that SVV is better in predicting the responsive-ness of the stroke volume to intravascular vol-ume expansion in the group with airway pres-sure 25 cmH2O than that in the other group (with airway pressure 20 cmH2O). The area under the ROC curve for the group with pres-sure 25 is 0.637, while the area for the other group is 0.507. Overall speaking, SVV is poor in predicting the responsiveness of the stroke vol-ume to intravascular volvol-ume expansion among the patients with airway pressure 20 and 25, respectively, and altogether.
One limitation of the study was that SVI obtained by the Vigileo/FloTrac system was used to determine the responders and the non-Table 3. Hemodynamic variables at Sample Points T1 and T2
be-tween the two subgroups (20 versus 25)
Group-20
T1 Group-25T1 Group-20T2 Group-25T2
HR (beats/min) 62.59±10.57 64.85±10.12 69.91±11.69 68.93±9.61
MAP (mmHg) 83.69±10.11 82.48±13.90 95.88±11.25 96.56±15.82
CI (L/min/m2) 2.61±0.68 2.45±0.54 3.34±0.82 3.26±0.89 SVI (mL/m2) 41.91±10.54 38.52±8.07 48.50±10.78 47.10±11.26
SVV (%) 8.68±2.10 8.72±1.81 5.76±1.42 5.72±1.36
sure higher than 30 cmH2O could increase the risk of pulmonary barotrauma, sti-
[image:5.612.89.387.96.189.2]responders to volume expansion. The earlier validation studies of the FloTrac/Vigileo system have demonstrated conflicting results [22, 23]. However, with the updated software, the recent clinical studies have demonstrated promising results [24]. Jo et al demonstrated that the CO measured by the FloTrac/Vigileo system was reliable even in patients with a decreased ejec-tion fracejec-tion of LV and in a low cardiac output status during off-pump coronary bypass sur-gery [25].
Another limitation of this study was that other variables of fluid responsiveness, such as CVP, PCWP, and transesophageal echocardiography-derived assessment, were not measured simul-taneously with SVV. The SVV value has to be considered after a period of hemodynamic sta-bility in order to avoid misleading values that may have been induced by any acute change in HR or MAP. It is important to observe a steady hemodynamic state before accepting the SVV value [5].
The thresholds of SVV to predict fluid respon-siveness under two pressures are both 9.5%,
but with poor sensitivity. This is likely due to the diversity in the patients’ thorax size. The fixed airway pressure may have different impacts on the filling of thoracic great vessels and left ven-tricle, lead to the poor correlation between dSVI and SVV, before and after the infusion. Thus SVV is not an effective predictor for fluid respon-siveness, in the condition of constant ventila-tion pressure. Pressure Control Ventilaventila-tion- Ventilation-Volume Guarantee (PCV-VG), another approach for mechanical ventilation, is more intelligent and accord with human physiology. Under the precondition of ensuring appropriate tidal vol-ume, ventilator feeds back the PIP for the fol-lowing ventilation to decrease the ventilation pressure as much as possible, by automatic and continuous evaluation of association between lung compliance, ventilation volume and pressure. The further trial could be con-ducted with PCV-VG, to test whether SVV is a good predictor for fluid responsiveness.
[image:6.612.96.519.73.370.2]SVV is a poor predictor of fluid responsiveness for patients undergoing pressure-controlled one-lung ventilation.
Acknowledgements
This study was done in Xuanwu Hospital Capital Medical University, 45 Changchun Road, Beijing 100053, China. This work was supported by Beijing 215 high level healthcare talent plan -academic leader 008-0027.
Disclosure of conflict of interest
None.
Address correspondence to: Tianlong Wang, De-
partment of Anesthesiology, Xuanwu Hospital
Capi-tal Medical University, 45 Changchun Road, Bei-
jing 100053, China. Tel: +86-1083198899; Fax: +86-1063131271; E-mail: [email protected]
References
[1] Gopaldas RR, Bakaeen FG, Dao TK, Walsh GL, Swisher SG, Chu D. Video-assisted thoraco-scopic versus open thoracotomy lobectomy in
a cohort of 13,619 patients. Ann Thorac Surg 2010; 89: 1563-1570.
[2] Louie BE, Farivar AS, Aye RW, Vallières E. Early experience with robotic lung resection re-sults in similar operative outcomes and mor-bidity when compared with matched video- assisted thoracoscopic surgery cases. Ann
Thorac Surg 2012; 93: 1598-1604; discussion
1604-1605.
[3] Alam N, Park BJ, Wilton A, Seshan VE, Bains MS, Downey RJ, Flores RM, Rizk N, Rusch VW,
Amar D. Incidence and risk factors for lung in
-jury after lung cancer resection. Ann Thorac Surg 2007; 84: 1085-1091; discussion 1091.
[4] Marret E, Miled F, Bazelly B, El Metaoua S, de Montblanc J, Quesnel C, Fulgencio JP, Bonnet
F. Risk and protective factors for major compli
-cations after pneumonectomy for lung cancer.
Interact Cardiovasc Thorac Surg 2010; 10: 936-939.
[5] Cannesson M, Musard H, Desebbe O, Boucau
C, Simon R, Hénaine R, Lehot JJ. The ability of
stroke volume variations obtained with Vigileo/
FloTrac system to monitor fluid responsiveness
in mechanically ventilated patients. Anesth
Analg 2009; 108: 513-517.
[6] Mayer J, Boldt J, Mengistu AM, Röhm KD, Suttner S. Goal-directed intraoperative therapy based on autocalibrated arterial pressure
waveform analysis reduces hospital stay in
high-risk surgical patients: a randomized,
con-trolled trial. Crit Care 2010; 14: R18.
[7] Fu Q, Mi WD, Zhang H. Stroke volume variation
and pleth variability index to predict fluid re
-sponsiveness during resection of primary ret
-roperitoneal tumors in Hans Chinese. Biosci
Trends 2012; 6: 38-43.
[8] Correa-Gallego C, Tan KS, Arslan-Carlon V, Gonen M, Denis SC, Langdon-Embry L, Grant F, Kingham TP, DeMatteo RP, Allen PJ, D’Angelica
MI, Jarnagin WR, Fischer M. Goal-directed fluid therapy using stroke volume variation for re
-suscitation after low central venous
pressure-assisted liver resection: a randomized clinical trial. J Am Coll Surg 2015; 221: 591-601. [9] Parida S, Vasudevan A, Badhe A, Angappan S.
The comparison of stroke volume variation with central venous pressure in predicting fluid
responsiveness in septic patients with acute
circulatory failure. Indian J Crit Care Med
2015; 19: 394.
[10] Chin JH, Jun IG, Lee J, Seo H, Hwang GS, Kim YK. Can stroke volume variation be an alterna-tive to central venous pressure in patients un-dergoing kidney transplantation? Transplant Proc 2014; 46: 3363-3366.
[11] Vergnaud E, Vidal C, Verchere J, Miatello J, Meyer P, Carli P, Orliaguet G. Stroke volume variation and indexed stroke volume
mea-sured using bioreactance predict fluid respon -siveness in postoperative children. Br J Anaesth 2015; 114: 103-109.
[12] Peng K, Li J, Cheng H, Ji F. Goal-directed fluid
therapy based on stroke volume variations
im-proves fluid management and gastrointestinal perfusion in patients undergoing major ortho -pedic surgery. Med Princ Pract 2014; 23: 413-420.
[13] Suehiro K, Okutani R. Stroke volume variation
as a predictor of fluid responsiveness in pa -tients undergoing one-lung ventilation. J Cardiothorac Vasc Anesth 2010; 24: 772-775. [14] Derichard A, Robin E, Tavernier B, Costecalde
M, Fleyfel M, Onimus J, Lebuffe G, Chambon
JP, Vallet B. Automated pulse pressure and
stroke volume variations from radial artery:
evaluation during major abdominal surgery. Br
J Anaesth 2009; 103: 678-684.
[15] Hofer CK, Senn A, Weibel L, Zollinger A. Assessment of stroke volume variation for pre
-diction of fluid responsiveness using the modi
-fied FloTrac and PiCCOplus system. Crit Care 2008; 12: R82.
[16] Kumar A, Anel R, Bunnell E, Habet K, Zanotti S, Marshall S, Neumann A, Ali A, Cheang M, Kavinsky C, Parrillo JE. Pulmonary artery
occlu-sion pressure and central venous pressure fail to predict ventricular filling volume, cardiac performance, or the response to volume infu -sion in normal subjects. Crit Care Med 2004; 32: 691-699.
[17] Michard F, Teboul J. Predicting fluid respon
[18] Fernández-Pérez ER, Keegan MT, Brown DR, Hubmayr RD, Gajic O. Intraoperative tidal
vol-ume as a risk factor for respiratory failure after
pneumonectomy. Anesthesiology 2006; 105:
14-18.
[19] Verhage RJ, Croese AC, van Hillegersberg R. Reduced local immune response with continu-ous positive airway pressure during one-lung
ventilation for oesophagectomy. Br J Anaesth
2015; 114: 1009-1010.
[20] Gama de Abreu M, Heintz M, Heller A, Széchényi R, Albrecht DM, Koch T. One-lung ventilation with high tidal volumes and zero positive end-expiratory pressure is injurious in the isolated rabbit lung model. Anesth Analg
2003; 96: 220-228, table of contents.
[21] Petrucci N, Iacovelli W. Ventilation with smaller tidal volumes: a quantitative systematic review
of randomized controlled trials. Anesth Analg
2004; 99: 193-200.
[22] Michelet P, D’Journo XB, Roch A, Doddoli C, Marin V, Papazian L, Decamps I, Bregeon F,
Thomas P, Auffray JP. Protective ventilation influences systemic inflammation after esoph -agectomy: a randomized controlled study. Anesthesiology 2006; 105: 911-919.
[23] Mayer J, Boldt J, Schöllhorn T, Röhm KD, Mengistu AM, Suttner S. Semi-invasive
moni-toring of cardiac output by a new device using arterial pressure waveform analysis: a com -parison with intermittent pulmonary artery thermodilution in patients undergoing cardiac
surgery. Br J Anaesth 2007; 98: 176-182.
[24] de Waal EE, Kalkman CJ, Rex S, Buhre WF.
Validation of a new arterial pulse
contour-based cardiac output device. Crit Care Med 2007; 35: 1904-1909.
[25] Jo YY, Song JW, Yoo YC, Park JY, Shim JK, Kwak YL. The uncalibrated pulse contour cardiac
output during off-pump coronary bypass sur
-gery: performance in patients with a low cardi