SemEval-2015 Task 17: Taxonomy Extraction Evaluation (TExEval)
Georgeta Bordea, Paul Buitelaar
Insight
Centre for Data Analytics
National University of Ireland, Galway
[email protected]Stefano Faralli, Roberto Navigli
Dipartimento di Informatica
Sapienza University of Rome
Italy
Abstract
This paper describes the first shared task on Taxonomy Extraction Evaluation organ-ised as part of SemEval-2015. Participants were asked to find hypernym-hyponym re-lations between given terms. For each of the four selected target domains the partici-pants were provided with two lists of domain-specific terms: a WordNet collection of terms and a well-known terminology extracted from an online publicly available taxonomy. A total of 45 taxonomies submitted by 6 participating teams were evaluated using standard structural measures, the structural similarity with a gold standard taxonomy, and through manual qual-ity assessment of sampled novel relations.
1 Introduction
SemEval-2015 Task 17 is concerned with the auto-matic extraction of hierarchical relations from text and subsequent taxonomy construction. A taxon-omy is a hierarchy of concepts that expresses parent-child or broader-narrower relationships. Because of their many applications in search, retrieval, website navigation, and records management, taxonomies are valuable resources for libraries, publishing com-panies, online databases, and e-commerce compa-nies. Taxonomies are most often manually created resources that are expensive to construct and main-tain, and therefore there is a need for automatic methods for taxonomy enrichment and construction. Recently, the task of taxonomy learning from text, also called taxonomy induction, has received an in-creased interest in the natural language processing
community, as taxonomical information is a valu-able input to many semantically intensive tasks in-cluding inference, question answering (Harabagiu et al., 2003) and textual entailment (Geffet and Dagan, 2005).
Taxonomy learning can be divided into three main subtasks: term extraction, relation discovery, and
taxonomy construction. Term extraction is a
rel-atively well-known task, hence we decided to ab-stract from this stage and provide a common ground for the next steps by making available the list of
terms beforehand. Most approaches forrelation
dis-covery from text rely on lexico-syntactic patterns (Hearst, 1992; Kozareva et al., 2008), co-occurrence information (Sanderson and Croft, 1999), substring inclusion (Nevill-Manning et al., 1999), or exploit semantic relations provided in textual definitions (Navigli and Velardi, 2010). Any asymmetrical rela-tion that indicates subordinarela-tion between two terms can be considered, but here the focus is mainly on hyponym-hypernym relations. Depending on the ap-proach selected, the task may or may not require large amounts of text to extract relations between terms, therefore no corpus is provided as part of the shared dataset.
This stage usually produces a large number of noisy, inconsistent relations, that assign multiple parents to a node and that contain cycles, i.e., se-quences of vertices that start and end at the same vertex. Hence, the third stage of taxonomy learn-ing, taxonomy construction, focuses on the overall structure of the resulting graph and aims to organ-ise terms into a hierarchical structure, more specifi-cally a directed acyclic graph (Kozareva and Hovy,
target domains selection
target domains announcement
gold standards definition
target domains terminologies release
comparison against gold standard
participant output taxonomies
manual quality assessment
comparative evaluation
final teams rank
system outputs production
baseline outputs production
baseline taxonomies
1 2 3
4
5
6
[image:2.612.82.267.78.214.2]7
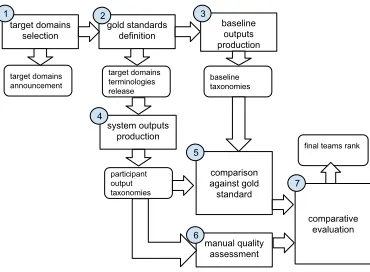
Figure 1:The task workflow.
2010; Navigli et al., 2011; Wang et al., 2013). To address the inherent complexity of evaluating tax-onomy quality, several methods have been consid-ered in the past including manual evaluation by do-main experts, structural evaluation, and automatic evaluation against a gold standard (Velardi et al., 2012). In this task, all these existing evaluation ap-proaches are considered, using a voting scheme to aggregate the results for the final ranking of the sys-tems. We introduce four new domains that have not previously been considered for this task, covering general knowledge domains such as food and equip-ment and technical domains such as chemicals and science. For each domain, we provide a gold stan-dard taxonomy gathered exclusively from WordNet (Fellbaum, 2005), as well as a gold standard tax-onomy that combines terms and relations gathered from other domain-specific sources.
2 Task workflow
In this section we present the task workflow, the con-sidered dataset, and the evaluation method used in this task.
Competition setup:In order to provide a common ground to all the competing teams, we applied the task workflow described in Figure 1, as follows: 1) select and announce a set of target domains (see Sec-tion 2.1 for more details); 2) define and collect gold standard taxonomies that will be used for evalua-tion and extract and release the set of terms that they cover; 3) select and produce baseline taxonomies us-ing naive baselines to be compared against the team outputs in the competition.
Competition and evaluation flow:As described in
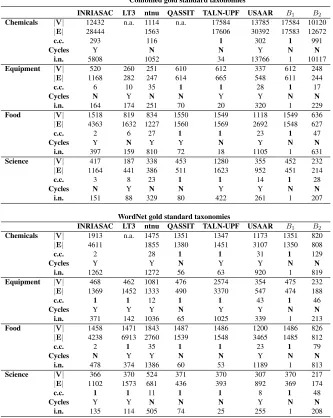
Table 1:Structural measures of Combined and WordNet gold standard taxonomies.
Combined WordNet taxonomies taxonomies Domain Root concept |V| |E| |V| |E|
Chemicals chemical 17584 24817 1351 1387 Equipment equipment 612 615 475 485 Food food 1156 1587 1486 1533 Science science 452 465 429 441
Figure 1, the next steps of the workflow concern the participation of the competing teams and the eval-uation of the resulting outputs as follows: 4) in this stage participants produce and submit the output tax-onomies. For each domain, test data consists of a list of domain terms that participants have to struc-ture into a taxonomy, with the possibility of adding further intermediate terms. Each system will return a list of pairs (term, hypernym). In this way, taxon-omy learning is limited to finding relations between pairs of terms and organising them into a hierarchi-cal structure. Participants are encouraged to con-sider polyhierarchies when organising terms. In this setting, nodes can have more than one parent and the final structure of the taxonomy is not necessar-ily a tree; 5) compare system outputs (4) and base-line taxonomies (3) with taxonomies produced as gold standards (2); 6) manually annotate a sample of system outputs to estimate the quality of hypernym-hyponym relationships that are not in the gold stan-dards; 7) create a combined rank of the teams based on the individual rank that each team reached on dif-ferent aspects of the evaluation.
2.1 Data
We selected four target domains with a rich, deep, hierarchical structure (i.e. Chemicals, Equipment, Food and Science) with four root concepts (i.e. chemical, equipment, food and science, respec-tively). Then, for each domain we produced two kinds of gold standard taxonomies.
WordNet taxonomy Concepts and relation-ships in the WordNet hypernym-hyponym hierarchy rooted on the corresponding root concept.
[image:2.612.316.537.96.181.2]tax-onomies other than WordNet: CheBI1 for
Chemi-cals, “The Google product taxonomy”2 for Foods,
the “Material Handling Equipment”3taxonomy for
Equipment, and the “Taxonomy of Fields and their
Subfields”4for Science. Hypernym-hyponym
rela-tionships were also gathered from a general purpose resource, the Wikipedia Bitaxonomy (WiBi) (Flati et al., 2014), using a semi-automatic approach. For each domain we first manually identified domain
sub-hierarchies from WiBi (W); Second we
auto-matically searched for the terms ofW in common
with the corresponding gold standardG. For each
common termtwe added inGthe taxonomy rooted
ontfromW.
Table 1 shows the resulting number of vertices
|V|, i.e., the number of terms given to the
partic-ipants, and the number of edges |E| of the
pro-duced gold standard taxonomies for the four target domains. Finally, test data consists of eight lists of domain concepts, for which participants were asked to output a set of hypernym-hyponym relationships.
2.2 Evaluation method
LetS= (VS, ES)be an output taxonomy produced
by a system for a given domain, whereVS includes
the set of domain concepts initially provided by the
task organisers andES is the set of taxonomy edges
extracted by the system. To broadly analyze the quality of the produced set of hypernymy
relation-shipsES, these results are benchmarked against two
naive baselines, described in Section 2.2.1, using the following evaluation approaches: i) analyse the graph structure and check if the produced taxonomy is a Directed Acyclic Graph (DAG); ii) compare the
edgesES, against the set of relations from each type
of gold standard; iii) manually validate a sample of novel relationships produced by the system that are not contained in the gold standard.
The final ranking of the systems takes into consid-eration these three types of evaluation by aggregat-ing the achieved ranks usaggregat-ing a votaggregat-ing scheme. First,
1http://www.ebi.ac.uk/chebi/init.do 2http://www.google.com/basepages/ producttype/taxonomy.en-US.txt
3http://www.ise.ncsu.edu/kay/mhetax/ index.htm
4http://sites.nationalacademies.org/PGA/ Resdoc/PGA_044522
the output taxonomies are ranked on the basis of the average performance obtained for each evaluated as-pect and for each domain. The resulting ranks are simply summed up, favouring systems at the top of the ranked list and penalising systems at the lower end.
2.2.1 Baselines
The main purpose of introducing the baselines de-scribed in this section is to check the performance of a system that relies mainly on the fact that the root of the domain is known and implements simple string-based approaches. In this task, the following two naive approaches for taxonomy construction are implemented and used for benchmarking systems:
Baseline 1 Simply connect all the nodes to the
root concept: B1 = (VB1, EB1) where EB1 =
{(root, a), a∈VB1 \ {root}};
Baseline 2A basic string inclusion approach that covers relations between compound terms such as
(science, network science):B2= (VB2, EB2)where
EB2 = {(a, b), bstarts with a or ends witha and
|b| > |a|}, and where a is a term and bis a
com-pound term that includesaas a substring.
Both approaches require only the root of the tax-onomy and the list of terms and do not require any external corpora or other structured information.
2.2.2 Structural analysis
The main goal of the structural evaluation of a tax-onomy is to quantify the size of the taxtax-onomy under investigation in terms of nodes and edges. A second objective is to evaluate whether the overall structure connects all the nodes in the graph with the root and whether it is consistent with the semantics of the ISA relation. Hierarchical relations are generally incon-sistent with the presence of cycles. Also, we high-light the number of nodes located on higher levels of a taxonomy, called intermediate nodes. These nodes are considered more important than leaves, to favour taxonomies with a deep, rich structure.
Based on these considerations, structural evalua-tion is performed by computing the cardinality of
|VS| and |ES|. A topological sorting-based
of connected components in S. Finally, we compute the number of intermediate nodes as the number of
nodes|VS| − |LS|whereLS is the set of leaf nodes
in S. A leaf node is a node with out-degree = 0.
2.2.3 Comparison against Gold Standard
Previous datasets for evaluating taxonomy extrac-tion (Kozareva et al., 2008) mainly rely on Word-Net to gather gold standards from several general knowledge domains, such as animals, plants, and vehicles. The datasets proposed in (Velardi et al., 2013) enrich this experimental setting by including two specialized domains, Virus and Artificial Intel-ligence, that have low coverage in WordNet. A lim-itation of these datasets is that currently there is no gold standard taxonomy for these domains, therefore only a manual evaluation is possible. The dataset introduced here, instead, covers four new domains, providing two separate gold standards for each do-main: one collected from WordNet, a general pur-pose resource, and a second one that combines re-lations from domain-specific resources and from a collaborative resource, Wikipedia, for a higher cov-erage of the domain. This dataset allows us to in-vestigate how a system performs when taxonomis-ing frequently used terms in comparison with more specialised, rarely used terms.
Given a gold standard taxonomyG = (VG, EG),
the comparison between a target taxonomy and a gold standard taxonomy is quantified using the fol-lowing measures:
• common nodes:|VS∩VG|
• vertex coverage:|VS∩VG|/|VG|
• number of common edges:|ES∩EG|
• edge coverage:|ES∩EG|/|EG|
• ratio of novel edges:(|ES| − |ES∩EG|)/|EG|
• edge precision:P =|ES∩EG|/|ES|
• edge recall:R=|ES∩EG|/|EG|
• F-score:F = 2(P∗R)/(P +R)
Additionally, we consider the Cumulative Fowlkes&Mallows (Cumulative F&M) measure
(Velardi et al., 2013): the valueBS,G between0.0
and1.0 which measures level by level how well a
target taxonomySclusters similar nodes compared
to a gold standard taxonomyG. BS,G is calculated
as follows: let k be the maximum depth of both
S and G, and Hij a cut of the hierarchy, where
i∈ {0, ..., k}is the cut level andj∈ {G, S}selects
the clustering of interest. Then, for each cut i, the
two hierarchies can be seen as two flat clusterings
CiSandCiGof thenconcepts. Wheni= 0the cut
is a single cluster incorporating all the objects, and
when i = k we obtain nsingleton clusters. Now
let: n11 be the number of object pairs that are in
the same cluster in both CiS andCiG; n00 be the
number of object pairs that are in different clusters
in both CiS andCiG; n10 be the number of object
pairs that are in the same cluster in CiS but not in
CiG; n01 be the number of object pairs that are in
the same cluster inCiGbut not inCiS.
The generalized Fowlkes&Mallows measure of
cluster similarity for the cut i (i ∈ {0, ..., k}), as
reformulated in (Wagner and Wagner, 2007), is de-fined as:
Bi
S,G= n
i
11 p
(ni
11+ni10)·(ni11+ni01)
. (1)
And the cumulative Fowlkes&Mallows Measure:
BS,G=
Pk−1
i=0 i+1k BiS,G
Pk−1
i=0 i+1k
= Pk−1
i=0 i+1k BiS,G k+1
2
. (2)
2.2.4 Manual quality assessments
The gold standard taxonomies are not complete, therefore it is possible for systems to identify cor-rect relations that are not covered by the gold stan-dard. Normally these relations are considered incor-rect using a simple comparison with the gold stan-dard taxonomy. For this reason we manually evalu-ate a subset of new relations proposed by each
sys-tem to estimate the number of relations in ES that
do not belong toEG. A random sample is extracted
from all the taxonomies submitted by the partici-pants and then manually annotated to compute the
precisionP as:|correctISA|/|sample|. A total of
100 term pairs were evaluated by three different an-notators for each system and each domain, for a total of 800 pairs per system.
a group of five annotators who have a background in Computational Linguistics, with the exception of one annotator who focused on the food domain. An-notators were provided with a list of term pairs or-ganised by domain and were asked if the relation was a correct ISA relation, if the relation and the terms were domain specific, and if the relation was too generic. In our evaluation, a relation is con-sidered correct only if it is a correct hypernym-hyponym relation, if it is relevant for the given do-main and not over-generic. Take for example the
following edges from the food domain: (linguine,
pasta) and (lemon, food). Both edges are correct ISA relations and are domain specific, but the sec-ond edge is over-generic because lemons are also fruits. The agreement for identifying correct edges is measured using the Fleiss kappa statistic and is overall substantial (Fleiss kappa 0.65). The easi-est domain is Food (Fleiss kappa 0.69), followed by Equipment (Fleiss kappa 0.63). Not surprisingly, the Science domain is the most challenging (Fleiss kappa 0.60), as this is a rapidly changing domain and there is in general less consensus about the rela-tions between fields.
3 Submitted runs
Overall, 6 teams participated in the task. Partici-pants were allowed to submit two runs for each of the four domains, one for each type of gold standard, for a total of 8 different runs. Most teams submit-ted a run for each domain and type of gold standard, with the exception of the LT3 team, which did not submit a system for the Chemical domain and the QASSIT team, which submitted only one run for the WordNet Chemical taxonomy. Next, we will pro-vide a short description of each approach in alpha-betical order, discussing corpora collection and the approaches adopted for relation discovery and tax-onomy construction.
INRIASAC (supervised) Corpus: Wikipedia
search using terms; Relation discovery: substring
inclusion, lexico-syntactic patterns, co-occurrence
information based on sentences and documents;
Tax-onomy construction:none.
LT3 (unsupervised) Corpus: web corpus con-structed using BootCat (Baroni and Bernardini,
2004) using the provided terms as seed terms;
Re-lation discovery: lexico-syntactic patterns, mor-phological structure of compound terms, WordNet
lookup (Lefever et al., 2014); Taxonomy
construc-tion:none.
ntnu (unsupervised) Corpus: Wikipedia and
WordNet definitions; Relation discovery:
hyper-nym extraction from definitions, WordNet lookup, Wikipedia categories, similarity between keywords;
Taxonomy construction: none.
QASIT (semi-supervised) Corpus: Wikipedia,
DBpedia; Relation discovery: lexico-syntactic
pat-terns, co-occurrence information; Taxonomy
con-struction: Learning Pretopological Spaces (LPS) method that learns a Parameterized Space by using an evolutionary strategy.
TALN-UPF (semi-supervised) Corpus:
Wikipedia definitions retrieved using BabelNet
(Navigli and Ponzetto, 2012); Relation discovery:
based on (Navigli and Velardi, 2010), CRF model trained with the WCL dataset, linguistic rules added to traverse the dependency tree, missing nodes
connected to root;Taxonomy construction:none.
USAAR (semi-supervised) Corpus: Wikipedia
documents; Relation discovery: lexico-syntactic
patterns, co-occurrence information used to con-struct a vector space model using the word2vec
tool;5Taxonomy construction:none.
4 Results
Table 2 presents the results of the structural anal-ysis (see Section 2.2.2) for all the system outputs and for the two baselines. Only 20 out of 45 sub-mitted taxonomies consist of one weakly connected component (c.c. = 1), and 18 out of 45 are di-rected acyclic graphs (Cycles=N). Overall, only 10 taxonomies comply with the ideal structural require-ments of a taxonomy and are directed acyclic graphs consisting of one connected component. 6 of these were submitted by the only system that addressed the taxonomy construction subtask, QASSIT. Table 3 shows the average edge precision, recall and F-score of the six systems compared to the baselines (see Sections 2.2.3 and 2.2.4). LT3 outperforms the other systems on all the measures. It is worth
not-ing that our strnot-ing-based baseline (B2) achieves the
Table 2: Structural analysis of the submitted taxonomies and of the baseline taxonomies, including the number of: nodes (|V|), edges (|E|), connected components (c.c.), and intermediate nodes (i.n.).
Combined gold standard taxonomies
INRIASAC LT3 ntnu QASSIT TALN-UPF USAAR B1 B2
Chemicals |V| 12432 n.a. 1114 n.a. 17584 13785 17584 10120
|E| 28444 1563 17606 30392 17583 12672
c.c. 293 116 1 302 1 991
Cycles Y N N Y N N
i.n. 5808 1052 34 13766 1 10117
Equipment |V| 520 260 251 610 612 337 612 248
|E| 1168 282 247 614 665 548 611 244
c.c. 6 10 35 1 1 28 1 17
Cycles N Y N N Y Y N N
i.n. 164 174 251 70 20 320 1 229
Food |V| 1518 819 834 1550 1549 1118 1549 636
|E| 4363 1632 1227 1560 1569 2692 1548 627
c.c. 2 6 27 1 1 23 1 47
Cycles Y N Y Y N Y N N
i.n. 397 159 810 72 18 1105 1 631
Science |V| 417 187 338 453 1280 355 452 232
|E| 1164 441 386 511 1623 952 451 214
c.c. 3 8 23 1 1 14 1 28
Cycles N Y N N Y Y N N
i.n. 151 88 329 80 422 261 1 207
WordNet gold standard taxonomies
INRIASAC LT3 ntnu QASSIT TALN-UPF USAAR B1 B2
Chemicals |V| 1913 n.a. 1475 1351 1347 1173 1351 820
|E| 4611 1855 1380 1451 3107 1350 808
c.c. 2 28 1 1 31 1 129
Cycles Y Y N Y Y N N
i.n. 1262 1272 56 63 920 1 819
Equipment |V| 468 462 1081 476 2574 354 475 232
|E| 1369 1452 1333 490 3370 547 474 188
c.c. 1 1 12 1 1 43 1 46
Cycles Y Y Y N Y Y N N
i.n. 371 142 1036 65 1025 339 1 213
Food |V| 1458 1471 1843 1487 1486 1200 1486 826 |E| 4238 6913 2760 1539 1548 3465 1485 812
c.c. 2 1 35 1 1 23 1 79
Cycles N Y Y N N Y N N
i.n. 478 374 1386 60 53 1189 1 813
Science |V| 366 370 524 371 370 307 370 217
|E| 1102 1573 681 436 393 892 369 174
c.c. 1 1 11 1 1 8 1 48
Cycles Y Y N N N Y N N
i.n. 135 114 505 74 25 255 1 208
highest precision, which leads to high F-score, sec-ond only to the best system. This is an indication that the test dataset can be improved by removing relations that do not require more sophisticated
ap-proaches. The first baseline (B1) is not competitive,
because the gold standard taxonomies are specifi-cally selected to have a rich, deep structure. A large number of novel relations produced by the USAAR system are too generic because they apply a simi-lar strategy. The results of the manual analysis of previously unknown edges are shown in the last line of Table 3. Again, LT3 and INRIASAC systems take the lead. The ntnu system discovers the largest
Table 3:Average Precision, Recall and F-score of ISA relationships across gold standards and Average Precision of novel relations based on human judgement.
Comparison against gold standards
INRIASAC LT3 ntnu QASSIT TALN-UPF USAAR B1 B2
Average Precision 0.1725 0.3612 0.1754 0.1564 0.0720 0.2015 0.0226 0.5432
Average Recall 0.4279 0.6307 0.2756 0.1589 0.1165 0.3139 0.0212 0.2413
Average F-score 0.2427 0.3886 0.2076 0.1575 0.0799 0.2377 0.0219 0.3326
Manual evaluation
Average Precision 0.4800 0.5967 0.4200 0.3533 0.2467 0.1017 -
-Table 4:Cumulative Fowlkes&Mallows measure for 45 system runs and for 16 baselines.
Combined gold standard taxonomies
INRIASAC LT3 ntnu QASSIT TALN-UPF USAAR B1 B2
Chemicals 0.2353 n.a 0.0009 n.a 0.2225 0.00001 0.2281 0.0 Equipment 0.4905 0.1137 0.0000 0.4881 0.4482 0.0000 0.3970 0.0012
Food 0.4522 0.2163 0.0076 0.3405 0.3267 0.0037 0.3162 0.0007
Science 0.4706 0.3303 0.0088 0.5232 0.2202 0.2249 0.4214 0.0108
WordNet gold standard taxonomies
Chemicals 0.0084 n.a 0.0719 0.3947 0.2787 0.2103 0.2683 0.0 Equipment 0.0700 0.6892 0.0935 0.3637 0.0901 0.0015 0.2969 0.0007 Food 0.4804 0.5899 0.2673 0.3153 0.3091 0.0036 0.2933 0.0022 Science 0.4153 0.5391 0.0158 0.2921 0.2126 0.1721 0.1963 0.0016
lead. This difference is explained by the fact that LT3 makes use of a WordNet lookup of hypernym-hyponym relations, which is similar to the method used to collect the WordNet gold standard. More detailed statistics and charts are available on the
task website6. Finally, in order to obtain an
over-all rank of the system outputs we first assigned a penalty score (from 1 to 6) for six cue aspects of the evaluation: presence of Cycles, Cumulative F&M measure, number of Intermediate Nodes, F-score from Gold Standard Evaluation, number of Submit-ted Domains and estimaSubmit-ted precision from Manual Evaluation. Then, the total number of penalty points was computed and, following the inverse order of the total penalty scores, we finally ranked the teams (see Table 5).
At the end of the evaluation it emerged that the INRIASAC team had outperformed the other teams in the production of taxonomies for the selected tar-get domains. Although the LT3 team achieved bet-ter performance for quantitative approaches (preci-sion, F-score, Cumulative F&M), it was penalised in the final ranking because the constructed
tax-6http://alt.qcri.org/semeval2015/task17/ index.php?id=evaluation
Table 5: Overall ranking of submitted systems: IN-RIASAC (INR), LT3, ntnu, QASSIT (QA), TALN-UPF (TA), USAAR (US).
INR LT3 ntnu QA TA US
Cycles 3 4 2 1 3 4
Cumulative F&M 2 1 6 3 4 5 Intermediate Nodes 2 5 3 6 4 1 Gold Standard Evaluation 2 1 4 5 6 3
Submitted Domains 1 3 1 2 1 1
Manual Evaluation 2 1 4 5 6 3
Total 12 15 20 22 24 17
Final Ranking 1 2 4 5 6 3
onomies were generally smaller than the taxonomies produced by INRIASAC, the LT3 team did not sub-mit a taxonomy for Chemicals, and they subsub-mitted a larger number of taxonomies with cycles.
5 Discussion
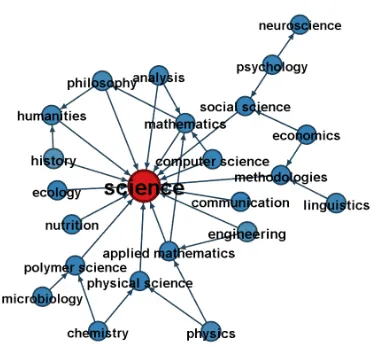
[image:7.612.152.462.222.335.2]solu-Figure 2:Intermediate nodes of the QASSIT
taxon-omy on Science. Figure 3:taxonomy on Science.Intermediate nodes of the gold standard
tion would be more appropriate when there was a larger number of systems. Most participants de-cided not to address the taxonomy construction sub-task, focusing mainly on relation discovery. This could be because the subtask is less well-known and more recently introduced, but also because exist-ing approaches for taxonomy construction are com-plex and difficult to reimplement. None of the sys-tems was able to address this subtask for the com-bined Chemicals taxonomy, which is the largest in our dataset. This points to the computational lim-its of existing algorithms for taxonomy construction. The choice of corpora shows a trend towards us-ing Wikipedia-based corpora instead of web-based corpora (Hovy et al., 2013). Only one participant team relied on web-based corpora. Another les-son that can be drawn from this shared task is that lexico-syntactic patterns, known to have high preci-sion but low recall, can benefit from co-occurrence based approaches, even if these tend to be less re-liable. A visualisation of the top levels of the tax-onomy constructed by the QASSIT system is pre-sented in Figure 2. The relative size of the nodes within a graph is proportional to the degree of the node. Compared to the gold standard taxonomy for the same domain presented in Figure 3, the QAS-SIT taxonomy connects a larger number of leaves directly to the Science root, introducing a large num-ber of over-generic relations. There are three times
more relations between intermediate nodes and the root node than in the gold standard taxonomy. The QASSIT hierarchy is more shallow than the gold standard, and contains a smaller number of interme-diate nodes.
6 Conclusion
[image:8.612.304.505.66.262.2] [image:8.612.89.276.90.264.2]Acknowledgements
This work was funded in part by a research grant from Science Foundation Ireland (SFI) under Grant Number SFI/12/RC/2289 (INSIGHT) and also by the MultiJEDI ERC Starting Grant No. 259234 (http://multijedi.org/).
References
Marco Baroni and Silvia Bernardini. 2004. Bootcat: Bootstrapping corpora and terms from the web. In4th Edition of Language Resources and Evaluation Con-ference (LREC2004).
Christiane Fellbaum. 2005. Wordnet and wordnets. In Keith Brown, editor, Encyclopedia of Language and Linguistics, pages 665–670, Oxford.
Tiziano Flati, Daniele Vannella, Tommaso Pasini, and Roberto Navigli. 2014. Two Is Bigger (and Better) Than One: the Wikipedia Bitaxonomy Project. In Pro-ceedings of the 52nd Annual Meeting of the Associa-tion for ComputaAssocia-tional Linguistics (ACL 2014), pages 945–955, Baltimore, Maryland.
Maayan Geffet and Ido Dagan. 2005. The distributional inclusion hypotheses and lexical entailment. In Pro-ceedings of the 43rd Annual Meeting on Association for Computational Linguistics, ACL ’05, pages 107– 114, Stroudsburg, PA, USA.
Sanda M. Harabagiu, Steven J. Maiorano, and Marius Pasca. 2003. Open-domain textual question an-swering techniques. Natural Language Engineering, 9(3):231–267.
Marti A. Hearst. 1992. Automatic acquisition of hy-ponyms from large text corpora. InIn Proceedings of the 14th International Conference on Computational Linguistics, pages 539–545.
Eduard H. Hovy, Roberto Navigli, and Simone Paolo Ponzetto. 2013. Collaboratively built semi-structured content and Artificial Intelligence: The story so far. Artificial Intelligence, 194:2–27.
Arthur B. Kahn. 1962. Topological sorting of large net-works. Commun. ACM, 5(11):558–562.
Zornitsa Kozareva and Eduard Hovy. 2010. A semi-supervised method to learn and construct taxonomies using the web. InProceedings of the 2010 Conference on Empirical Methods in Natural Language Process-ing, EMNLP ’10, pages 1110–1118, Stroudsburg, PA, USA.
Zornitsa Kozareva, Ellen Riloff, and Eduard H Hovy. 2008. Semantic class learning from the web with hy-ponym pattern linkage graphs. InProceedings of the 46th Annual Meeting of the Association for Computa-tional Linguistics, volume 8, pages 1048–1056. Cite-seer.
Els Lefever, Marjan Van de Kauter, and V´eronique Hoste. 2014. Hypoterm: Detection of hypernym relations between domain-specific terms in dutch and english. Terminology, 20(2):250–278.
Roberto Navigli and Simone Paolo Ponzetto. 2012. Ba-belNet: The automatic construction, evaluation and application of a wide-coverage multilingual semantic network. Artificial Intelligence, 193:217–250. Roberto Navigli and Paola Velardi. 2010. Learning
word-class lattices for definition and hypernym extrac-tion. In Proceedings of the 48th Annual Meeting of the Association for Computational Linguistics, pages 1318–1327, Uppsala, Sweden, July.
Roberto Navigli, Paola Velardi, and Stefano Faralli. 2011. A graph-based algorithm for inducing lexi-cal taxonomies from scratch. In Proceedings of the 22nd International Joint Conference on Artificial In-telligence, pages 1872–1877, Barcelona, Spain. Craig Nevill-Manning, Ian Witten, and Gordon W.
Payn-ter. 1999. Lexically-generated subject hierarchies for browsing large collections. International Journal on Digital Libraries, 2:111–123.
Mark Sanderson and Bruce Croft. 1999. Deriving con-cept hierarchies from text. In In Proceedings of the 22nd annual international ACM SIGIR conference on Research and Development in Information Retrieval, pages 206–213.
Robert Tarjan. 1972. Depth-first search and linear graph algorithms.SIAM Journal on Computing, 1:146–160. Paola Velardi, Roberto Navigli, Stefano Faralli, and Juana Maria Ruiz-Martinez. 2012. A new method for evaluating automatically learned terminological tax-onomies. In Proceedings of the Eight International Conference on Language Resources and Evaluation (LREC’12), Istanbul, Turkey.
Paola Velardi, Stefano Faralli, and Roberto Navigli. 2013. OntoLearn Reloaded: A Graph-Based Algo-rithm for Taxonomy Induction. Computational Lin-guistics, 39(3):665–707.
Silke Wagner and Dorothea Wagner. 2007. Comparing clusterings an overview. Technical Report 2006-04, Faculty of Informatics, Universit¨at Karlsruhe (TH). Zhichun Wang, Juanzi Li, and Jie Tang. 2013. Boosting