MÉRA Workshop Proceedings
Disclaimer
Although every effort has been made to ensure the accuracy of the material contained in this publication, complete accuracy cannot be guaranteed. Neither Met Éireann nor the author accept any responsibility what-soever for loss or damage occasioned or claimed to have been occasioned, in part or in full, as a consequence of any person acting, or refraining from acting, as a result of a matter contained in this publication. All or part of this publication may be reproduced without further permission, provided the source is acknowledged.
c
Met Éireann 2018
ISSN 1393-905X
Title:MÉRA Workshop Proceedings Editors:Emily Gleeson, Eoin Whelan
Authors: Julian Aherne, Hazel Cathcart, Laura Cooke, João Correia, Joan de Lacy, Frédéric Dias, Eadaoin Doddy, Jason Flanagan, Graham Florence, Sarah Gallagher, Edward Graham, Seánie Griffin, Jelena Jan-ji´c, Chris Kidd, Eoin Lettice, Frank McDermott, Owen Naughton, Paul Nolan, Conor Sweeney, Christopher Werner, Kayla Wilkins
Acknowledgements: We would like to thank all of the workshop delegates and presenters for their contri-butions. We would also like to thank Jevon Brennan-Keane and Laura Zubiate for their assistance with this workshop.
Contents
Towards a Definitive Historical High-Resolution Climate Dataset for Ireland . . . 5
High-Resolution Gridded Datasets of Hydroclimate Indices for Ireland . . . 9
Analysis of historical climate data for Ireland and its impact on Late Blight of potatoes . . . . 13
High spatio-temporal resolution dry deposition velocity mapping using the MÉRA dataset . . 18
Validation of MÉRA total precipitation at Stornoway (Scotland) with a 24 GHz Micro Rain Radar: A Preliminary Investigation . . . 25
Wind-solar correlations and wind ramping events in reanalysis datasets over Ireland . . . 29
Analysing Energy Demand and Weather in Ireland . . . 33
An evaluation of MÉRA’s representation of wind and solar variability associated with large-scale atmospheric pressure anomalies patterns . . . 37
Wind energy production backcasts based on a high-resolution reanalysis dataset . . . 41
Shortwave Radiation in Reanalyses: Skill Scores and Spatial Patterns . . . 46
Extreme Wave Events of Winter 2013/2014 off the West Coast of Ireland . . . 50
Photo: Sinéad Duffy
Weather observations are routinely used to analyse the past climate. Climate reanalyses may also be used for this purpose. These give a numerical description of the recent climate and are produced by combining models with weather observations. They contain estimates of atmospheric parameters such as air temperature, pressure and wind at different heights above the ground, and surface parameters such as precipitation, soil moisture content and temperatures, and sea-surface temperature. Because they are carried out using a fixed version of a forecast model and a data assimilation system which utilises historical observations, they produce parameters that are physically consistent and often not routinely observed. Thus, climate reanalyses have the potential to extend the knowledge gained from current observation networks.
Over the past few years researchers at Met Éireann have produced a climate reanalysis dataset, called MÉRA - Met Éireann Reanalysis, for the period 1981-2017 for an area covering Ireland, the UK and northern France. This dataset was launched in May 2017 and currently has over 100 users in Ireland, the U.K., Germany, the Netherlands, Canada and the U.S. On May 17th 2018 we held the first workshop for users of the data. The workshop consisted of 15 very interesting talks spread across sessions on climate applications, precipitation and hydrology, energy, waves and storms. Short papers on a number of these talks are included in this workshop proceedings.
Further scientific information on MÉRA can be found in the following publications:
Gleeson, E., Whelan, E., and Hanley, J.: Met Éireann high resolution reanalysis for Ireland, Adv. Sci. Res., 14, 49-61, https://doi.org/10.5194/asr-14-49-2017, 2017.
https://www.adv-sci-res.net/14/49/2017/asr-14-49-2017.pdf
Whelan, E., E. Gleeson, and J. Hanley: An evaluation of MÉRA, a high resolution mesoscale regional reanal-ysis. J. Appl. Meteor. Climatol.,57, 2179-2196, doi:10.1175/JAMC-D-17-0354.1, 2018.
https://journals.ametsoc.org/doi/abs/10.1175/JAMC-D-17-0354.1 For access to the data, please e-mail [email protected].
J. Flanagan, P.Nolan
5
Towards a Definitive Historical High-Resolution Climate
Dataset for Ireland
Jason Flanagan
1, Paul Nolan
11Irish Centre for High-End Computing
1
Introduction
There is a strong and constant demand from various sectors for long-term, high-resolution (both temporal and spatial), gridded climate datasets. In Ireland, such datasets have traditionally been based on station observations and are therefore subject to several shortcomings. For instance, there is a lack of representivity in regions with few observing stations whilst station data are prone to error and/or missing values. Reanalyses do not suffer from such drawbacks and represent a viable alternative to observations for the production of gridded datasets. In 2017, Met Éireann completed a 36-year simulation (MÉRA) at 2.5 km resolution for the period 1981-2016 (Gleeson et al, 2017; Whelan et al, 2018) using the shared ALADIN-HIRLAM numerical weather prediction system. The MÉRA dataset, which is stored as a series of 3-hour and 33-hour forecasts, have been archived by Met Éireann at 1-hour intervals. A full description of the available data and a selection of uncertainty estimates is given in Whelan et al. (2017) and Gleeson et al. (2017), respectively. Seperately, the Irish Centre for High-End Computing (ICHEC) has recently performed two high-resolution simulations of the Irish climate. The simulations were achieved with the Regional Climate Models COSMO-CLM5 and WRF v3.7.1 at maximum resolutions of 1.5 km and 2 km respectively. The datasets produced contain both hourly and daily outputs for an array of sub-surface, surface and atmospheric fields for the period 1981-2016. Although at lower spatial resolution than the ICHEC datasets, the MÉRA dataset has the distinct advantage of having been produced with the aid of a data assimilation component. Here, we present analyses that evaluate uncertainty estimates at various scales for several climate variables from the three model datasets and give example-appropriate skill scores. The validation results presented here form part of ongoing research aimed at the production of definitive, high-resolution, gridded Irish climate datasets for the period 1981-present.
2
Model Outputs
Several model outputs have been validated using station, gridded and satellite observations from a variety of sources. The climate variables tested include precipitation, 2 m temperature, 10 m wind speeds, relative humidity, mean sea level pressure and global irradiance.
Precipitation
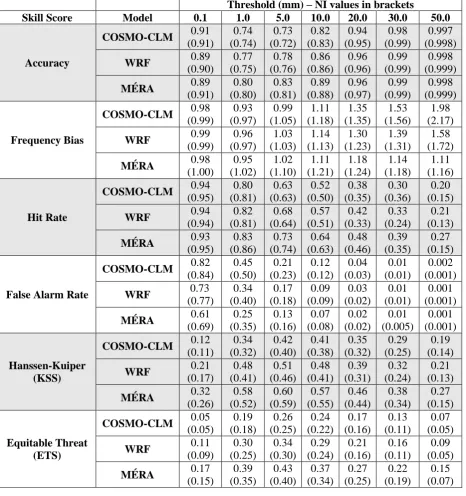
Gridded datasets of observed daily (09-09 UTC) accumulated precipitation at 1 km resolution that cover the Republic of Ireland (ROI) (Walsh, 2012) and Northern Ireland (NI) (Tanguy at al., 2016) for the period 1981-2015 have been obtained from Met Éireann and the Centre for Ecology and Hydrology in the UK. An area-averaging algorithm has been applied to transform the gridded observations to each of the three model grids and to facilitate the calculation of bias, mean absolute error (MAE) and standard deviation (STD) (Table 1) and various skill scores (Table 2). With the exception of NI bias, the MÉRA dataset displays least error and variance. Similarly, for the majority of skill scores and thresholds examined, MÉRA outperforms both WRF and COSMO-CLM.
J. Flanagan, P.Nolan
6
dataset) for each model were less than 0.01 mm whilst overall MAE and STD values were 0.177 mm, 0.176 mm, 0.155 mm and 0.326 mm, 0.327 mm, 0.294 mm for COSMO-CLM, WRF and MÉRA respectively.
Table 1: 24-hour rainfall accumulation (mm) uncertainty estimates found for each model through comparison with ROI and NI (values in parentheses) gridded observation datasets.
(mm) COSMO-CLM: ROI (NI) WRF: ROI (NI) MÉRA: ROI (NI)
Bias 0.182 (0.366) 0.238 (0.207) 0.094 (0.420)
MAE 4.067 (3.893) 3.241 (3.336) 2.602 (2.656)
STD 6.667 (6.317) 5.671 (5.664) 4.547 (4.493)
Table 2: A selection of 24-hour rainfall accumulation skill scores at various thresholds found for each model through comparison with ROI and NI (values in parentheses) gridded observations.
Threshold (mm) – NI values in brackets
Skill Score Model 0.1 1.0 5.0 10.0 20.0 30.0 50.0
Accuracy
COSMO-CLM 0.91
(0.91) 0.74 (0.74) 0.73 (0.72) 0.82 (0.83) 0.94 (0.95) 0.98 (0.99) 0.997 (0.998)
WRF 0.89
(0.90) 0.77 (0.75) 0.78 (0.76) 0.86 (0.86) 0.96 (0.96) 0.99 (0.99) 0.998 (0.999)
MÉRA 0.89
(0.91) 0.80 (0.80) 0.83 (0.81) 0.89 (0.88) 0.96 (0.97) 0.99 (0.99) 0.998 (0.999) Frequency Bias
COSMO-CLM 0.98
(0.99) 0.93 (0.97) 0.99 (1.05) 1.11 (1.18) 1.35 (1.35) 1.53 (1.56) 1.98 (2.17)
WRF 0.99
(0.99) 0.96 (0.97) 1.03 (1.03) 1.14 (1.13) 1.30 (1.23) 1.39 (1.31) 1.58 (1.72)
MÉRA 0.98
(1.00) 0.95 (1.02) 1.02 (1.10) 1.11 (1.21) 1.18 (1.24) 1.14 (1.18) 1.11 (1.16) Hit Rate
COSMO-CLM 0.94
(0.95) 0.80 (0.81) 0.63 (0.63) 0.52 (0.50) 0.38 (0.35) 0.30 (0.36) 0.20 (0.15)
WRF 0.94
(0.94) 0.82 (0.81) 0.68 (0.64) 0.57 (0.51) 0.42 (0.33) 0.33 (0.24) 0.21 (0.13)
MÉRA 0.93
(0.95) 0.83 (0.86) 0.73 (0.74) 0.64 (0.63) 0.48 (0.46) 0.39 (0.35) 0.27 (0.15)
False Alarm Rate
COSMO-CLM 0.82
(0.84) 0.45 (0.50) 0.21 (0.23) 0.12 (0.12) 0.04 (0.03) 0.01 (0.01) 0.002 (0.001)
WRF 0.73
(0.77) 0.34 (0.40) 0.17 (0.18) 0.09 (0.09) 0.03 (0.02) 0.01 (0.01) 0.001 (0.001)
MÉRA 0.61
(0.69) 0.25 (0.35) 0.13 (0.16) 0.07 (0.08) 0.02 (0.02) 0.01 (0.005) 0.001 (0.001) Hanssen-Kuiper (KSS)
COSMO-CLM 0.12
(0.11) 0.34 (0.32) 0.42 (0.40) 0.41 (0.38) 0.35 (0.32) 0.29 (0.25) 0.19 (0.14)
WRF 0.21
(0.17) 0.48 (0.41) 0.51 (0.46) 0.48 (0.41) 0.39 (0.31) 0.32 (0.24) 0.21 (0.13)
MÉRA 0.32
(0.26) 0.58 (0.52) 0.60 (0.59) 0.57 (0.55) 0.46 (0.44) 0.38 (0.34) 0.27 (0.15) Equitable Threat (ETS)
COSMO-CLM 0.05
(0.05) 0.19 (0.18) 0.26 (0.25) 0.24 (0.22) 0.17 (0.16) 0.13 (0.11) 0.07 (0.05)
WRF 0.11
(0.09) 0.30 (0.25) 0.34 (0.30) 0.29 (0.24) 0.21 (0.16) 0.16 (0.11) 0.09 (0.05)
MÉRA 0.17
[image:6.595.67.534.246.743.2]J. Flanagan, P.Nolan
7
2 m Temperature
A similar analysis of 2 m temperature (ROI only) has been performed at hourly and daily time-scales utilising Met Éireann synoptic station and gridded observations (Table 3).
As with precipitation, MÉRA is the better performer of the three. The skill scores shown in Table 2 have also been calculated for 2 m daily mean temperature (not shown) at 6 thresholds (-5, 0, 5, 10, 25 and 20°C). The results confirm the pattern seen in Table 3 with MÉRA showing greater skill for the majority of score and thresholds tested.
Table 3: Overall hourly and daily mean (in parentheses) 2m temperature (°C) uncertainty estimates found through comparison with Met Éireann synoptic station and (ROI only) gridded observations.
(°C) COSMO-CLM WRF MÉRA
Bias -0.18 (-0.36) -0.30 (-0.63) -0.11 (-0.38)
MAE 1.33 (1.19) 1.30 (1.18) 0.81 (0.89)
STD 1.19 (1.49) 1.33 (1.33) 0.91 (1.04)
10 m Winds
Hourly time series of 10 m wind speeds from 23 Met Éireann synoptic stations – winds are not measured at the Markree and Phoenix Park stations – have been compared to each of the 3 model outputs. The MÉRA dataset has lowest MAE and STD at 17 and 22 of the 23 stations, respectively. A summary (where all 23 station time series are treated as a single dataset) is given in Table 4.
Table 4: Overall hourly 10 m wind speed (m/s) uncertainty estimates for each model through comparison with 23 Met Éireann synoptic station time series.
(m/s) COSMO-CLM WRF MÉRA
Bias 0.85 0.07 0.29
MAE 1.89 1.67 1.27
STD 2.30 2.24 1.65
Relative Humidity
Hourly time series from 24 Met Éireann synoptic stations have been used to determine relative humidity uncertainty estimates (including percentage errors PE (and their standard deviations) and correlations). Data from Sherkin Island were excluded from this analysis due to the appearance of several multi-week periods of spurious measurements within the time series. MÉRA out-performs both COSMO-CLM and WRF at each station. Table 5 summarises the (overall) results found.
Table 5: Overall hourly relative humidity (%) uncertainty estimates (plus correlations) found through comparison with time series from 24 Met Éireann synoptic stations.
(%) COSMO-CLM WRF MÉRA
Bias (STD) -2.86 (5.85) 0.95 (6.61) -0.42 (3.59)
MAE (STD) 7.58 (3.53) 7.67 (3.93) 5.47 (2.19)
PE (STD) -2.75 (7.64) 2.16 (8.92) -0.04 (4.72)
| PE | (STD) 9.39 (4.94) 9.83 (6.08) 6.89 (3.33)
Correlation 0.66 0.57 0.80
Mean Sea Level Pressure
Mean sea level pressure uncertainty estimates and correlations have been determined for all 25 Met Éireann synoptic stations. The MÉRA dataset shows lowest MAE and STD and highest correlation at all stations (not shown). A summary of the results found is given in Table 6.
Table 6: As in Table 5 but for mean sea level pressure (hPa) at 25 Met Éireann synoptic stations.
(hPa) COSMO-CLM WRF MÉRA
Bias (STD) -0.87 (2.56) -0.20 (2.39) 0.03 (0.51)
MAE (STD) 1.96 (1.87) 1.69 (1.70) 0.37 (0.36)
J. Flanagan, P.Nolan
8
| PE | (STD) 0.19 (0.19) 0.17 (0.17) 0.04 (0.04)
Correlation 0.98 0.98 1
Global Irradiance
Both satellite and station data have been used to determine hourly, daily and annual average global irradiance (GI) uncertainty estimates. The average annual (1998-2011, only) and hourly (Oct. 2010 – Dec. 2015, only) satellite datasets were obtained from the Photovoltaic Geographical Information System (PVGIS) (Huld et al., 2012) and EUMETSAT, respectively, whilst the daily data were obtained from 18 Met Éireann stations. A summary of the results are given in Tables 7-9. At each timescale, MÉRA has the lowest error – the daily analysis has been performed for COSMO-CLM and MÉRA only.
Table 7: Hourly GI uncertainty estimates (kWh/m2) found through comparison with EUMETSAT 10/2010 – 12/2015 satellite data.
(kWh/m2) COSMO-CLM WRF MÉRA
Bias 0.008 0.079 -0.003
MAE 0.103 0.127 0.086
STD 0.094 0.113 0.088
Table 8: Overall daily GI uncertainty estimates (MJ/m2) found through comparison with observations from 18 Met Éireann stations.
(MJ/m2) COSMO-CLM MÉRA
Bias 0.167 0.122
MAE 0.809 0.589
STD 1.189 0.855
Table 9: Average annual GI uncertainty estimates (expressed as a percentage) found through comparison with PVGIS 1998-2011 satellite data.
(%) COSMO-CLM WRF MÉRA
Bias 2.83 29.17 -0.81
MAE 3.58 29.17 3.48
STD 3.47 4.76 4.46
3
References
Gleeson, E., Whelan, E., and Hanley, J.: Met Éireann high resolution reanalysis for Ireland, Adv. Sci. Res., 14, 49–61, doi:10.5194/asr-14-49-2017, 2017.
Huld T., Müller R. and Gambardella A.: "A new solar radiation database for estimating PV performance in Europe and Africa". Solar Energy, 86, 1803-1815, 2012.
Tanguy, M.; Dixon, H.; Prosdocimi, I.; Morris, D. G.; Keller, V. D. J.: Gridded estimates of daily and monthly areal rainfall for the United Kingdom (1890-2015) [CEH-GEAR]. NERC Environmental Information Data Centre. https://doi.org/10.5285/33604ea0-c238-4488-813d-0ad9ab7c51ca, 2016.
Walsh, S.: ‘A Summary of Climate Averages for Ireland 1981–2010’, [report], Met Éireann, 14,
Climatological Note, 14, 2012.
Whelan, E., E. Gleeson, and J. Hanley: An evaluation of MÉRA, a high resolution mesoscale regional reanalysis. J. Appl. Meteor. Climatol., In press, https://doi.org/10.1175/JAMC-D-17-0354.1, 2018.
C. Werner, P. Nolan, O. Naughton
9
High-Resolution Gridded Datasets of Hydroclimate Indices
for Ireland
Christopher Werner
1, Paul Nolan
1, Owen Naughton
21Irish Centre for High-End Computing 2Trinity College Dublin
1
Introduction
There is constant demand from industry, research and government agencies for high quality, long-term, gridded datasets of hydroclimatic variables for conducting climate research. These have applications in a wide variety of fields such as agriculture, hydrology, public health, energy, planning and studies in observed climate change trends and vulnerability. Variables such as evapotranspiration and soil moisture conditions are crucial in ensuring water sustainability, monitoring groundwater recharge, agronomic management and the management of flood and drought risk. Numerical weather prediction (NWP) models, can be used to reanalyse historic weather conditions and produce spatially and temporally homogeneous, multi-decadal gridded datasets. This article describes the application of three NWP models to produce the first gridded climate datasets of key hydroclimatic variables in Ireland, namely reference evapotranspiration, actual evapotranspiration and soil moisture deficits. The Met Éireann Re-Analysis (MÉRA) dataset (Gleeson et al, 2017; Whelan et al, 2018) has been used in this study, alongside the COSMO-CLM5 and WRF v3.7.1, which have been produced by researchers at the Irish Centre for High End Computing (ICHEC), and cover a period of 1981-mid 2018 for MÉRA, and up to 2017 for COSMO-CLM and WRF. MÉRA has a resolution of 2.5 km, whereas COSMO-CLM and WRF have higher resolutions of 1.5 km and 2 km respectively, but lack the data assimilation techniques used in MÉRA.
2
Methodology
Reference evapotranspiration (ET0) was calculated using the Penman Monteith equation, which is considered to be the international best practice. ET0 was calculated using variables from all three NWP datasets and interpolated to the 22 synoptic stations across Ireland. ET0 was calculated from weather observations. As each of the models had biases in the input variables, these had to be corrected. The timeseries for each location was split corresponding to months of the year, from which a least squared estimator could be applied to each month creating a line of best fit. The correction factors therein were then interpolated onto the corresponding model grids, to derive a definitive ET0 dataset for each model.
C. Werner, P. Nolan, O. Naughton
10
these datasets have been produced for daily, monthly, seasonal and annual timesteps, including averages and summed values where applicable.
3
Results
Reference Evapotranspiration (ET0)
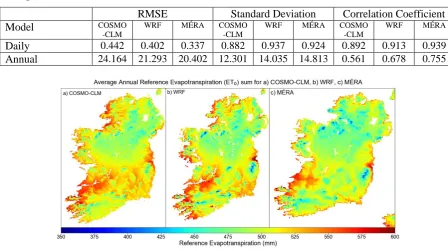
[image:10.595.70.519.320.571.2]Following the corrections, all models were found to perform with a high degree of accuracy and were in good agreement with ET0 values calculated from weather observations. Prior to validation, it was expected that MÉRA would outperform both WRF and COSMO-CLM datasets due to the advantage of data assimilation. COSMO-CLM and WRF were however expected to add value due to the higher spatial resolutions (1.5 km and 2 km, respectively) compared to MÉRA (2.5 km). Table 1 shows that MÉRA outperforms both the WRF and COSMO-CLM models for both root mean square error (RMSE) and correlation coefficients across all 22 synoptic stations, each of which has been validated. Figure 1 shows average annual sums of ET0 across the country for COSMO-CLM, WRF and MÉRA models.
Table 1:Errors in daily and yearly accumulated values of ET0 for 1981-2017using an overall weighted average across 22 stations.
RMSE Standard Deviation Correlation Coefficient
Model COSMO
-CLM
WRF MÉRA COSMO -CLM
WRF MÉRA COSMO -CLM
WRF MÉRA
Daily 0.442 0.402 0.337 0.882 0.937 0.924 0.892 0.913 0.939 Annual 24.164 21.293 20.402 12.301 14.035 14.813 0.561 0.678 0.755
Figure 1: Average Annual ET0 maps for COSMO-CLM, WRF (1981-2017) and MÉRA (1981-2016).
Actual Evapotranspiration (ETa)
C. Werner, P. Nolan, O. Naughton
11
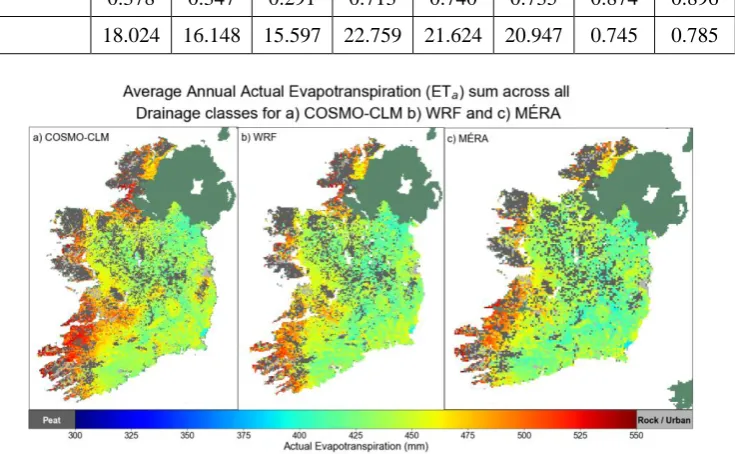
Table 2: Errors in daily and yearly accumulated values of ETa for well drained soils for 1981-2016 using an overall weighted average across 22 stations
RMSE Standard Deviation Correlation Coefficient
Model COSMO
-CLM
WRF MÉRA COSMO -CLM
WRF MÉRA COSMO -CLM
WRF MÉRA
Daily 0.378 0.347 0.291 0.713 0.740 0.735 0.874 0.896 0.927
[image:11.595.117.485.189.416.2]Annual 18.024 16.148 15.597 22.759 21.624 20.947 0.745 0.785 0.805
Figure 2: Average Annual indicative ETa maps for COSMO-CLM, WRF and MÉRA.
Soil Moisture Deficits
C. Werner, P. Nolan, O. Naughton
12
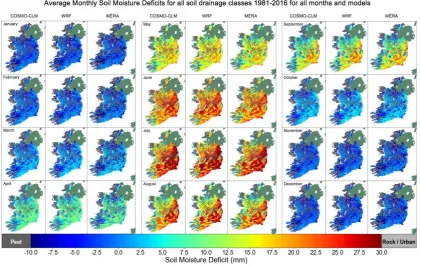
Figure 3: Mean Monthly SMD for all soil drainage classes using WRF, COSMO-CLM and MÉRA (1981- 2016)
4
Summary
High resolution gridded datasets of reference evapotranspiration (ET0), actual evapotranspiration (ETa) and soil moisture deficits (SMDs) have been produced using inputs from three NWP models. Reference evapotranspiration (ET0) was calculated using modelled data as input to the Penman Monteith equation, in line with international best practice, and the current ET0 calculation method used by Met Éireann and repeated for actual evapotranspiration (ETa) and soil moisture deficits (SMDs). The results have shown that all models performed well and have been able to capture hydrological variables to a high degree of accuracy. Datasets derived from MÉRA input variables proved to be the most accurate. These datasets will be available online so that they can be utilised by the general public, policy makers and researchers. Any queries can be directed to [email protected].
5
References
Gleeson, E., Whelan, E., and Hanley, J.: Met Éireann high resolution reanalysis for Ireland, Adv. Sci. Res., 14, 49–61, doi:10.5194/asr-14-49-2017, 2017.
[image:12.595.88.510.80.346.2]J. de Lacey, E. Lettice
13
Analysis of historical climate data for Ireland and its impact
on Late Blight of potatoes
Joan de Lacey
1, Eoin Lettice
2,3 1 BlightLink2 School of Biological, Earth and Environmental Sciences (BEES), University College Cork 3 Environmental Research Institute (ERI), University College Cork
1
Introduction
Late blight of potato is caused by the oomycete Phytophthora infestans and is a major pathogen of the Irish and European potato crop. Annual losses in the European Union have been estimated at more than €1 billion (Haverkort et al., 2008). The first objective of this research project is to analyse the relative humidity data of the MÉRA reanalysis dataset (Gleeson et al, 2017; Whelan et al, 2018). Relative humidity is of significance in plant health and physiology, occurrence of disease and hence agricultural economic yield. Comparison with historical meteorological data recorded at Irish weather stations will enable any bias in the MÉRA data set to be quantified. Other variables to be considered include temperature, total precipitation and the derived effective blight hours (EBH). The results will provide valuable historical information on potato late blight risk by location in Ireland. This project will build on the work of Bourke (1953) and Keane (1982) who published the average accumulated effective blight hours for the period 1957 to 1981 for Ireland. It will also supplement that of contemporary researchers Cucak et al. (2017) and Samala et al. (2017).
2
Previous analysis of effective blight hours
The Irish Rules as developed by Bourke (1953) have formed the basis of potato blight forecasting since the 1950s in Ireland and take into account the effect of temperature, relative humidity and the presence of precipitation during a defined period on the epidemiology of the blight causing pathogen
Phytophthora infestans. Met Éireann currently uses a revised version of Bourke’s ‘Irish Rules’ and synoptic weather maps to predict when blight-favourable conditions are due to arrive. Since the ‘Irish Rules’ original conception, the pathogen responsible for potato late blight has evolved in to new genotypes, become resistant to certain fungicides and is active at a greater temperature range. Researchers at Teagasc are currently conducting a research study to elucidate changes in the life cycle of the pathogen and to propose a revised blight model for Ireland (Cucak et al., 2017).
The value of an accurate blight model is that it should enable growers to move from a predominantly calendar based spraying schedule, to one where fungicides are used only where necessary in advance of a blight period. This is important from both an economic and environmental standpoint and meets the growing demand from national and EU legislation for growers to more fully adopt an integrated pest/pathogen management (IPM) approach (Lamichhane et al., 2016). However, reliance on a blight model has risks. The pathogen is incredibly virulent and once it is established it may result in significant loss of the potato crop. Organic farmers are particularly vulnerable to crop losses as shown in Finland in 2004 where no marketable yield of maincrop organic potatoes were harvested due to a late blight epidemic (Schepers & Spits, 2005).
J. de Lacey, E. Lettice
14
(EBH) by Keane (1982) and a preliminary study by de Lacey (2014).
Analysis of Keane (1982)
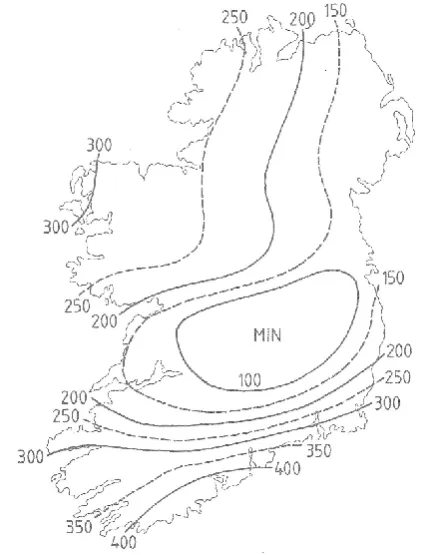
Keane (1982) through climatic analysis over a period of 25 years (1957 – 1981) found that some areas of Ireland consistently experienced high EBH with a low coefficient of variation. He made the case that in regions such as this regular spraying was advisable, whereas in areas of consistently low EBH spraying according to a warning system could be more economically beneficial. His analysis showed a clear north-south gradient in EBH accumulations with an increase in values near the coast. Minimum values were found in the south midlands and parts of the east of Ireland, where a 10-day cohort analysis across the blight season (May – Sep) showed year-on-year regular blight free periods when spraying to a calendar would be unnecessary. The analysis used 14 synoptic weather stations.
Figure 1: Average (1957-81) accumulations of effective blight hours, May to Sept. (Keane, 1982).
Keane estimated the cost of a routine 14-day spray schedule on Ireland’s 40,000 hectares of potatoes between May and September in 1982 at £2.8 million (£10 per hectare per application). Since 1982 the acreage of potatoes has reduced and according to Bord Bia it is now 12,000 ha maintained by 600 growers (https://www.bordbia.ie). De Wolf and van der Klooster (2006) estimate the average cost of late blight control chemicals at 370 €/ha, which would provide an estimate of €4.4 million in costs of control chemicals in Ireland. To put the problem of late blight into perspective, losses in the EU equate to €1 billion; a significant proportion of the farm gate price of €6 billion and consumer price of €15 billion (Haverkort, 2008).
Analysis of de Lacey (2014)
[image:14.595.185.401.226.504.2]J. de Lacey, E. Lettice
15
for Sherkin Island and DARD (the Department of Agriculture and Rural Development) for Belfast, where modified Smith infection periods are reported. The occurrence of the high levels of humidity at Sherkin Island would suggest that Sherkin Island and the surrounding area in west Cork were at a greater risk to infection by P. infestans even during 2010, a relatively dry year.
Figure 2: EBH for Sherkin Island vs. Met Éireann blight warning reports for 2010 (de Lacey, 2014).
Figure 3: EBH for Belfast vs DARD infection periods for 2010 (de Lacey, 2014).
J. de Lacey, E. Lettice
16
Figure 4: Sea fog intrusion, mainland adjacent to Sherkin Island, West Cork.
3
Planned analysis and applications
Our study aims to repeat the analysis of Keane (1982) using the MÉRA reanalysis data to extend Keane’s previous 25 year analysis of EBH (1957 – 1981), a further 35 years to 2016. Will we observe the same spatial distribution of EBH? What is the relationship between the individual variables of temperature, relative humidity, precipitation and EBH for different regions of Ireland? The results of our analysis of the MÉRA reanalysis dataset for blight risk will have implications not only for commercial growers but also help to inform backyard growers.
Zwankhuizen (1998) identified allotments as a minor source of blight for farmers. In 2009 a pandemic in the United States was caused by a single wholesale nursery distributing infected tomato transplants across the Northeast and mid-Atlantic regions of the United States (Fry et al., 2012). The synchronous release resulted in 13 states being infected with late blight. The driver was mainly a lack of knowledge regarding potato late blight, on the part of the plant nurseries and backyard growers. As a result of the analysis of the MÉRA data, information will be available to backyard growers regarding the historic risk of blight for their location. Backyard growers in areas of significant risk, who are growing organically, can be encouraged to adopt resistant cultivars to prevent the spread of blight to neighbouring farms. Scenario analysis by Pically et al. (2016) found that engagement of all stakeholders and a change in market demand to resistant potatoes, would result in a reduction in the severity of blight outbreaks.
A further application is that the knowledge gained from the analysis will help to inform the release of BlightLink (http://blightlink.com/) a mobile application, which provides hourly, location specific, forecast information regarding blight risk for growers. In areas where the variability of EBH is found to be consistently high, growers will be advised that the App will act only as a fore-warning of ensuing blight periods. In areas with low variability and low blight risk, BlightLink may act to reduce unnecessary sprays of fungicide, particularly when combined with the function of enabling users to report blight outbreaks, therefore providing additional information on blight pressure in an area. This is particularly important in the light of future erratic weather pattern predictions (Samala, 2017).
Observations of pests and pathogens have shown a movement towards the poles at a rate of 2.7 ± 0.8 km yr−1 since the 1960s (Bebber et al., 2013). Potato late blight has been highlighted as a potential threat to global food security, particularly when one considers the recent observations in Europe of more virulent genotypes, the global reliance on the potato crop (3rd largest crop), and the increase in acreage worldwide (https://www.teagasc.ie/crops/crops/potatoes). The analysis of the MÉRA reanalysis dataset may reveal the impact of climate change on the risk of late potato blight for Ireland, provide a benchmark for ongoing monitoring, and inform future adaptations to climate change.
Websites:
BlightLink – https://blightlink.com
Bord Bia website - https://www.bordbia.ie/consumer/aboutfood/veg/potatoes/pages/default.aspx/
J. de Lacey, E. Lettice
17
4
References
Bebber, D. P., Ramotowski, M. A. T. & Gurr, S. J. (2013). Crop pests and pathogens move polewards in a warming world. Nature Climate Change. DOI:10.1038/NCLIMATE19 90.
Bourke, A (1953). Potato blight and the weather: a fresh approach. Irish Meteorological Service.
Bourke, A and Lamb, H (1993). The spread of potato blight in Europe 1845-6 and the accompanying wind and weather patterns. Irish Meteorological Service.
Cucak, M., Sparks, A. H., Fealy, R., Griffin, D., Lambkin, K. and Kildea, S. (2017). The use of agrometeorological data for crop disease risk forecasting in Ireland: a case of potato late blight. Dept. of Geography, National University of Ireland Maynooth. Teagasc. (EMS2017-428).
de Lacey, J. (2014). A decision support system for the control of Phytophthora infestans in West Cork. MSc Thesis, School of Biological, Earth and Environmental Sciences, University College Cork.
De Wolf M, and van de Klooster A (2006). Kwanitatieve Informatie Akkerbouw en Vollegrondsgroenteteelt. KWIN AGV, (http://www.ppo.wur.nl/NL/publicaties/), PPO 354.
Fry, W. E., McGrath, M. T., Seaman, A., Zitter, T. A., McLeod, A., Danies, G., Small, I., Myers, K., Everts, K., Gevens, A., Gugino, B. K., Johnson, S., Judelson, H., Ristaino, J., Roberts, P., Secor, G., Seebold, K., Snover-Clift, K., Wyenandt, A., Grunwald, N. J. and Smart, C. D. (2012). The 2009 Late blight pandemic in Eastern USA. APS Features. doi:10,1094/APSFeature-2012-08.
Gleeson, E., Whelan, E., and Hanley, J.: Met Éireann high resolution reanalysis for Ireland, Adv. Sci. Res., 14, 49–61, doi:10.5194/asr-14-49-2017, 2017.
Haverkort, A. J., Boonekamp, P. M., Hutten, R., Jacabsen, E., Lotz, L. A. P., Kessel, G. J. T., Visser, R. G. F. and van der Vossen, E. A. G. (2008). Societal costs of late blight in potato and prospects of durable resistance through cisgenic modification. Potato Research 51:47-57.
Iglesias, I, Escuredo, O and Seijo, C. (2009). Phytophthora infestans prediction for a Potato Crop.
Am. J. Pot. Res. 87, 32 – 40.
Keane, T (1982). Weather and potato blight.Irish Meteorological Service.
Lamichhane, J.R., Dachbrodt-Saaydeh, S., Kudsk, P., Messean, A. (2016). Toward a reduced reliance on conventional pesticides in European agriculture. Plant Disease 100: 10-24.
Pically, F. C. A., Groot, J. C, Hofstede, G. J., Schaap, B. F. and Lammerts van Bueren, E. T. (2016). Analysing potato late blight control as a social-ecological system using fuzzy cognitive mapping. Agron. Sustain. Dev. 36: 35.
Samala, B. K., McKinstry, A. and Nolan, P. (2017). The impact of Climate on potato crop in Ireland: A case study. Irish Centre for High End Computing. (EMS2017-667).
Schepers, H. T. A. M. and Spits, H. G. (2005).
The development and control of Phytophthora in-festans in Europe in 2004- 2005. Ninth Workshop of a European Network for development of an Inte-grated Control Strategy of potato late blight, Tallinn, Estonia. PPO-Special Report no. 11:11-12.Whelan, E., E. Gleeson, and J. Hanley: An evaluation of MÉRA, a high resolution mesoscale regional reanalysis. J. Appl. Meteor. Climatol., In press, https://doi.org/10.1175/JAMC-D-17-0354.1, 2018.
K. Wilkins, H. Cathcart, J. Aherne
18
High spatio-temporal resolution dry deposition velocity
mapping using the MÉRA dataset
Kayla Wilkins
1, Hazel Cathcart
1, Julian Aherne
11 Trent University
1
Introduction
There is a growing concern that atmospheric emissions of gaseous nitrogen (N) compounds, such as ammonia, from the agricultural industry, are negatively impacting plant biodiversity in natural ecosystems in Ireland (Henry & Aherne, 2014; Stevens et al., 2011; Wilkins & Aherne, 2016; Wilkins et al., 2016). Atmospheric emissions ultimately return to the Earth’s surface via deposition, either in rainfall (wet deposition) or by dry fallout (dry deposition). Globally, elevated N deposition has been demonstrated to have a negative impact on plant species diversity (Bobbink et al., 2010; Roth, et al., 2015; Wallis de Vries et al., 2017), suggesting that N deposition may directly impact national commitments under the Habitats Directive (European Commission, 2015). The National Emission Ceilings Directive (NEC Directive) has recently required all member states to establish a network of ecosystem sites to evaluate the impact of air pollutants on natural or semi-natural ecosystems (EEA, 2016a); national ammonia emissions are perhaps of most concern in this respect.
Effectively evaluating the impact of air pollutants, including ammonia, on natural ecosystems requires accurate estimates of wet and dry atmospheric deposition. In Ireland, wet N deposition is widely monitored; Met Éireann has actively monitored precipitation since the late 1950s at a number of monitoring stations (Tierney, 1967; Mathews & McCaffrey, 1977). There are currently five stations monitoring wet deposition (Belmullet, Johnstown Castle, Malin Head, Oak Park, and Valentia Observatory). However, dry N deposition is not easily measured, and is generally estimated from the product of air concentration and deposition velocity (i.e. the rate at which gases or particles are transferred to a given surface, Vd). Air concentrations of certain pollutants (including ammonia) have been measured in Ireland (e.g., de Kluizenaar & Farrell, 2000), whereas estimates of Vd have been taken from generalised landscape-based literature values (Henry & Aherne, 2014; Wilkins & Aherne, 2016; Wilkins et al., 2016), which vary considerably for ammonia (Schrader & Brümmer, 2014). High resolution maps of Vd would greatly improve estimates of dry and total deposition, in particular for nitrogen species.
The processes that contribute to the Vd of a gas or particle onto a given surface, particularly a heterogeneous surface, are complex, and influenced by the characteristics of the particle type, the qualities (e.g., roughness) of the receptor surface, and the micro-climate at the site of deposition (Hicks et al., 2016; Petroff et al., 2008; Pryor et al., 2008; Wesely & Hicks, 2000). Deposition velocity can be inferred from eddy correlation measurements; however, this method has a number of challenges (Businger, 1986; Finkelstein & Sims, 2001; Pryor et al., 2008). There is a reliance on computer modelling to estimate Vd. The ‘Big Leaf’ model developed by Zhang and others (Petroff &
Zhang, 2010; Zhang & He, 2014; Zhang et al., 2001; Zhang et al., 2003) has been shown to perform well compared to Vd measurements (Szinyei et al., 2018; Zhang et al., 2001; Zhang et al., 2002), and has been widely applied (Adon et al., 2013; de Vos & Zhang, 2012; Flechard et al., 2011; Yu et al., 2013). This model does, however, require a number of meteorological input variables (Table 1), previously unavailable at high-spatial resolution on a national scale. The publication of Met Éireann’s climate re-analysis dataset, MÉRA, (Gleeson et al., 2017; Whelan et al, 2018) has made mapping of Vd
K. Wilkins, H. Cathcart, J. Aherne
19
Here we demonstrate how the recently published MÉRA climatological dataset can be used to estimate
Vd for 31 gaseous species, including ammonia, and three particulate size classes, leading to high spatial resolution national maps. In combination with observations of the atmospheric concentration of gases and particles, these velocities can be used to generate national dry deposition maps for atmospheric pollutants.
2
Methods
The Vd model requires hourly inputs for nine climatic variables (Table 1), the landcover (for 26 landcover types) and location (latitude) where the climatic variables were observed or estimated. Climatic input data for the model were predominantly sourced from Met Éireann’s climate reanalysis project (Gleeson et al., 2017). Climate reanalysis data are available from 1981 to mid-2018 at a 2.5 km resolution for Ireland produced using the ALADIN-HIRLAM numerical weather prediction system (www.hirlam.org). In the current study, the Vd model was run at three-hour intervals for each 2.5 km grid point across Ireland for the period June 2013 to July 2014, which coincided with the operation of a national ammonia monitoring network (Doyle et al., 2017). The Big Leaf model requires proportional area data for 26 landcover classes, which were calculated for each 2.5 km grid using landcover data extracted from the CORINE 2012 map (1:250 000) (EEA, 2016b). Snowfall was assumed to be zero; cloud fraction was set to 1 (100% cover) as the MÉRA data were unavailable at the time of the study. However, model results were not sensitive to cloud cover under the climate conditions typical to Ireland.
Table 1: Inputs required by the ‘Big Leaf’ dry deposition velocity model and their data sources
PARAMETER SOURCE
Temperature at 2 m MÉRA
Surface temperature MÉRA
Precipitation rate MÉRA
Windspeed at 10 m MÉRA
Surface pressure MÉRA
Humidity MÉRA
Solar irradiance MÉRA
Cloud fraction Set to 1
Snow depth Assumed to be zero
Landcover CORINE 2012
3
Results and discussion
K. Wilkins, H. Cathcart, J. Aherne
20
It is important to note that the national average annual Vd values do not represent site-specific Vd
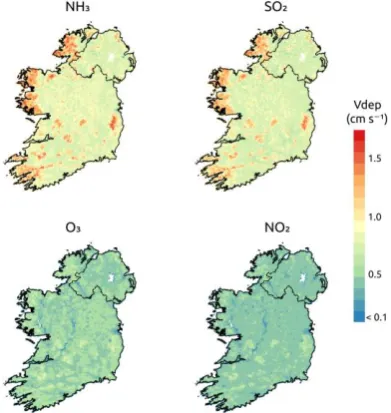
[image:20.595.202.398.444.651.2]because average values summarise all landcover classes across the country and are influenced by the proportion of grasslands in Ireland. It is also crucial to recognise that areas of high dry Vd do not necessarily correspond to areas of high dry deposition; it is possible to have regions that experience high dry Vd but low pollutant air concentrations, resulting in low dry deposition.
Table 2: Summary statistics for annual ammonia (NH3), sulphur dioxide (SO2), ozone (O3), and nitrogen dioxide (NO2) dry deposition velocity (cm s –1) for Ireland during the period June 2013 to
July 2014
NH3 NO2 O3 SO2
Mean 0.808 0.348 0.399 0.758
Median 0.737 0.354 0.403 0.691
Minimum 0.073 0.023 0.028 0.069
Maximum 1.698 0.711 0.837 1.608
Standard deviation 0.186 0.084 0.098 0.177
The 3-hourly modelled Vd shows high temporal variability. For example during the first week of July 2013 in Glendalough National Park, Wicklow (located in an area of high annual average Vd, see Figure 1), Vd ranged from less than 0.5 cm s−1 to nearly 2.5 cm s−1 (Figure 3). The lowest Vd values were observed on July 3, and coincided with a calm period with low east–west and north–south windspeeds in the MÉRA dataset. In addition, landscape-based Vd values exhibit a similar range for different habitat types (e.g. 0.5 cm s−1 for grasslands versus 2.5 cm s−1 for deciduous woodlands), highlighting the importance of site-specific and time-specific Vd estimates.
K. Wilkins, H. Cathcart, J. Aherne
[image:21.595.236.356.122.245.2]21
Figure 2: Elevated dry deposition velocity (Vd) response to westerly winds on June 2, 2013 at 03 00 UTC.
Figure 3: Modelled dry deposition velocity (cm s–1) for ammonia (NH3), sulphur dioxide (SO2), ozone (O3), and nitrogen dioxide (NO2) at Glendalough National Park in Wicklow, Ireland during the first
week of July 2013.
4
Conclusions
MÉRA data were used to model dry deposition velocities for 31 gaseous species and 3 particulate matter size classes on a 2.5 km grid across Ireland at 3,408 3-hourly intervals for one annual cycle. The resulting series of dry deposition velocity maps demonstrated the influence of meteorology and land cover on the seasonal deposition velocities for gaseous and particulate species.
[image:21.595.164.426.300.504.2]K. Wilkins, H. Cathcart, J. Aherne
22
5
References
Adon, M., Galy-Lacaux, C., Delon, C., Yoboue, V., Solmon, F., & Kaptue Tchuente, A. T. (2013). Dry deposition of nitrogen compounds (NO2, HNO3, NH3), sulfur dioxide and ozone in west and central African ecosystems using the inferential method. Atmospheric Chemistry and Physics, 13(22), 11351–11374. https://doi.org/10.5194/acp-13-11351-2013
Bobbink, R., Hicks, K., Galloway, J., Spranger, T., Alkemade, R., Ashmore, M., … de Vries, W. (2010). Global assessment of nitrogen deposition effects on terrestrial plant diversity: a synthesis. Ecological Applications, 20(1), 30–59.
Businger, J. A. (1986). Evaluation of the accuracy with which dry deposition can be measured with current micrometeorological techniques. Journal of Climate and Applied Meteorology, 25(8), 1100– 1124.
DAFM – Department of Agriculture, Food, and the Marine. (2010). Food harvest 2020: A vision for Irish agri-food and fisheries.
URL: http://www.agriculture.gov.ie/foodwise2025/foodharvest2020/. Accessed 27.02.2017.
de Kluizenaar, Y., Farrell, E.P. (2000). Ammonia Monitoring in Ireland. Environmental Protection Agency, Wexford, Ireland.
de Vos, T., & Zhang, L. (2012). High resolution mapping of total deposition of acidifying pollutants. Atmospheric Environment, 57(Supplement C), 80–90. https://doi.org/10.101
Doyle, B., Cummins, T., Augustenborg, C., & Aherne, J. (2017). Ambient Atmospheric Ammonia in Ireland, 2013-2014 (EPA Research Report No. 193). Wexford, Ireland: Environmental Protection Agency. Retrieved from
http://www.epa.ie/pubs/reports/research/air/EPA%20RR%20193%20Essentra%20web%20(1).pdf
European Commission. (2015). The Habitats Directive: about the Habitats Directive. URL: http://ec.europa.eu/environment/nature/legislation/habitatsdirective/. Accessed 01.07.18.
EEA − European Environment Agency, European Union. (2016a). National Emission Ceilings Directive. URL: https://www.eea.europa.eu/themes/air/national-emission-ceilings. Accessed 01.07.18.
EEA – European Environment Agency, European Union. (2016b). Corine Land Cover 1:250,000 vector data. URL: https://land.copernicus.eu/pan-european/corine-land-cover/clc-2012. Accessed 22.03.17.
Finkelstein, P. L., & Sims, P. F. (2001). Sampling error in eddy correlation flux measurements. Journal of Geophysical Research: Atmospheres, 106(D4), 3503–3509. https://doi.org/10.1029/2000JD900731
Flechard, C. R., Nemitz, E., Smith, R. I., Fowler, D., Vermeulen, A. T., Bleeker, A., … Sutton, M. A. (2011). Dry deposition of reactive nitrogen to European ecosystems: a comparison of inferential models across the NitroEurope network. Atmospheric Chemistry and Physics, 11(6), 2703–2728. https://doi.org/10.5194/acp-11-2703-2011
K. Wilkins, H. Cathcart, J. Aherne
23
Henry, J., & Aherne, J. (2014). Nitrogen deposition and exceedance of critical loads for nutrient nitrogen in Irish grasslands. Science of The Total Environment, 470–471, 216–223. https://doi.org/10.1016/j.scitotenv.2013.09.047
Hicks, B. B., Saylor, R. D., & Baker, B. D. (2016). Dry deposition of particles to canopies—A look back and the road forward. Journal of Geophysical Research: Atmospheres, 121(24), 2015JD024742. https://doi.org/10.1002/2015JD024742
Mathews, R.O. and Mccaffrey, F. (1997). Chemical Analysis of Precipitation in Ireland 1966-1975.
Petroff, A., & Zhang, L. (2010). Development and validation of a size-resolved particle dry deposition scheme for application in aerosol transport models. Geoscientific Model Development, 3(2), 753–769. https://doi.org/10.5194/gmd-3-753-2010
Petroff, A., Mailliat, A., Amielh, M., & Anselmet, F. (2008). Aerosol dry deposition on vegetative canopies. Part I: Review of present knowledge. Atmospheric Environment, 42(16), 3625–3653. https://doi.org/10.1016/j.atmosenv.2007.09.043
Pryor, S. C., Gallagher, M., Sievering, H., Larsen, S. E., Barthelmie, R. J., Birsan, F., … Vesala, T. (2008). A review of measurement and modelling results of particle atmosphere–surface exchange. Tellus B, 60(1), 42–75. https://doi.org/10.1111/j.1600-0889.2007.00298.x
Roth, T., Kohli, L., Rihm, B., Amrhein, V., & Achermann, B. (2015). Nitrogen deposition and multi-dimensional plant diversity at the landscape scale. Royal Society Open Science, 2(4), 150017. https://doi.org/10.1098/rsos.150017
Schrader, F., & Brümmer, C. (2014). Land Use Specific Ammonia Deposition Velocities: a Review of Recent Studies (2004–2013). Water, Air, & Soil Pollution, 225(10), 1–12. https://doi.org/10.1007/s11270-014-2114-7
Stevens, C., Duprè, C., Gaudnik, C., Dorland, E., Dise, N., Gowing, D., … Diekmann, M. (2011). Changes in species composition of European acid grasslands observed along a gradient of nitrogen deposition. Journal of Vegetation Science, 22(2), 207–215. https://doi.org/10.1111/j.1654-1103.2010.01254.x
Szinyei, D., Gelybó, G., Guenther, A. B., Turnipseed, A. A., Tóth, E., & Builtjes, P. J. H. (2018). Evaluation of ozone deposition models over a subalpine forest in Niwot Ridge, Colorado. Időjárás, 122(2), 119–143. https://doi.org/10.28974/idojaras.2018.2.2
Tierney, S.L. (1967). Atmospheric Chemistry in The Irish Meteorological Service and a Discussion of Some Results. Technical Note No. 32, Meteorological Service, Department of Transport and Power, Dublin, September 1967.
Wallis de Vries, M. F., & Bobbink, R. (2017). Nitrogen deposition impacts on biodiversity in terrestrial ecosystems: Mechanisms and perspectives for restoration. Biological Conservation, 212, 387–389. https://doi.org/10.1016/j.biocon.2017.01.017
Wesely, M. L., & Hicks, B. B. (2000). A review of the current status of knowledge on dry deposition. Atmospheric Environment, 34(12–14), 2261–2282. https://doi.org/10.1016/S1352-2310(99)00467-7
K. Wilkins, H. Cathcart, J. Aherne
24
Wilkins, K., & Aherne, J. (2016). Vegetation community change in Atlantic oak woodlands along a nitrogen deposition gradient. Environmental Pollution, 216, 115–124. https://doi.org/10.1016/j.envpol.2016.05.024
Wilkins, K., Aherne, J., & Bleasdale, A. (2016). Vegetation community change points suggest that critical loads of nutrient nitrogen may be too high. Atmospheric Environment, 146, 324–331. https://doi.org/10.1016/j.atmosenv.2016.07.016
Yu, X., Driscoll, C. T., Huang, J., Holsen, T. M., & Blackwell, B. D. (2013). Modeling and Mapping of Atmospheric Mercury Deposition in Adirondack Park, New York. PLoS ONE, 8(3), e59322. https://doi.org/10.1371/journal.pone.0059322
6/j.atmosenv.2012.04.037
Zhang, L., Brook, J. R., & Vet, R. (2003). A revised parameterization for gaseous dry deposition in air-quality models. Atmospheric Chemistry and Physics, 3(6), 2067–2082.
Zhang, L., & He, Z. (2014). Technical Note: An empirical algorithm estimating dry deposition velocity of fine, coarse and giant particles. Atmospheric Chemistry and Physics, 14(7), 3729–3737. https://doi.org/10.5194/acp-14-3729-2014
Zhang, L., Gong, S., Padro, J., & Barrie, L. (2001). A size-segregated particle dry deposition scheme for an atmospheric aerosol module. Atmospheric Environment, 35(3), 549–560. https://doi.org/10.1016/S1352-2310(00)00326-5
Zhang, L., Moran, M. D., Makar, P. A., Brook, J. R., & Gong, S. (2002). Modelling gaseous dry deposition in AURAMS: a unified regional air-quality modelling system. Atmospheric Environment, 36(3), 537–560. https://doi.org/10.1016/S1352-2310(01)00447-2
E. Graham, C. Kidd and G. Florence
Validation of MÉRA total precipitation at Stornoway (Scotland) with
a 24 GHz Micro Rain Radar: A Preliminary Investigation
Edward Graham1, Chris Kidd1, and Graham Florence1
1University of the Highlands and Islands
1 Introduction
A 24 GHz METEK Micro Rain Radar (MRR) has been in operation at the University of the Highlands and Islands, Lews Castle, Stornoway (Hebrides, Scotland) since 2015 (see Figure 1). Located at58◦N in one of the
most frequently rained-upon regions of Britain (with an annual average of ~280 raindays per year), Stornoway lies fully exposed to all weather systems approaching from the North Atlantic Ocean. Similar to western Ireland, there is a very high correlation between the North Atlantic Oscillation (NAO) Index and monthly precipitation anomalies.
This part of north-western Scotland has already seen increases in the order 40% in winter precipitation over the past 40 years (Barnett et al., 2006, Graham 2012). Such gains in precipitation were not expected until the latter half of the 21stcentury according to climate change model scenarios for the region (Jenkins et al., 2008),
and are significantly greater than the expected response of the Clausius-Clapeyron saturation vapour pressure relationship to a modest surface temperature warming of 0.5◦C over the same 40 year period. Therefore,
careful and accurate monitoring of precipitation in this sensitive climatic region is paramount for detection and attribution of the manifestations of climate change.
This short paper presents the results of a preliminary investigation into how a combination of the Stornoway Lews Castle MRR and nearby ground-based rain gauges may be used to validate the high resolution MÉRA total precipitation dataset (Glesson et al., 2017; Whelan et al., 2018) for the Stornoway and NW Scotland region. At least four rain gauges are available in close proximity for the ground truthing of the MRR, conventional Met Office radar and reanalysis data. The MRR measures echo reflectivity (dBZ), fall velocity (m/s) and Doppler velocity (m/s) with a derived precipitation rate (mm/h) based on estimated droplet size spectra distributions.
2 The Stornoway Micro Rain Radar (MRR)
The principal motivation behind the installation and operation of the Stornoway MRR is the NASA Global Precipitation Mission (Hou et al., 2014), Stornoway being a key mid-latitude site in the calibration of space-based estimates of rainfall detection and intensity. The Stornoway MRR operates continuously in Frequency Modulation (FM) mode at 24 GHz, with a saw tooth signal sending a vertical pulse of radiation, which is back-scattered (reflected) by hydrometeors (snow, hail, sleet, rain) and possibly aerosols. The vertical resolution of reflection can be adjusted to between 30-100 m, with a maximum vertical height penetration of 3.1 km. Data are averaged over time bins of one minute, meaning the MRR has a spatial and temporal resolution of up to one magnitude greater than traditional meteorological radars. As the wavelength of the radiation (~1.3 cm) is greater than the droplet size, than amount of back scatter is proportional to the 6th power of the droplet
radius. Furthermore, since freezing heights above Stornoway often lie close to the surface, and are rarely above
E. Graham, C. Kidd and G. Florence
Figure 1: The 24 GHz METEK Micro Rain Radar (MRR) installed at the University of the Highlands and Islands, Stornoway, Scotland.
Table 1: MÉRA, MRR and local rain gauges accumulated precipitation totals for 30 June 2015
Observation Total (mm)
MÉRA Stornoway (single point only): 6.9
MÉRA whole island (max) 20.5
Micro Rain Radar (MRR) 20.0
Rain gauge No. 1 18.4
Rain gauge No. 2 18.6
Rain gauge No. 1 19.0
3000m, the bright band (~freezing altitude) is easily detected from the resulting Fall Velocity and Doppler shift measurements.
3 Case Study: MRR, MÉRA and UK Met Office radar for 30 June 2015
The Stornoway MRR was installed on 15 June 2015, and a comparison between its data, that of MÉRA, the UK Met Office’s Plan Position Radar (PPI) product (Met Office, 2003) and three local rain gauges was attempted for the date of 30 June 2015, as a preliminary study. There was no shortage of rain during summer 2015 in Stornoway (as it was one of the wettest and dullest summers of the past two centuries!). The results of this initial comparison are listed in Table 1, as well as shown in accommpanying Figures 2 and 3.
From Table 1, it can be seen that the MRR total accumulated precipitation for 30 June 2015 was 20.0 mm. The equivalent local rain gauge values were 19.0 mm, 18.6 mm and 18.4 mm, respectively. These slightly lower rain gauge totals are easily accounted for by wind loss or splashing, which is expected to be common at the exposed location of Stornoway. The equivalent Met Office PPI radar total for grid pixels surrounding Stornoway are in the range 15-20 mm.
E. Graham, C. Kidd and G. Florence
Figure 2: Height versus time plots of the Stornoway MRR on 30 June 2015 for as follows; Top panel: Fall Velocity (m/s); Middle Panel: Precipitation Intensity (mm/h; Bottom panel: Raw radar relfectivity (dBZ).
Figure 3: MÉRA total 3-hourly accumlated precipitation from 1800 UTC to 2100 UTC on 30 June 2015.
[image:27.595.169.431.384.648.2]E. Graham, C. Kidd and G. Florence
4 Summary and Conclusions
It is clear that significant precipitation changes are currently afoot in northwestern Scotland. The Stornoway MRR, in combination with MÉRA offer new research opportunities towards the study and analysis of these changes. Whilst the agreement found for the case study of 30 June 2015 is very promising, it is clear in this case that a longer time series of data are needed for a comprehensive climatological analysis and for valida-tion of MÉRA with the MRR and other ground observavalida-tions. Precipitavalida-tion is largely a stochastic mesoscale phenomenon, and it would therefore be interesting to see if direct assimilation of this very high resolution radar data product into meteorological models might be possible and advantageous, or if it may continue to pose complications, such as previously with GPS/GNSS high resolution precipitable water vapour fields (e.g. Guerova et al., 2003).
5 Acknowledgments
The authors would like to thank Emily Gleeson (Met Éireann) and Eoin Whelan (Met Éireann), NASA, and the University of the Highlands and Islands (Scotland) Research and Conference Travel Fund. Some of the ground rain gauge data was provided by the Scottish Environmental Protection Agency (SEPA). The UK Met Office Radar data are kindly provided by the Nimrod System. NCAS British Atmospheric Data Centre.
6 References
Barnett C., J.Hossell, M.Perry, C.Procter and G.Hughes, G, A handbook of climate trends across Scotland. In SNIFFER project CC03, Scotland and Northern Ireland Forum for Environmental Research, 62, 2006.
Gleeson, E., Whelan, E., and Hanley, J.: Met ÃL’ireann high resolution reanalysis for Ireland, Adv. Sci. Res., 14, 49-61, doi:10.5194/asr-14-49-2017, 2017.
Graham, E., Climate Changes in the Hebrides, Stornoway Gazette, 2012.
Guerova, G., E. Brockmann, J. Quiby, F. Schubiger and C.H. Matzler, Validation of NWP mesoscale models with Swiss GPS network AGNES. Journal of Applied Meteorology, 42(1), 2003
Hou A.Y., R.K. Kakar, S. Neeck, A.A. Azarbarzin, C.D. Kummerow, M. Kojima, R. Oki, K. Nakamura and T. Iguchi, The Global Precipitation Measurement Mission, Bulletin of the American Meteorological Society, 95(5), 2014.
Jenkins G.J., M.C. Perry and M.J. Prior, The climate of the United Kingdom and recent trends. Met Office Hadley Centre, Exeter, UK, 2008.
Met Office, 1 km Resolution UK Composite Rainfall Data from the Met Office Nimrod System. NCAS British Atmospheric Data Centre, 2003.
Whelan, E., E. Gleeson, and J. Hanley: An evaluation of MÃL’RA, a high resolution mesoscale regional reanalysis. J. Appl. Meteor. Climatol., In press, https://doi.org/10.1175/JAMC-D-17-0354.1, 2018.
S. Griffin, C. Sweeney, F. McDermott
Wind-solar correlations and wind ramping events in reanalysis
datasets over Ireland
Seánie Griffin1, Conor Sweeney1, and Frank McDermott1
1University College Dublin
1 Introduction
This study examines some uses of reanalysis datasets for analysing aspects of weather which are relevant for renewable energy in Ireland. Firstly, the skill of MÉRA (Glesson et al., 2017; Whelan et al., 2018) at representing observed daily mean 10 m wind speed is compared to two global reanalyses (ERA-Interim and MERRA-2).Combining wind and solar power production has the potential to reduce the overall variability of renewable energy generation. The statistical relationship between daily mean 10 m wind speed and daily total global shortwave radiation (SW) is analysed using Pearson’s correlation coefficient. The correlation values calculated using reanalysis data are compared to observed values. Temporal variability of wind speeds has a large impact on wind power production. The ability of the respective reanalyses to replicate observed wind speed variability is investigated. This analysis is performed for different time periods (1-hour, 3-hour and 12-hour ramping).
All analysis is performed across a common validation period of 1982-2007 and the nearest grid point in each reanalysis is used to compare to observations.
2 Results
10 m Wind Speed
The accuracy of the 10 m wind speed is assessed using skill scores such as: mean error (ME), root mean square error (RMSE) and anomaly correlation coefficient (ACC). This analysis is performed for each of the three reanalyses.
The ME and RMSE for daily mean 10 m wind speed at seven Irish synoptic stations are presented in Figure 1. A positive bias is generally apparent at inland stations in MÉRA and at all stations for the global reanalyses (ERA-Interim and MERRA-2). MÉRA generally performs the best; it has the lowest ME and RMSE at five of the seven stations studied. MÉRA also has the best ACC scores at all seven stations (not shown). A large negative bias is apparent at Malin Head for MÉRA. Meanwhile large positive biases exist in ERA-Interim for Dublin and Valentia. These are most likely attributed to land/sea discrepancies.
Wind-Solar Correlation
Monthly wind-solar correlation values for each dataset are shown in Figure 2. These are averaged across the same seven stations shown in Figure 1. The correlation values calculated using reanalysis data tend to be further
S. Griffin, C. Sweeney, F. McDermott
Belmullet Birr Clones Dublin Kilkenny Malin Valentia
−2 −1 0 1 2 3 4
Wi
nd
Sp
ee
d e
rro
r (
m/
s)
Overall Reanalysis 10m wind speed skill scores
MÉRA ERA-Interim MERRA2
Figure 1: Skill scores (ME (bars) and RMSE (dots)) for daily mean 10 m wind speed at each station for MÉRA (red), ERA-Interim (green) and MERRA-2 (blue).
from zero than observations, indicating that they tend to overestimate the strength of the inverse relationship between wind speed and shortwave radiation. MERRA-2 moves closer to observations in the second half of the year (Fig. 2), but in general none of the reanalyses outperform the rest when considering all of the stations. This overestimation may need to be considered if reanalysis data are used to assess a site for combined wind and solar power generation.
Jan Feb Mar Apr May Jun Jul Aug Sept Oct Nov Dec −0.5
−0.4 −0.3 −0.2 −0.1
0.0
10m wind speed vs SW: All stations
ObservationsMÉRA ERA-InterimMERRA2
Figure 2: Monthly Pearson’s correlation values between daily mean 10 m wind speed and daily total SW averaged for all seven stations. Observations (black), MÉRA (red), ERA-Interim (green) and MERRA-2 (blue)
S. Griffin, C. Sweeney, F. McDermott
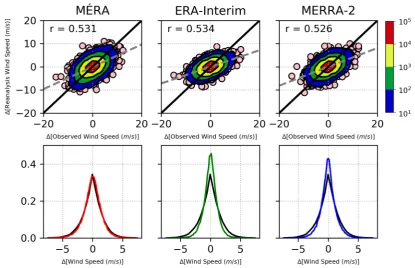
Figure 3: Ramping of 10 m wind speed over 3 hours at Kilkenny for MÉRA (left column), ERA-Interim (centre) and MERRA-2 (right column). The top row are contoured scatter plots of reanalysis ramps vs observed ramps, with best-fit line (dashed grey). The bottom row are histograms of 3 hour wind ramps for MÉRA(red), ERA-Interim (green), MERRA-2 (blue) and observations (black).
10 m Wind Speed Ramping
Temporal changes in wind power over a certain time horizon are referred to as wind ramping events. In this study, ramping of 10 m wind speed is examined at the seven synoptic stations shown in Figure 1. The results for 3 hour ramping at Kilkenny are presented in Figure 3 and Table 1. This is the shortest time period where all three reanalyses can be compared (ERA-Interim data are only available at 3-hourly resolution). In terms of point verification, all three reanalyses appear to struggle to match specific ramping events present in observations. This is indicated by the slope of best-fit lines being different from unity and low Pearson correlation (r) values in the scatter plots in Figure 3. These were similar to previous findings in Cannon et al. 2015.
The histograms in Figure 3 are used to assess the ability of the reanalyses to replicate the observed climato-logical distribution of wind ramping. MÉRA agrees best with the observations. Both global reanalyses tend to over predict small changes in wind speed and do not produce enough large ramp events. This is also illustrated when analysing the statistics shown in Table 1. The standard deviation and5thand95thpercentiles of MÉRA
are closer to the observed values than the two global reanalyses. The poor performance of global reanalyses for ramping over short time periods was also found in (Cradden et al. 2017) for the MERRA-2 reanalysis.
When the analysis is repeated for hourly ramping events, comparing MÉRA and MERRA-2, similar results are found. The MÉRA histogram again agrees best with the observations, with MERRA-2 exhibiting a thin-tailed distribution which underestimates extreme ramps. For studying wind ramping, MÉRA appears to add the greatest value when examining the climatology of ramping events over short time periods (e.g.≤6hours).
S. Griffin, C. Sweeney, F. McDermott
Table 1: The standard deviation (σ2),5th(P05) and95th(P95) percentiles of 3 hour ramping events of 10 m
wind speed at Kilkenny.
Observations MÉRA ERA-Interim MERRA-2
σ2 1.691 1.538 1.141 1.314
P05 -2.572 -2.533 -1.90 -2.091
P95 2.572 2.395 1.813 2.178
3 Summary
• MÉRA performs best for 10 m wind speed at the majority of stations.
• All reanalyses tend to overestimate the strength of the inverse relationship between 10 m wind speed and shortwave radiation.
• MÉRA outperforms global reanalyses at capturing the temporal variability of 10 m wind speed over shorter time periods.
4 References
Cannon, D. J., D. J. Brayshaw, J. Methven, P. J. Coker, and D. Lenaghan: Using reanalysis data to quantify extreme wind power generation statistics: A 33 year case study in Great Britain. Renewable Energy 75: 767-778, 2015.
Cradden, Lucy C., Frank McDermott, Laura Zubiate, Conor Sweeney, and Mark O’Malley: A 34-year sim-ulation of wind generation potential for Ireland and the impact of large-scale atmospheric pressure patterns. Renewable energy 106: 165-176, 2017.
Gleeson, E., Whelan, E., and Hanley, J.: Met Éireann high resolution reanalysis for Ireland, Adv. Sci. Res., 14, 49-61, doi:10.5194/asr-14-49-2017, 2017.
Whelan, E., E. Gleeson, and J. Hanley: An evaluation of MÉRA, a high resolution mesoscale regional reanal-ysis. J. Appl. Meteor. Climatol., In press, https://doi.org/10.1175/JAMC-D-17-0354.1, 2018.
L. Cooke, C. Sweeney
Analysing Energy Demand and Weather in Ireland
Laura Cooke1and Conor Sweeney1 1University College Dublin
1 Introduction
The renewable energy sector in Ireland continues to grow as we strive towards reduced emissions targets. However, due to the irregular nature of weather, the sector faces challenges in producing enough energy when demand is high, or curtailing energy production when demand is low. Understanding the relationship between weather and energy demand is an important step towards improving the balance between power supply and demand at these key times. The purpose of this study is to introduce a model that can be used to investigate the relationship between the variability of energy demand and weather in Ireland.
2 All Ireland Electricity Demand Profile
All Ireland daily electricity demand data from January 2011 to December 2016 was obtained from the Single Energy Market Operator (SEMO). Figure 1 (left) shows this total demand profile, which can be broken into its low frequency and high frequency components. The low frequency component can be described as the combination of an annual trend and seasonal trend. Demand changes on an annual basis due to a variety of factors including climatic differences, Gross Domestic Product (GDP), electricity prices, technology evolution and societal changes. Seasonal variability of demand is driven by the cyclic changes in temperature and daylight hours throughout the year. The high frequency component of demand is driven by weather changes, day of the week and public holidays. Typically less electricity is consumed on weekends and public holidays.
Following Cradden and McDermott (2018) the low frequency component of demand can be represented by a second order Fourier Seriesyfitted to the daily demand data January 2011 - December 2016:
y=y+a1cos(ωt) +b1sin(ωt) +a2cos(2ωt) +b2sin(2ωt),
where ω = 3652π, y is a rolling 365-day mean and a1, b1, a2, b2 are Fourier coefficients. This Fourier fit is
shown in Figure 1 (left). Subtracting the Fourier fit,y, from the total demand profile gives the high frequency
component of demand, see in Figure 1 (right). This will be referred to as the residual demand and used to study the weather-driven component of the electricity demand.
3 Extreme Demand Profiles
The upper 90th percentile (≥ 90%) and lower 10th percentile (≤ 10%) of residual demand are used here to represent high and low extreme residual demand events respectively. The yearly and monthly profiles of extreme residual demand events (not shown) highlight the influence of public holidays on demand with a large