Proceedings of NAACL-HLT 2015, pages 71–75,
A Web Application for Automated Dialect Analysis
Sravana Reddy Neukom Institute Dartmouth College
Hanover, NH.
James N. Stanford
Linguistics and Cognitive Science Dartmouth College
Hanover, NH.
Abstract
Sociolinguists are regularly faced with the task of measuring phonetic features from speech, which involves manually transcribing audio recordings – a major bottleneck to an-alyzing large collections of data. We harness automatic speech recognition to build an on-line end-to-end web application where users upload untranscribed speech collections and receive formant measurements of the vow-els in their data. We demonstrate this tool by using it to automatically analyze President Barack Obama’s vowel pronunciations.
1 Introduction
There has been recent interest in technologies for the automated analysis of web-scale corpora in sociolin-guistics, the study of language usage and variation in society. The subfield of sociophonetics is concerned with how certain speech sounds are manifested, giv-ing rise to distinctive speech accents. While there have been computational tools developed for socio-phoeticians in the last few years, they require that the speech is manually transcribed at the word level, which is painstaking for large corpora.
Our insight is that, for many types of record-ings, transcriptions produced by current automatic speech recognition (ASR) systems are not signifi-cantly worse than manual transcriptions for the pur-pose of measuring certain key phonetic character-istics of speakers, such as their vowel formants – which are essential to dialect research.
We have created an open-access website, DARLA
(short for Dartmouth Linguistic Automation)1,
where linguists and other researchers working on speech dialects can upload their data, and receive automatic transcriptions of the recordings as well as measurements of the speakers’ vowels. We envision this tool being used by linguists for a first-pass quali-tative study of dialect features in speech data without the effort of manual transcription.
We choose to implement the system online rather than as a downloadable toolkit to eliminate the over-head of program installation for users. Furthermore, since this is an ongoing project, it is seamless to in-corporate new features in a web application rather than pushing updates to a desktop program. DARLA currently supports English speech.
Details about our methods as well as studies using sociolinguistic data appear in Reddy and Stanford (2015). In this paper, we focus on describing the interface and an overview of the system components.
2 Background
2.1 Vowel Formants
Every vowel sound is associated with a set of reso-nance frequencies, or formants, characteristic to the vowel as well as the speaker. Sociophoneticians typ-ically study how the first two formants of stressed vowels, denoted by F1 and F2, systematically
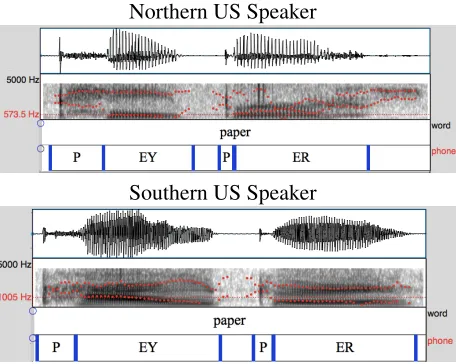
dif-fer across speakers of the language. For example, as shown in Fig. 1, a speaker saying the vowelEY2(the
first vowel inpaper) with a Southern accent would
1http://darla.dartmouth.edu
2We use the standard CMU Arpabet phoneme set
(http://www.speech.cs.cmu.edu/cgi-bin/cmudict)
have a higherF1 and lowerF2 than a Northern US
[image:2.612.74.302.172.354.2]speaker for the same vowel.
Figure 1: Words and phonemes aligned to speech (represented by its waveform and frequency spec-trogram, visualized in Praat). The vowel formants are the dark ‘bands’, or local frequency peaks.
Northern US Speaker
Southern US Speaker
2.2 Motivation
We observe that the stressed vowel error rate of our automatic speech recognition system is about a third of the word error rate for several different test cor-pora. Unlike typical applications of ASR like dicta-tion or command-and-control systems where accu-rate word recognition is the primary objective, per-fect transcription accuracy is not always necessary. For many sociophonetic purposes, it is sufficient to get the vowel correct. Errors likedependin place of
spend that retain the identity of the stressed vowel account for many of the word errors. Furthermore, with the opportunity to easily analyze speech con-taining several examples of each vowel type, a few errors will make little difference to the overall di-alect analysis.
3 Existing Work
DARLA is inspired by two online tools used by the phonetics and sociolinguistics communities:
1. FAVE (Rosenfelder et al., 2011), short for Forced Alignment Vowel Extraction, takes as input a speech file along with word-level manual transcrip-tions. It performs Viterbi alignment of the phonemes in the transcription to the speech using HMM-based
acoustic models. The locations of vowels are iden-tified from the alignment, and the vowel formants measured at the appropriate locations using Linear Predictive Coding, which in turn is computed by the Praat toolkit for phonetics (Boersma and Weenink, 2014).
Other programs for phoneme alignment include the ProsodyLab Aligner (Gorman et al., 2011) and WebMAUS (Kisler et al., 2012). Recently, Winkel-mann and Raess (2014) developed a web tool for spectral analysis and visualization of speech.
The key difference between our system and prior work is that we do not require any transcriptions for the input speech.
2. The NORM suite for vowel normalization and plotting (Thomas and Kendall, 2007) lets users up-load formant measurements, and generates scatter-plots of the first two formants.
4 System Description
4.1 Input
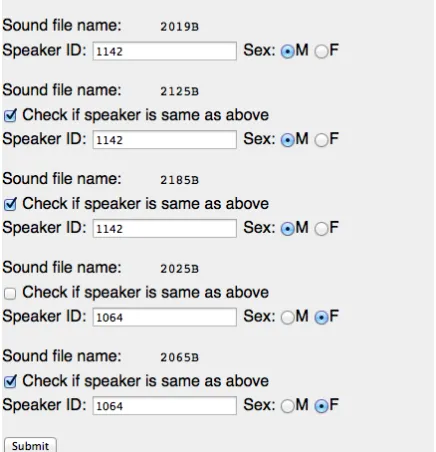
Fig. 2 is a screenshot of the interface, which is im-plemented in HTML and Javascript, and connected to the server through CGI and Ajax. Users upload their speech data and can optionally select param-eters for the ASR decoder. The options consist of a dialect-specific acoustic model, and the type of speech: free speech or dictation, for which we use a high language model scaling factor, or lists of words – commonly used in sociophonetic research – for which a lower scaling factor is appropriate. Once the upload is complete, users are prompted to en-ter a speaker ID and sex for each file (Fig. 3), used as parameters for formant extraction. The inputs are validated and sanitized on the client and server sides.
4.2 Back-End Computation
The system currently contains an HMM-based speech recognizer built using the CMU Sphinx toolkit3, with acoustic and language models that we
trained on a variety of American English speech corpora (broadcast news and telephone conversa-tions). We currently have one dialect-specific acous-tic model for Southern speech, trained on portions of the Switchboard corpus (Godfrey and Holliman,
Figure 2: Input interface for the completely automated vowel extraction system.
Figure 3: Speaker information prompt. 1993). The feature representation uses 13 MFCCs,deltas, and delta-deltas sampled every 10ms. Long audio files are split into smaller segments, and down-sampled to 16 kHz (or 8 kHz if the orig-inal sampling rate is below 16 kHz). We use Pock-etSphinx for decoding, and HTK to force-align the output transcriptions to produce phoneme-to-audio alignments. The system then converts the align-ments to TextGrid format4, and uses the formant
ex-traction portion of the FAVE code5 to measure the
formant values for all the vowel tokens in the tran-scriptions. The processing is distributed over eight CPUs so simultaneous jobs can be supported.
Since the transcriptions are likely to contain er-rors, we filter out low-confidence vowel tokens based on the acoustic likelihood of the word contain-ing that token under the acoustic model. Previous work on identifying potential errors in the transcrip-tion suggests using models of duratranscrip-tion in additranscrip-tion to acoustic features (Das et al., 2010), which we plan
4Conversion was facilitated by the Python TextGrid library
available at http://github.com/kylebgorman/textgrid.py
to incorporate. We also filter out function words, un-stressed vowel tokens, and tokens with high formant bandwidths (indicating that the formant values may not be reliable). Finally, we generate scatter plots of the mean values of the first two formants for each vowel type using the R vowels package6.
4.3 Output
The results are e-mailed to the user once the task is completed. The e-mail includes scatter plots of the first two vowel formants for each speaker, and the complete raw formant data in a CSV file which is adapted from the output of FAVE. This file con-tains the raw formant measurements of every vowel, including the unfiltered tokens, the formant band-widths, the phonetic contexts, adjacent words, and other relevant information.
Phonetic contexts are particularly important since many vowel shift patterns are context-dependent. We separate the phonetic contexts into place, man-ner, and voicing features – for example, the sound
P would be represented as {place: bilabial, man-ner: stop, and voicing: unvoiced}. Probabilities are computed under the acoustic model for each of these features. This allows researchers to discard low-probability contexts, or incorporate the probabilities as a gradient measure of the phonetic environment.
The e-mail also includes the filtered formant mea-surements formatted in a tab-separated file for input to the NORM plotting suite in case the user wants more plotting options, and the aligned ASR tran-scriptions as TextGrid files, which can be opened by Praat and visualized as in Fig. 1. The user can then check the transcriptions and alignments, make cor-rections as needed, and re-run the formant extraction step using FAVE for more accurate vowel measure-ments if desired.
5 Case Study: Obama’s State of the Union
We ran the audio of US President Barack Obama’s 2015 State of the Union address7 through our
sys-tem. The audio of the address is reasonably clean, but the speech is sometimes interrupted by clap-ping sounds and background noise. The record-ing is a just over an hour long, and contains6793
6http://cran.r-project.org/web/packages/vowels
7The speech and transcripts are taken from
http://www.americanrhetoric.com/barackobamaspeeches.htm
words according to the manual transcript. The de-coding, alignment, and formant extraction pipeline takes about90minutes to complete.
The ASR transcriptions show a 42% word error rate, and a total stressed vowel error rate of13%. Of the filtered tokens, the stressed vowel error rate is even better at 9%.
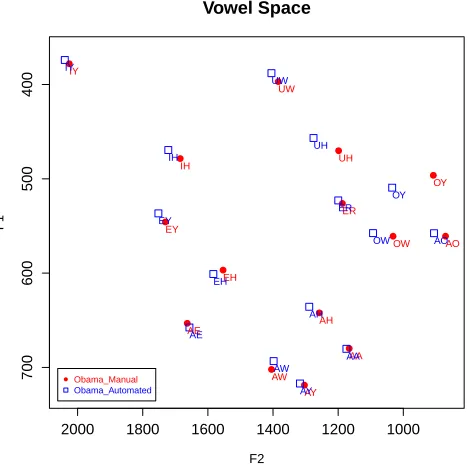
[image:4.612.318.552.354.587.2]The mean formants from the ASR transcriptions are similar to the formants extracted from the man-ual text (Fig. 4). The largest discrepancies are in vowels likeOYwhich occur less frequently.
Figure 4: Plot of formants averaged over filtered to-kens of stressed vowels. This plot shows Obama’s vowels as exhibited in the 2015 State of the Union, analyzed using ASR as well as manual transcriptions for comparison. This is the scatterplot that the user receives in the e-mailed output (except that the man-ual transcription results will not be included).
● ● ● ● ● ● ● ● ● ● ● ● ● ● ●
2000 1800 1600 1400 1200 1000
700 600 500 400 Vowel Space F2 F1 ●Obama_Manual Obama_Automated IY AY EH AA IH UW AO AH OW EY AE ER OY AW UH EH AY AA IH IY UW AO AH OW EY AE UH ER AW OY
and Chicago, and perhaps also a politician’s ten-dency to appeal to a wider audience: in this case, a general northern US audience.
The results in Fig. 4 indicate that Obama has a mix of conservative Northern US vowels with some Midland and Southern influences, based on soci-olinguistic dialect descriptions (Labov et al., 2006; Labov, 2007; Eckert, 2008).
(1) In this data, Obama does not show an ad-vanced stage of the Northern Cities Vowel Chain Shift (NCS) prevalent in Chicago. The F1 of
Obama’sAEvowel is lower than average, which is a prevalent pattern in Chicago, but also in other re-gions of the US.
(2) He shows clear evidence of “fronting” (high
F2) of the vowelsUW (boot) and UH (hood). This
pattern is common in the West and other regions, and is spreading to the North.
(3) His AOand AAvowels are distinct, which is common for Chicago and the Inland North and the South, but interestingly, not the West and Hawai’i.
(4) Finally, hisAW(bout) is somewhat fronted – a feature of the Midland and South.
We also analyzed Obama’s previous State of the Union addresses and found that his vowels have re-mained remarkably stable since 2011.
6 Future Work
Since our system is an ongoing project, we will be rolling out several new features in the upcom-ing months. We are developupcom-ing an interface to al-low users to make corrections to the speech recog-nition transcriptions (with low-confidence regions highlighted), and receive updated formant measure-ments. In the longer term, we hope to expand be-yond vowel formants by developing phonetic fea-ture classifiers for other dialect variables such as rhoticity, nasality, and prosody. Finally, since the speech recognizer is the most vital component of the system, we are working on improving the ASR error rate by incorporating state-of-the-art technolo-gies that use deep neural nets.
Acknowledgments
We would like to thank Irene Feng for programming assistance, and the developers of FAVE and NORM for permission to use their formant measurement and
plotting code. We are grateful for the feedback re-ceived from the sociolinguistics community at the NWAV conference and during pilot testing of the application. The first author was supported by a Neukom Fellowship, and further development of the tool is being supported by a Neukom CompX grant.
References
Paul Boersma and David Weenink. 2014. Praat: doing phonetics by computer [computer program]. Available at http://www.praat.org/.
Rajarshi Das, Jonathan Izak, Jiahong Yuan, and Mark Liberman. 2010. Forced alignment under adverse conditions. Unpublished manuscript.
Penelope Eckert. 2008. Where do ethnolects stop? In-ternational Journal of Bilingualism, 12:25–42. John Godfrey and Edward Holliman. 1993.
Switchboard-1 Release 2 LDC97S62. Linguistic Data Consortium, Philadelphia.
Kyle Gorman, Jonathan Howell, and Michael Wagner. 2011. Prosodylab-aligner: A tool for forced alignment of laboratory speech. Canadian Acoustics, 39(3):192– 93.
Thomas Kisler, Florian Schiel, and Han Sloetjes. 2012. Signal processing via web services: the use case Web-MAUS. InProceedings of Digital Humanities. William Labov, Sharon Ash, and Charles Boberg. 2006.
The Atlas of North American English (ANAE). Mou-ton, Berlin.
William Labov. 1991. Sociolinguistic patterns. Univer-sity of Pennsylvania Press, Philadelphia.
William Labov. 2007. Transmission and diffusion. Lan-guage, 83(2):344–387.
Sravana Reddy and James N. Stanford. 2015. Toward completely automated vowel extraction: Introducing DARLA. Manuscript. Under review at Linguistics Vanguard.
Ingrid Rosenfelder, Josef Fruehwald, Keelan Evanini, Scott Seyfarth, Kyle Gorman, Hilary Prichard, and Jiahong Yuan. 2011. FAVE (Forced Align-ment and Vowel Extraction) Program Suite v1.2 doi:10.5281/zenodo.12325. Available at http://fave.ling.upenn.edu.
Erik Thomas and Tyler Kendall. 2007. NORM: The vowel normalization and plot-ting suite [online resource]. Available at http://ncslaap.lib.ncsu.edu/tools/norm/.