Investigating Active Learning for Short-Answer Scoring
Andrea Horbach
Dept. of Computational Linguistics Saarland University
Saarbr¨ucken, Germany
Alexis Palmer Leibniz ScienceCampus, Dept. of Computational Linguistics
Heidelberg University Heidelberg, Germany
Abstract
Active learning has been shown to be effec-tive for reducing human labeling effort in su-pervised learning tasks, and in this work we explore its suitability for automatic short an-swer assessment on the ASAP corpus. We systematically investigate a wide range of AL settings, varying not only the item selection method but also size and selection of seed set items and batch size. Comparing to a random baseline and a recently-proposed diversity-based baseline which uses cluster centroids as training data, we find that uncertainty-based sampling methods can be beneficial, espe-cially for data sets with particular properties. The performance of AL, however, varies con-siderably across individual prompts.
1 Introduction
Methods for automatically scoring short, written, free-text student responses have the potential to greatly reduce the workload of teachers. This task of automatically assessing such student responses (as opposed to, e.g., gap-filling questions) is widely re-ferred to as short answer scoring (SAS), and auto-matic methods have been developed for tasks rang-ing from science assessments to readrang-ing comprehen-sion, and for such varied domains as foreign lan-guage learning, citizenship exams, and more tradi-tional classrooms.
Most existing automatic SAS systems rely on su-pervised machine learning techniques that require large amounts of manually labeled training data to achieve reasonable performance, and recent work (Zesch et al., 2015; Heilman and Madnani, 2015;
Horbach et al., 2014; Basu et al., 2013, among oth-ers) has begun to investigate the influence of the quantity and quality of training data for SAS. In this paper we take the next logical step and investigate the applicability of active learning for teacher work-load reduction in automatic SAS.
As for most supervised learning scenarios, au-tomatic SAS systems perform more accurate scor-ing as the amount of data available for learnscor-ing increases. Particularly in the educational context, though, simply labeling more data is an unsatisfying and often impractical recommendation. New ques-tions or prompts with new sets of responses are gen-erated on a regular basis, and there’s a need for au-tomatic scoring approaches that can do accurate as-sessment with much smaller amounts of labeled data (‘labeling’ here generally means human grading).
One solution to this problem is to develop generic scoring models which do not require re-training in order to do assessment for a new data set (i.e. a new question/prompt plus responses). Meurers et al. (2011) apply such a model for scoring short reading comprehension responses written by learners of Ger-man. This system crucially relies on features which directly compare learner responses to target answers provided as part of the data set, and the responses are mostly one sentence or phrase. In this work we are concerned with longer responses generated from a wide range of prompt types, from questions ask-ing for list-like responses to those seekask-ing coherent multi-sentence texts (details in Section 3). For such questions, there is generally no single best response, and thus the system cannot rely on comparisons to a single target answer per question. Rather systems
need features which capture lexical properties of re-sponses to the prompt at hand. In other words, a new scoring model is built for each individual prompt.
A second solution involves focused selection of items to be labeled, with the aim of comparable per-formance with less labeled data. Zesch et al. (2015) investigate whether carefully selected training data are beneficial in an SAS task. For each prompt, they first cluster the entire set of responses and then train a classifier on the labeled instances that are closest to the centroids of the clusters produced. The in-tuition – that a training data set constructed in this way captures the lexical diversity of the responses – is supported by results on a data set with shorter responses, but on the ASAP data set, the approach fails to improve over random selection.
The natural next step is to use active learning (AL, Settles (2012)) for informed selection of training stances. In AL, training corpora are built up in-crementally by successive selection of instances ac-cording to the current state of the classifier (a de-tailed description appears in Section 4). In other words, the machine learner is queried to determine regions of uncertainty, instances in that region are sampled and labeled, these are added to the training data, the classifier is retrained, and the cycle repeats. Our approach differs from that of Zesch et al. (2015) in two important ways. First, rather than se-lecting instances according to the lexical diversity of the training data, we select them according to the output of the classifier. Second, we select instances and retrain the classifier in an incremental, cyclical fashion, such that each new labeled instance con-tributes to the knowledge state which leads to selec-tion of the next instance.
Sample selection via AL involves setting a num-ber of parameters, and there is no single best-for-all-tasks AL setting. Thus we explore a wide range of AL scenarios, implementing a number of established methods for selecting candidates. We consider three families of methods. The first are uncertainty-based methods, which target items about which the classi-fier is least confident. Next, diversity-based methods aim to cover the feature space as broadly as possi-ble; the cluster-centroid selection method described above is most similar to this type of sample selec-tion. Finally, representativeness-based methods se-lect items that are prototypical for the data set at
hand. Our results show a clear win for uncertainty-based methods, with the caveat that performance varies greatly across prompts.
To date, there are no clear guidelines for match-ing AL parameter settmatch-ings to particular classification tasks or data sets. To better understand the varying performance of different sample selection methods, we present an initial investigation of two properties of the various data sets. Perhaps unsurprisingly, we see that uncertainty-based sampling brings stronger gains for data sets with skewed class distributions, as well as for those with more cleanly separable classes according to language model perplexity.
In sum, active learning can be used to reduce the amount of training data required for automatic SAS on longer written responses without representa-tive target answers, but the methods and parameters need to be chosen carefully. Further investigation is needed to formulate recommendations for matching AL settings to individual data sets.
2 Related work
This study contributes to a recent line of work ad-dressing the question of how to reduce workloads for human graders in educational contexts, in both supervised and unsupervised scoring settings.
For the ASAP corpus (which is also the fo-cus of our experiments), the cluster-centroid sam-pling method shows no improvement over a clas-sifier trained on randomly-sampled data. An inter-esting outcome of the experiments by Zesch et al. (2015) is the highly-variable performance of classi-fiers trained on a fixed number of randomly-sampled instances; out of 1000 random trials, the difference between the best and worst runs is considerable. The highly-variable performance of systems trained on randomly-selected data underscores the need for more informed ways of selecting training data.
A related approach to human effort reduction is the use of clustering in a computer-assisted scoring setting (Brooks et al., 2014; Horbach et al., 2014; Basu et al., 2013). In these studies, answers are clus-tered through automatic means, and teachers then la-bel clusters of similar answers instead of individual student responses. The approaches vary in whether human grading is actual or simulated, and also with respect to how many items in each cluster graders in-spect. The value of clustering in these works has no connection with supervised classification, but rather lies in the ability it gives teachers both to reduce their grading effort and to discover subgroups of re-sponses that may correspond to new correct solu-tions or to common student misconcepsolu-tions.
In the domain of educational applications, AL has recently been used in two different settings where reduction of human annotation cost is desirable. Ni-raula and Rus (2015) use AL to judge the quality of automatically generated gap-filling questions, and Dronen et al. (2014) explore AL for essay scoring using sampling methods for linear regression.
To the best of our knowledge, AL has not pre-viously been applied to automatic SAS. Our task is most closely related to studies such as Figueroa et al. (2012), where summaries of clinical texts are classified using AL, or Tong and Koller (2002) and McCallum and Nigam (1998), both of which label newspaper texts with topics. Unlike most other pre-vious AL studies, text classification tasks need AL methods that are suitable for data that is represented by a large number of mostly lexical features.
3 Experimental setup
This section describes the data set, features, and classifier used in our experiments.
3.1 Data
All experiments are performed on the ASAP 2 cor-pus, a publicly available resource from a previous automatic scoring competition hosted by Kaggle.1.
This corpus contains answer sets for 10 individual short answer questions/prompts (we use the terms interchangeably) covering a wide range of topics, from reading comprehension questions to science and biology questions. Each answer is labeled with a numeric score from 0.0-2.0/3.0 (in 1.0 steps; the number of possible scores varies from question to question), and answer length ranges from single phrases to several sentences. Although scores are numeric, we treat each score as one class and model the problem as classification rather than regression. This approach is in line with previous related work as well as standard AL methods.
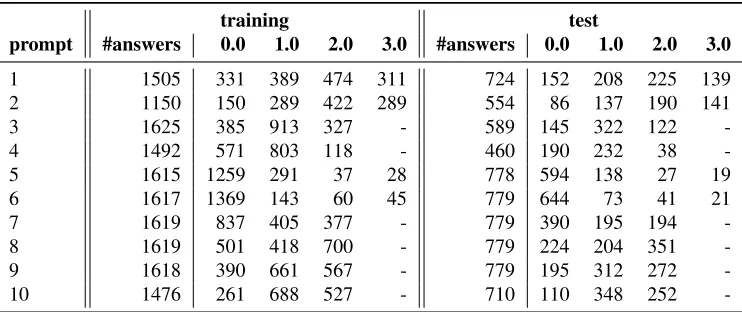
For each prompt, we split the data set randomly into 90% training and 10% test data. We then aug-ment the test set with all items from the ASAP “pub-lic leaderboard” evaluation set. Table 1 shows the number of responses and label distributions for each prompt. Some data sets (i.e. answer set per prompt) are clearly much more imbalanced than others.
3.2 Classifier and features
In line with previous work on the ASAP data, clas-sification is done using the Weka (Hall et al., 2009) implementation of the SMO algorithm.
For feature extraction, all answers are prepro-cessed using the OpenNLP sentence splitter2and the
Stanford CoreNLP tokenizer and lemmatizer (Man-ning et al., 2014). As features, we use lemma 1- to 4-grams to capture lexical content of answers, as well as character 2- to 4-grams to account for spelling er-rors and morphological variation. We lowercase all textual material before extracting ngrams, and fea-tures are only included if they occur in at least two answers in the complete data set.
This is a very general feature set that: (a) has not been tuned to the specific task, and (b) is
training test
prompt #answers 0.0 1.0 2.0 3.0 #answers 0.0 1.0 2.0 3.0
1 1505 331 389 474 311 724 152 208 225 139 2 1150 150 289 422 289 554 86 137 190 141
3 1625 385 913 327 - 589 145 322 122
-4 1492 571 803 118 - 460 190 232 38
-5 1615 1259 291 37 28 778 594 138 27 19
6 1617 1369 143 60 45 779 644 73 41 21
7 1619 837 405 377 - 779 390 195 194
-8 1619 501 418 700 - 779 224 204 351
-9 1618 390 661 567 - 779 195 312 272
-10 1476 261 688 527 - 710 110 348 252
-Table 1:Data set sizes and label distributions for training and test splits. ‘-’ indicates a score does not occur for that data set.
ilar to the core feature set for most other SAS work on the ASAP data. In preliminary classification experiments, we also tried out features based on skip ngrams, content-word-only ngrams, and de-pendency subtrees of various sizes. None of these features resulted in consistently better performance across all data sets, so they were rejected in favor of the simpler, smaller feature set.
4 Parameters of Active Learning
The core algorithm we use for active learning is the standard setting for pool-based sampling (Settles, 2010); pseudocode is shown in Figure 1.
The AL algorithm
split data set intotrainingandtest select seedss0, s1, ..., sn∈training request labels fors0, ...sn
labeled:={s0, s1, ..., sn}
unlabeled:=training\{s0, s1, ..., sn} whileunlabeled6=∅:
select instancesi0, i1, ..., im ∈unlabeled* unlabeled=unlabeled\{i0, i1, ..., im} request labels fori0, i1, ..., im
labeled=labeled∪{i0, i1, ..., im} build a classifier onlabeled
run classifier ontestand report performance
∗according to some sample selection method
Figure 1:Pseudocode for general, pool-based active learning.
The process begins with a pool of unlabeled train-ing data and a small labeled seed set. At the start of each AL round, the algorithm selects one or more
instances whose label(s) are then requested. In sim-ulation studies, requesting the answer means reveal-ing a pre-annotated label; in real life, a human anno-tator (i.e. a teacher) would provide the label. After newly-labeled data has been added to the training data, a new classifier is trained, run on the remain-ing unlabeled data, and the outcomes are stored. For uncertainty sampling methods, these are used to se-lect the instances to be labeled in the next round. The classifier’s performance is evaluated on a fixed test set. The efficacy of the item selection method is evaluated by comparing the performance of this classifier to that of a classifier trained on the same number of randomly-selected training instances.
In the following, we discuss the main factors that play a role in active learning: the item selection methods that determine which item is labeled next, the number of seed instances for the initial classi-fier and how they are chosen, and the number of in-stances labeled per AL cycle.
4.1 Item selection
[image:4.612.121.492.54.210.2]Random Baseline. We use a standard random sampling baseline. For each seed set, the random baseline results are averaged over 10 individual ran-dom runs, and evaluations then average over 10 seed sets, corresponding to 100 random runs.
Entropy Sampling is our core uncertainty-based
selection method. Following Lewis and Gale (1994), we model the classifier’s confidence regarding a par-ticular instance using the predicted probability (for an itemx) of the different labelsy, as below.
xselected=argmaxx − X
i
P(yi|x)logP(yi|x) !
Classifier confidence is computed for each item in the unlabeled data, and the one with the highest en-tropy (lowest confidence) is selected for labeling.
Boosted Entropy Sampling Especially for very
skewed data sets, it is often favourable to aim at a good representation of the minority class(es) in the training data selected for AL. Tomanek and Hahn (2009) proposed several methods for selecting the minority class with a higher frequency. We adopt their method of boosted entropy sampling, where per-label weights are incorporated into the entropy computation, in order to favor items more likely to belong to a minority class. Tomanek and Hahn (2009) apply this technique to named entity recog-nition, where it is possible to estimate the true la-bel distribution. In our case, since we don’t know the expected true distribution of scores, for each AL round, we instead adapt label weights using the dis-tribution of the current labeled training data set.
Margin Sampling is a variant of entropy
sam-pling with the one difference that only the two most likely labels (instead of all three or four) are used in the entropy comparison. As a result, this meth-ods tends to select instances that lie on the decision border between two classes, instead of items at the intersection of all clasess.
Diversity Sampling aims to select instances that
cover as much of the feature space as possible, i.e. that are as diverse as possible. We model this by se-lecting the item with the lowest average cosine simi-larity between the item’s feature vector and those of the items in the current labeled training data set.
Representativeness Sampling uses a different
intuition: this method selects items that are highly representative of the remainder of the unlabeled data pool. We model representativeness of an item by the average distance (again, measures as cosine similarity between feature vectors) between this item and all other items in the pool. This re-sults in selection of items near the center of the pool.
Note that these selection methods are somewhat complimentary. While entropy and margin sampling generally select items from the decision boundaries, they tend to select both outliers and items from the center of the distribution.
Representativeness sampling never selects out-liers but only items in the center of the feature space. Diversity sampling selects items that are as far from all other items as possible, and in doing so covers as much of the feature space as possible, with a ten-dency to select outliers.
4.2 Cluster Centroid Baseline
Another interesting baseline for comparison are classifiers trained on cluster centroids, as proposed by Zesch et al. (2015). Following their approach, we use Weka’s k-means clustering to cluster the data, with k equal to the desired number of training in-stances. From each cluster, we extract the item clos-est to the centroid, build a training set from the ex-tracted items, and learn a classifier from the training data. This process is repeated with varying numbers of training items: the first iteration has 20 labeled items, and we add in steps of 20 until reaching 200 labeled items. We then add data in steps of 50 until we reach 500 labeled items, and in steps of 100 un-til all data has been labeled. Note that this approach does not directly fit into the general AL framework. In AL, the set of labeled data is increased incremen-tally, while with this approach a larger training set is not necessarily a proper superset of a smaller train-ing set but may contain different items.
4.3 Seed selection
we consider two ways of selecting seed set items. First is the baseline of (a) random seed selec-tion. Random selection can be suboptimal when it produces unbalanced seed sets, especially if one or more classes are not contained in the seed data at all or – in the worst case – the seed set contains only items of one class. Some of the ASAP data sets are very skewed (e.g. questions 5 and 6, see Table 1) and carry a high risk of producing such suboptimal seeds via random selection.
The second condition is(b) equal seed selection, in which seed items are selected such that all classes are equally represented. We do this in an oracle-like condition, but presumably teachers could pro-duce a balanced seed set without too much difficulty by scanning through a number of student responses. Of course, this procedure would require more effort than simply labeling randomly-selected responses.
The number of items in the seed set is another im-portant AL parameter. While a larger seed set pro-vides a more stable basis for learning, a smaller seed set shows benefits from AL at an earlier stage and requires less initial labeling effort. In thesmall seed setcondition, and for both random and equal selec-tion methods, 10 individual seed sets per prompt are chosen, each with either 3 or 4 seeds (corresponding to the number of classes per prompt). We repeat this process for thelarge seed setcondition, this time se-lecting 20 items per seed set.
4.4 Batch size
Batch size determines how many instances are la-beled in each AL round. This parameter is especially relevant with the real-world application of SAS in mind. In real life, it may be inconvenient to have a teacher label just one instance per step, waiting in between labeling steps for retraining of the classifier. On the other hand, sampling methods benefit from smaller batch sizes, as larger batches tend to contain a number of similar, potentially redundant instances. To combine the benefits of the two settings, we use varying batch sizes. To benefit from fine-grained sample selection, we start with a batch size of one and keep this until one hundred instances have been labeled. We then switch to a batch size of 5 until 300 instances have been labeled, and from then on label 20 instances per batch.
For comparison, we also run experiments where
20 instances are labeled in every AL step before a new classification model is learned, in order to in-vestigate whether the potentially inconvenient pro-cess of training a new model after each individual human annotation step is really necessary.
5 Results
We now investigate to what extent active learning, using various settings, can reduce the amount of training data needed for SAS.
5.1 Evaluation of Active Learning
We evaluate all of our SAS systems using Cohen’s linearly weighted kappa (Cohen, 1968). Each result reported for a given combination of item selection and seed selection methods is the average over 10 runs, each with a different seed set. The seed sets remain fixed across conditions.
In order to evaluate the overall performance of an AL method, we need to measure the performance gain over a baseline. Rather than computing this at one fixed point in the learning curve, we follow Melville and Mooney (2004) in looking at averaged performance over a set of points early in the learning curve. This is where AL produces the biggest gains; once many more items have been labeled, the dif-ferences between the systems reduces. We slightly adapt Melville and Mooney’s method and compute the average percent error reduction (that is, error re-duction on kappa values) over the first 300 labeled instances (18-26% of all items, depending on the size of the data set).
5.2 Experiment 1: Comparison of different item selection methods
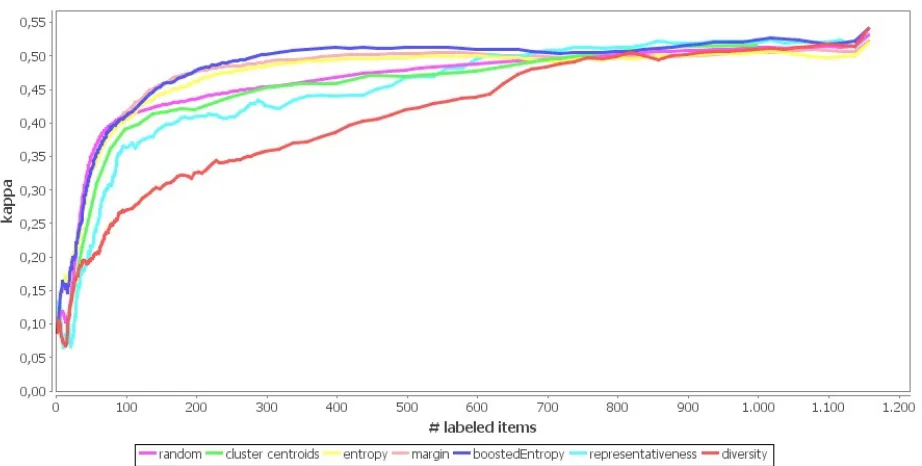
The first experiment compares the different item se-lection methods outlined in Section 4.1, using small seedsets and varying batch sizes.
Figure 2:AL performance curves compared to two baselines: random item selection and cluster centroids. All results are averaged over all prompts and seed sets.
confirm the findings of Zesch et al. (2015) (though in a slightly different setting).
The picture changes a bit when we look at the performance of AL methods per prompt and with different seed selection methods. Table 2 shows the percent error reduction (compared to the random baseline) per prompt and seed selection method, av-eraged over the first 300 labeled items. Most no-ticeable is that we see a wide variety in the perfor-mance of the sample selection methods for the vari-ous prompts. For some - most pronouncedly prompt 2, 5, 6 and 10 - there is a consistent improvement for uncertainty sampling methods, while other prompts seem to be almost completely resistent to AL. When looking at individual averaged AL curves, we can see some improvement for prompts 7 to 9 that peaks only after 300 items are labeled. For prompt 3, none of the AL methods ever beats the baseline, at any point in the learning process. We also observe vari-ability in the performance across seed sets for one prompt, as can be seen from the standard deviation.
The question of which AL method is most effec-tive for this task can be answered at least partially: if any method yields a substantial improvement, it is an uncertainty-based method. On average, boosted entropy gives the highest gains in both seed selection
settings. Comparing random to equal seed selection, performance is rather consistently better when AL starts with a seed set that covers all classes equally.
prompt entropy margin boosted diversity
represen-& seeds entropy tativeness
Seeds entropy margin boosted
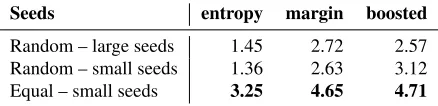
[image:8.612.75.294.57.110.2]Random – large seeds 1.45 2.72 2.57 Random – small seeds 1.36 2.63 3.12 Equal – small seeds 3.25 4.65 4.71 Table 3:Error reduction rates over random sampling for differ-ent seed set sizes, averaging over all prompts.
5.3 Experiment 2: The influence of seeds
Experiment 1 shows a clear benefit for using equal rather than random seeds. In a real life scenario, however, balanced seed sets are harder to produce than purely random ones. One might argue that us-ing a larger randomly-selected seed set increases the likelihood of covering all classes in the seed data and provides a better initialization for AL, without the additional overhead of creating balanced seed sets.
This motivates the next experiment, in which learning begins with seed sets of 20 randomly-selected labeled items, but otherwise follows the same procedure. We compare the performance of systems intialized with these larger seed sets to both random and equal small seed sets, considering only the more promising uncertainty-based item selection methods, and again using varying batch sizes.
Table 3 shows the results. We can see, that the performance for margin and entropy sampling is slightly better than the small random seed set (cu-riously not for boosted entropy), but it is still below that of the small equal seed set. However, the trend across items is not completely clear. We still take it as an indicator that seeds of good quality cannot be outweight by quantity.
5.4 Experiment 3: The influence of batch sizes
In experiment 1 we used varying batch sizes that learn a new model after each individual labeled item in the beginning and allow larger batches only later in the AL process. In a real life application, larger batch sizes might be in general preferrable. There-fore we test an alternative setup where we sample and label 20 items per batch before retraining.
Table 4 presents results for uncertainty-based sampling methods, averaged over the first 300 la-beled instances. Compared to the varying batch size setup (numbers in parentheses), performance goes down, indicating that fine-grained sampling really does provide a benefit, especially early in the
learn-Seeds entropy margin boosted
Equal -1.11 (3.25) 3.78 (4.65) 2.12 (4.71) Random 0.04 (1.36) 2.60 (2.63) 0.93 (3.12) All -0.53 (2.30) 3.19 (3.64) 1.53 (3.92) Table 4:Error reduction rates over random sampling for large batch size and small seed sets, averaging over all prompts. Scores from the varying batch size setup appear in parentheses.
ing process. Where larger batch sizes may lead to selection of instances in the same region of uncer-tainty, a smaller batch size allows the system to re-solve a certain region of uncertainty with fewer la-beled training instances.
6 Variability of results across datasets
On average, it is clear that uncertainty-based active learning methods are able to provide an advantage in classification performance over random or cluster-centroid baselines. If we look at the result for the different prompts, though, it is equally clear that AL performance varies tremendously across data sets for individual prompts.
In order to deploy AL effectively for SAS, we need to better understand why AL works so much better for some data sets than for others.
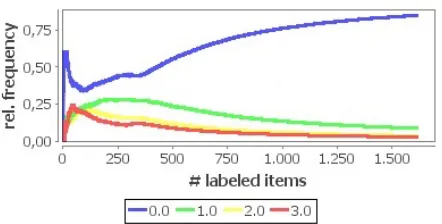
In Table 2 we see that AL is especially effective for prompts 5 and 6. Cross-referencing Table 1, it becomes clear that these are the two ASAP prompts with the highest degree of class imbalance. Figure 3 shows the changes in the distribution of the indi-vidual classes among the labeled data for prompt 6 as AL (here with entropy item selection) proceeds. We see clearly that uncertainty sampling at early stages selects the different classes in a way that is more balanced than the overall distribution for the full data set and thus increases the classifier’s ac-curacy in labeling minority class items. For com-parison, a plot for random sampling would ideally consist of four lines parallel to the x axis, and both diversity and representativeness sampling tend to se-lect items from the majority class, explaining their bad performance.
Figure 3:Distribution of individual classes among the labeled data for prompt 6, using entropy sampling.
the classes within a prompt are to one another. We measure this per class by training a LM on the items from all other classes (for the same prompt) and then compute the average perplexity of the target class items under the “other-classes” LM. Higher average perplexity means that the items in the class are more readily separable from items in other classes.
prompt score 0.0 score 1.0 score 2.0 score 3.0
1 156 46 27 45
2 104 48 52 56
3 44 23 64
-4 78 59 55
-5 970 88 52 49
6 907 76 60 44
7 338 117 45
-8 535 70 47
-9 633 127 56
-10 304 49 39
-Table 5: Average perplexity per prompt and class under LMs trained on all “other-class” items from the same prompt.
Table 5 shows the results. We see that for those answers that work well under AL, again prominently prompts 5 and 6, at least some classes separate very well against the other classes. They show a high average perplexity, indicating that the answer is not well modeled by other answers with different scores. In comparison, for some other data sets where the uncertainty curves do not clearly beat random sam-pling, especially 3 and 4, we see that the classes are not well separated from each other. They are among those with the lowest perplexity across scores.
This result, while preliminary and dependent on knowing the true scores of the data, suggests that un-certainty sampling profits from classes that are well separated from one another, such that clear regions
of uncertainty can emerge. An intriguing future di-rection is to seek out other approaches to character-izing unlabeled data sets, in order to determine: (a) whether AL is a suitable strategy for workload re-duction, and (b) if so, which AL setting will give the strongest performance gains for the data set at hand.
7 Conclusion
In this study, we have investigated the applicabil-ity of AL methods to the task of SAS on the ASAP corpus. Although the performance varies consider-ably from prompt to prompt, on average we find that
uncertainty-based sample selectionmethods
out-perform both a random baseline and a cluster cen-troid baseline, given the same number of labeled in-stances. Other sample selection methods capturing diversity and representativeness perform well below the baselines.
In terms of seed selection, there is a clear benefit from anequal seed set, one that covers all classes equally. A small equal seed set is preferable even to a larger but potentially unbalanced seedset. In ad-dition, we see benefits from a variable batch size
setting over using a larger batch size. It is beneficial to proceed in small steps at the beginning of learn-ing, selecting one item per run, and only move to larger batch sizes later on.
We see two interesting avenues for future work. First, the influence of the quality of seed set items with respect to the coverage of classes raises the question of how best to select - or even generate - equally distributed seed sets. One might argue whether an automated approach is necessary: per-haps an experienced teacher could easily browse through the data in a time-efficient way to select clear examples of low-, mid-, and high-scoring an-swers as seeds.
[image:9.612.74.300.329.464.2]8 Acknowledgements
We want to thank the three anonymous reviewers for their helpful comments.
Andrea Horbach is funded by the Cluster of Ex-cellence “Multimodal Computing and Interaction” of the German Excellence Initiative. Alexis Palmer is funded by the Leibniz ScienceCampusEmpirical Linguistics and Computational Language Modeling, supported by the Leibniz Association under grant no. SAS-2015-IDS-LWC and by the Ministry of Science, Research, and Art (MWK) of the state of Baden-W¨urttemberg.
References
Sumit Basu, Chuck Jacobs, and Lucy Vanderwende. 2013. Powergrading: A clustering approach to am-plify human effort for short answer grading. Transac-tions of the Association for Computational Linguistics, 1:391–402.
Michael Brooks, Sumit Basu, Charles Jacobs, and Lucy Vanderwende. 2014. Divide and correct: Using clus-ters to grade short answers at scale. InProceedings of the First ACM Conference on Learning @ Scale Con-ference, L@S ’14, pages 89–98, New York, NY, USA. ACM.
Jacon Cohen. 1968. Weighted kappa: nominal scale agreement with provision for scaled disagreement or partial credit.Psychol Bull., (70):213–220.
Dmitriy Dligach and Martha Palmer. 2011. Good seed makes a good crop: accelerating active learning using language modeling. InProceedings of the 49th Annual Meeting of the Association for Computational Linguis-tics: Human Language Technologies: short papers-Volume 2, pages 6–10. Association for Computational Linguistics.
Nicholas Dronen, Peter W. Foltz, and Kyle Habermehl. 2014. Effective sampling for large-scale automated writing evaluation systems. CoRR, abs/1412.5659. Rosa L Figueroa, Qing Zeng-Treitler, Long H Ngo,
Sergey Goryachev, and Eduardo P Wiechmann. 2012. Active learning for clinical text classification: is it bet-ter than random sampling? Journal of the American Medical Informatics Association, 19(5):809–816. Mark Hall, Eibe Frank, Geoffrey Holmes, Bernhard
Pfahringer, Peter Reutemann, and Ian H. Witten. 2009. The WEKA Data Mining Software: An Update.
SIGKDD Explor. Newsl., 11(1):10–18, November. Michael Heilman and Nitin Madnani. 2015. The impact
of training data on automated short answer scoring per-formance. Silver Sponsor, pages 81–85.
Andrea Horbach, Alexis Palmer, and Magdalena Wolska. 2014. Finding a tradeoff between accuracy and rater’s workload in grading clustered short answers. In Pro-ceedings of the 9th Language Resources and Evalua-tion Conference (LREC), pages 588–595, Reykjavik, Iceland.
David D. Lewis and William A. Gale. 1994. A sequential algorithm for training text classifiers. InProceedings of the 17th Annual International ACM SIGIR Confer-ence on Research and Development in Information Re-trieval, SIGIR ’94, pages 3–12, New York, NY, USA. Springer-Verlag New York, Inc.
Christopher D. Manning, Mihai Surdeanu, John Bauer, Jenny Finkel, Steven J. Bethard, and David McClosky. 2014. The Stanford CoreNLP natural language pro-cessing toolkit. InAssociation for Computational Lin-guistics (ACL) System Demonstrations, pages 55–60. Andrew McCallum and Kamal Nigam. 1998. Employing
EM and Pool-Based Active Learning for Text Classi-fication. InProceedings of the Fifteenth International Conference on Machine Learning, ICML ’98, pages 350–358, San Francisco, CA, USA. Morgan Kauf-mann Publishers Inc.
Prem Melville and Raymond J. Mooney. 2004. Di-verse ensembles for active learning. In Proceedings of 21st International Conference on Machine Learning (ICML-2004), pages 584–591, Banff, Canada, July. Detmar Meurers, Ramon Ziai, Niels Ott, and Janina
Kopp. 2011. Evaluating Answers to Reading Com-prehension Questions in Context: Results for German and the Role of Information Structure. InProceedings of the TextInfer 2011 Workshop on Textual Entailment, pages 1–9, Edinburgh, Scottland, UK. Association for Computational Linguistics.
Nobal Bikram Niraula and Vasile Rus. 2015. Judging the quality of automatically generated gap-fill ques-tion using active learning. InProceedings of the Tenth Workshop on Innovative Use of NLP for Building Ed-ucational Applications, pages 196–206, Denver, Col-orado, June. Association for Computational Linguis-tics.
Burr Settles. 2010. Active learning literature survey.
University of Wisconsin, Madison, 52(55-66):11. Burr Settles. 2012. Active Learning. Synthesis Lectures
on Artificial Intelligence and Machine Learning. Mor-gan & Claypool.
Andreas Stolcke. 2002. SRILM - An Extensible Lan-guage Modeling Toolkit. pages 901–904.
Simon Tong and Daphne Koller. 2002. Support vector machine active learning with applications to text clas-sification.J. Mach. Learn. Res., 2:45–66, March. Torsten Zesch, Michael Heilman, and Aoife Cahill.