Proceedings of the Thirteenth Workshop on Innovative Use of NLP for Building Educational Applications, pages 349–355
Predicting Second Language Learner Successes and Mistakes
by Means of Conjunctive Features
Yves Bestgen
Centre for English Corpus Linguistics Universit´e catholique de Louvain
Place Cardinal Mercier, 10 1348 Louvain-la-Neuve
Abstract
This paper describes the system developed by the Centre for English Corpus Linguistics for the 2018 Duolingo SLAM challenge. It aimed at predicting the successes and mistakes of second language learners on each of the words that compose the exercises they answered. Its main characteristic is to include conjunctive features, built by combining word ngrams with metadata about the user and the exercise. It achieved a relatively good performance, rank-ing fifth out of 15 systems. Complementary analyses carried out to gauge the contribution of the different sets of features to the perfor-mance confirmed the usefulness of the con-junctive features for the SLAM task.
1 Introduction
This paper presents the participation of the Cen-tre for English Corpus Linguistics (CECL) in the 2018 Duolingo shared task on Second Language Acquisition Modeling (SLAM) which was held in conjunction with the 13th Workshop on Innova-tive Use of NLP for Building Educational Appli-cations. The objective of the task is to build a model to predict whether second language learn-ers will make a mistake on each of the words (to-kens) that compose the exercises they answered. There were three tracks: English speakers learn-ing Spanish (es en), Spanish speakers learnlearn-ing En-glish (es en) and EnEn-glish speakers learning French (en en).
To develop the model, the organizers of the challenge made available a very large number of exercises carried out by a large number of learn-ers of Duolingo, a free online language-learning platform, which attracted more than 200 million learners since its launching in 2012 (see Settles et al. (2018) for details). In this training set, the to-kens on which each learner made a mistake were marked, but the error itself was not provided. This
task is thus very different from the one at the root of many applications of natural language process-ing in the field of education that aim to automati-cally evaluate texts produced by second language learners (Weigle, 2013). The traditional approach for the latter, which relies on linguistic indices more or less strongly correlated with text quality such as lexical richness, syntactic complexity and especially the presence of errors of different types (e.g., Burstein et al., 2004; Futagi et al., 2008; Yannakoudakis et al., 2011; Santos et al., 2012; Ramineni and Williamson, 2013; Somasundaran et al., 2015; Bestgen, 2016, 2017), is obviously not applicable to the SLAM challenge.
Compared to the automatic evaluation of learner texts, the SLAM task has several advantages (+), but also several disadvantages (-):
+ Each learner produced a relatively large num-ber of responses allowing to estimate his or her level of competence;
+ The learners’ responses are spaced out in time making possible to try to model the evo-lution of their competence throughout their learning;
+ The same exercises were presented to a large number of different learners making it pos-sible to get a relatively good estimate of the difficulty of each of them;
– The exercises are very short, as 99% of the utterances consist of no more than six tokens, which strongly limits the linguistic context available for any NLP procedure;
– And above all, as indicated above, the prompt to be processed by the learner is provided, but not the actual answer.
As previous research of the CECL in this field deals with the question of automatic evaluation
and only partially took into account the tempo-ral dimension of learning (Bestgen and Granger, 2014), I chose to break down the problem in two steps:
• Try to get the best prediction without using the sequential information available in the dataset.
• Add the sequential information and see
whether it can improve the prediction.
Having not been successful in the second step, I focused this report on the first. It is therefore not really an attempt to model second language acqui-sition, but to predict the successes and mistakes of second language learners. The proposed sys-tem can be seen as a baseline syssys-tem since it does not take into account the richest information made available.
The developed system achieved a relatively good performance since it ranks fifth out of 15 systems, but nevertheless at a respectable distance from the best systems. Its main characteristic is to include conjunctive features, built by combining several primitive features. In machine learning, these conjunctive features are classically obtained by means of a polynomial kernel, but this has the effect of greatly lengthening the time needed to learn the model (Fan et al., 2008; Yoshinaga and Kitsuregawa, 2012). It was more efficient to ob-tain them manually and to use a (much faster) lin-ear approach to llin-earn the model.
The remainder of this report describes the datasets made available for this challenge, the sys-tem developed and the results obtained as well as the analyzes performed to get a better idea of the usefulness of the various components of the sys-tem.
2 Data
As explained in Settles et al. (2018), each in-stance to be categorized corresponded to a token of an exercise that has been presented to a user in one of three possible types of exercise, in one of three possible types of session and at a given time of his or her participation in the learning ac-tivities of the Duolingo platform. Several other metadata were provided for each exercise such as the country from which a user had done it. For each token, a series of morpho-syntactic features were also provided. The datasets were very large.
The fr en dataset, which was by far the smallest, contained more than 410 000 exercises and almost 1 200 000 tokens. The other data sets were approx-imately 2.12 times (es en) and 2.83 times (en es) larger.
These datasets were divided by the organizers into three sets, the TRAIN set with 80% of the data, the DEV set with 10% and the TEST set with remaining 10%. The final results of the challenge were determined by the organizers on the TEST set. In this report, all the developments that led to the predictive models were only done on the fr en dataset because its smaller size allowed the fastest processing. They were based on the TRAIN set to build the models and on the DEV set for evalua-tion.
3 System
3.1 Main Features Used
As a quick glance at the exercises, undertaken by students during their first 30 days of learning with the Duolingo platform (Settles et al., 2018), suggested that they were relatively simple from a lexical and syntactical point of view, I chose to base the features on the tokens and to disregard morpho-syntactic information.
Each instance (i.e., a token in an exercise) was encoded as a vector of 47 binary features, consist-ing of the followconsist-ing three feature sets:
• The main part (5 features) was composed of
the target token and the tokens (T) that sur-round it in the exercise. For a token such as “pas” (not) in the exercise “Ce n’ est pas un sandwich” (This is not a sandwich), the following five features were encoded: the tri-gram including the two tokens that precede it (n’ est pas), the bigram including the to-ken that precedes it (est pas), the toto-ken itself (pas), the bigram including the next token (pas un) and the trigram including the two following tokens (pas un sandwich)1. When
a ngram is incomplete because a token is too close to the beginning or to end of the exer-cise, the missing element is replaced by the pseudo-token “<s>”.
1The trigram composed of the preceding token, the
• The second set of features (7 features) was based on three metadata: the unique iden-tifier for each student (U), the exercise for-mat (F: three different values), and the ses-sion type (S: three different values). These features were encoded alone and in conjunc-tion, producing the following features: U, F, S, UF, US, FS and UFS.
• Finally, the conjunction of each token
fea-ture2with each of the metadata feature, such
as n’ est pas UFS, was encoded (35 fea-tures).
Each different type of feature was prefixed with a unique character sequence to avoid any colli-sion between features of different types. Of the 47 features used to encode each instance, some were very common in the dataset, such as the format, the session and their conjunctions, others were moderately frequent such as a user id or a token, but the majority was much rarer such as the con-junction of a user, a format, a session and a tri-gram.
3.2 Sequential Information Use
All the features, which included a target token and had been previously seen by a user, were dupli-cated with a new value that reflected the number of times it had been seen, the proportion of mis-takes this user made on it, and the time that had elapsed since he or she had seen it for the last time. These values were transformed by means of an ex-ponential3function. More details are not given on
these features because they were very inefficient as shown in the analyzes reported below.
3.3 Procedure to Build the Models
The feature extraction was performed by means of a series of custom SAS programs running in SAS University (freely available for research at http://www.sas.com/en us/software/university-edition.html). The predictive models used dur-ing the development phase were built on the fr en dataset by means of the L1-regularized logistic regression (L1-LR) available in the LIBLINEAR package (-s 6, Fan et al., 2008). The only meta-parameter that can be optimized was the
regular-2Technically, bigrams and trigrams can also be seen as
conjunctive features.
3Following a reviewer’s suggestion, a logarithm
transfor-mation was also tried, but it did not improve the performance on the TRAIN and DEV fr en datasets.
ization parameter C. A series of tests carried out on the TRAIN and DEV fr en sets led to setting it to 0.75. It was also the L1-LR with this same C parameter that was used in all the analyzes re-ported here, except for the models used for the fi-nal submission that were build by means of the L2-regularized logistic regression (-s 7, L2-LR) be-cause it appeared while preparing the submission that it produced slightly higher performances.
4 Analyses and Results
All the performances are summarized in terms of the area under the receiver operating characteris-tic curve (AUROC), the challenge main evaluation metric. The F1 score was also proposed as a sec-ondary metric by the challenge organizers, but it is not reported here because no attempt was made to optimize it4.
In the tables presented below, T stands for the Token ngrams, M for the Metadata, with U for User, F for Format and S for Session, Mc for the conjunctive features derived from the metadata and TM for the conjunctive features derived from the token ngrams and the metadata.
4.1 Performance on the Test Set
The performance and ranking of the base model and of the model that takes into account the se-quential information is given in Table 1 along with the performances of the systems ranked first, those of the two closest teams in the ranking and those of the baseline provided by the organizers. As a re-minder, the proposed models were developed for the fr en dataset and simply applied to the two other tracks. For the three tracks, the regulariza-tion parameter C for the L2-LR was set on the ba-sis of the TRAIN and DEV sets at the following values: 0.10 for fr en and es en and 0.05 for en es. The final models were learned on the concatenated TRAIN and DEV sets.
The performances of the proposed models were significantly better than the baseline, but not as good as the best system. They were lower than those of the team ranked fourth in two tracks, but higher in the fr en track on the basis of which they
4Furthermore, simple tricks allow, at least in the present
System en es es en fr en
[image:4.595.316.520.61.118.2]First 0.861 0.838 0.857 Fourth 0.848 0.824 0.839 Sequential 0.846 0.818 0.843 Base 0.845 0.817 0.842 Sixth 0.841 0.807 0.835 Baseline 0.774 0.746 0.771
Table 1: Final performances (AUROC) for several sys-tems.
T M Mc TM AUROC
x x x x 0.8367
x x x 0.8167
x x 0.8078
[image:4.595.97.267.62.158.2]x 0.7488
Table 2: AUROC for several sets of features in the base model.
were developed. The benefits brought by using the sequential information were very small, prob-ably because the procedure employed did not in-troduce new features, but duplicated a number of them with different values.
4.2 In-depth Analysis of the Feature Sets
The remainder of this report analyzes in detail the contribution of the different sets of features to the performance of the base model. All these analy-ses were conducted on the TRAIN and DEV fr en dataset as explained above.
First, the ablation approach was used to assess the independent contribution of each set of fea-tures to the overall performance of the system. It consists in removing some sets of features of the model and re-evaluating it.
As Table 2 shows, the conjunctive features, in-cluding those built from the metadata alone, made a significant contribution to performance. The model that only includes the token ngrams clearly underperformed. The metadata are thus necessary to achieve an acceptable performance.
A second analysis was conducted to evaluate the impact of the three lengths of ngrams in the base model (Table 3). The results indicated that the tri-grams were not very useful contrarily to the bi-grams.
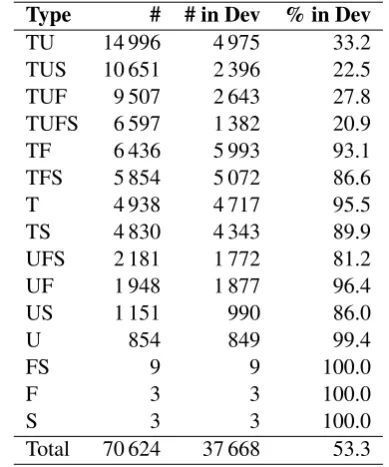
To get a better idea of the usefulness of the con-junctive features, Table 4 presents the number of features of each type to which the L1-LR assigned a non-zero weight (Andrew and Gao, 2007). It also indicates how many of these features were
Unigram Bigram Trigram AUROC
x x x 0.8367
x x 0.8340
[image:4.595.317.512.161.395.2]x 0.8130
Table 3: AUROC for the three ngram lengths (base model).
Type # # in Dev % in Dev
TU 14 996 4 975 33.2 TUS 10 651 2 396 22.5 TUF 9 507 2 643 27.8 TUFS 6 597 1 382 20.9 TF 6 436 5 993 93.1 TFS 5 854 5 072 86.6 T 4 938 4 717 95.5 TS 4 830 4 343 89.9 UFS 2 181 1 772 81.2 UF 1 948 1 877 96.4 US 1 151 990 86.0
U 854 849 99.4
FS 9 9 100.0
F 3 3 100.0
S 3 3 100.0
Total 70 624 37 668 53.3
Table 4: Number of features of each type selected by the L1-LR.Note: The conjunctive features are represented by the concatenation of the corresponding symbols.
present in the DEV set.
This table shows that the conjunctive features, including the more complex ones, were frequently selected by the L1-LR and that a non-negligible proportion of them were present in the DEV set. These are of course the types that encompassed the largest number of different features.
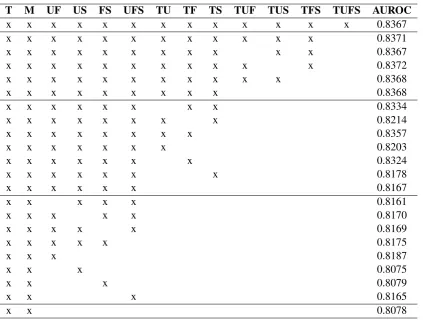
[image:4.595.108.254.201.269.2]Ses-T M UF US FS UFS Ses-TU Ses-TF Ses-TS Ses-TUF Ses-TUS Ses-TFS Ses-TUFS AUROC
x x x x x x x x x x x x x 0.8367
x x x x x x x x x x x x 0.8371
x x x x x x x x x x x 0.8367
x x x x x x x x x x x 0.8372
x x x x x x x x x x x 0.8368
x x x x x x x x x 0.8368
x x x x x x x x 0.8334
x x x x x x x x 0.8214
x x x x x x x x 0.8357
x x x x x x x 0.8203
x x x x x x x 0.8324
x x x x x x x 0.8178
x x x x x x 0.8167
x x x x x 0.8161
x x x x x 0.8170
x x x x x 0.8169
x x x x x 0.8175
x x x 0.8187
x x x 0.8075
x x x 0.8079
x x x 0.8165
[image:5.595.90.514.59.380.2]x x 0.8078
Table 5: AUROC for several subsets of features in the base model.
sion metadata are not very useful.
All these observations confirm the interest of some of the conjunctive features for the SLAM task, the token ngrams being a specific type of conjunctive features whose usefulness is well es-tablished in NLP. Their interest can be illustrated concretely by the two following examples. In the fr en TRAIN set, users made 78% of errors on the token “-” when it is preceded by the token “apr`es” (after), forming the bigram “apr`es -” (N = 198) found in “apr`es-midi” (afternoon). This overall percentage hides a large difference between the reverse-tap exercises (N = 91) on which 100% of errors were made and the reverse-translate exer-cises (N = 51) in which 49% of errors were made. The opposite profile is observed for the bigram “Vous connaissez” (You know), whose target to-ken is “connaissez”, for which there were in gen-eral 66% of errors (N = 73). When presented in the reverse-translate format, there were 94% of errors (N = 48) while there were only 9% of errors in the reverse-tap format (N = 22).
4.3 Conclusion
The base model presented in this paper does not take into account the longitudinal nature of the data made available by the organizers. Despite this, it achieved relatively high performances, ranking fifth out of 15 teams with an average of 0.016 AUROC point less than the best team, but it also outperformed nine team by more than 0.016 AUROC point. It must however be recog-nized that the inclusion of longitudinal informa-tion in this approach was inefficient. A psycholin-guistically motivated approach would have prob-ably produced better results (Settles and Meeder, 2016). The papers of the best teams participat-ing in this challenge should allow to determine whether they have used non-sequential features that are identical or similar to those used here. If it is not the case, it might be interesting to deter-mine whether the conjunctive features used here would allow to further improve their system per-formances.
L1 transfer, which is known to affect the type of errors produced by learners of a foreign language (Wong and Dras, 2009; Jarvis et al., 2013).
In a future edition of the challenge, it might be interesting to include in the test set a larger proportion of tokens that do not appear (or very rarely) in the training set and to carry out part of the evaluation separately on those tokens. In the current datasets, only 116 of the 1 920 different tokens present in the fr en TEST set were absent from the TRAIN and DEV sets. Even more, these 116 different tokens represented only 0.12% of the instances to categorize (168 out of 135 525). It should be noted that the datasets included a siz-able proportion of rarely seen tokens (i.e. 27% of the different tokens in fr en TRAIN and DEV sets were present at most 3 times), but they rep-resented only a very small fraction of the TEST set (less than 0.5%). Increasing the proportion of new or infrequently seen tokens in the test materi-als could favor the use of features that can be gen-eralized to unseen tokens. If this path is followed, it could be interesting to provide, in the training datasets, the exercises and the mistakes actually produced to further the development of predictive models that try to figure out the relation between a token and the mistake (while providing only the exercises for the test material to avoid the use of simple error detection systems).
Acknowledgments
The author wishes to thank the organizers of the 2018 SLAM challenge for putting together this valuable event and the reviewers for their very constructive comments. This work was supported by the Fonds de la Recherche Scientifique - FNRS (grant number J.0025.16). The author is a Re-search Associate of this institution.
References
Galen Andrew and Jianfeng Gao. 2007. Scalable train-ing of L1-regularized log-linear models. In Pro-ceedings of the 24th International Conference on Machine Learning, ICML ’07, pages 33–40, New York, NY, USA. ACM.
Yves Bestgen. 2016. Using collocational features to improve automated scoring of EFL texts. In Pro-ceedings of the 12th Workshop on Multiword Ex-pressions, pages 84–90.
Yves Bestgen. 2018. Beyond single-word measures:
L2 writing assessment, lexical richness and formu-laic competence. System, 69:65–78.
Yves Bestgen and Sylviane Granger. 2014. Quantify-ing the development of phraseological competence in L2 English writing: An automated approach.
Journal of Second Language Writing, 26:28–41. Jill Burstein, Martin Chodorow, and Claudia Leacock.
2004. Automated essay evaluation: The criterion online writing service. AI Magazine, 25:27–36. Martin Chodorow and Claudia Leacock. 2000. An
un-supervised method for detecting grammatical errors. InProceedings of the Conference of the North Amer-ican Chapter of the Association of Computational Linguistics (NAACL), pages 140–147.
Yoko Futagi, Paul Deane, Martin Chodorow, and Joel Tetreault. 2008. A computational approach to de-tecting collocation errors in the writing of non-native speakers of English. Computer Assisted Language Learning, 21:353–367.
Scott Jarvis, Yves Bestgen, and Steve Pepper. 2013. Maximizing classification accuracy in native lan-guage identification. In Proceedings of The 8th Workshop on Innovative Use of NLP for Build-ing Educational Applications (NAACL-HLT), pages 111–118.
Chaitanya Ramineni and David M. Williamson. 2013. Automated essay scoring: Psychometric guidelines and practices. Assessing Writing, 18(1):25–39. Victor Santos, Marjolijn Verspoo, and John Nerbonne.
2012. Identifying important factors in essay grad-ing usgrad-ing machine learngrad-ing. In Dina Sagari, Sa-lomi Papadima-Sophocleous, and Sophie Ioannou-Georgiou, editors,International Experiences in Lan-guage Testing and Assessment—Selected Papers in Memory of Pavlos Pavlou, pages 295–309. Peter Lang, Frankfurt au Main, Germany.
Burr Settles, Chris Brust, Erin Gustafson, Masato Hagiwara, and Nitin Madnani. 2018. Second lan-guage acquisition modeling. InProceedings of the NAACL-HLT Workshop on Innovative Use of NLP for Building Educational Applications (BEA). ACL. Burr Settles and Brendan Meeder. 2016. A trainable spaced repetition model for language learning. In
Proceedings of the 54th Annual Meeting of the As-sociation for Computational Linguistics (Volume 1: Long Papers), pages 1848–1858. Association for Computational Linguistics.
Swapna Somasundaran, Chong M. Lee, Martin Chodorow, and Xinhao Wang. 2015. Automated scoring of picture-based story narration. In Proceed-ings of the Tenth Workshop on Innovative Use of NLP for Building Educational Applications, pages 42–48.
Sze-Meng Jojo Wong and Mark Dras. 2009. Con-trastive analysis and native language identification. InProceedings of the Australasian Language Tech-nology Association Workshop, pages 53–61.
Helen Yannakoudakis, Ted Briscoe, and Ben Medlock. 2011. A new dataset and method for automatically grading ESOL texts. InThe 49th Annual Meeting of the Association for Computational Linguistics: Hu-man Language Technologies, pages 180–189.