Lyons PCCP WJA Issue
2010
Page | 1
Mechanism of Oxygen Reactions at Porous Oxide Electrodes
Part 2- Oxygen evolution at RuO
2, IrO
2and Ir
xRu
1-xO
2electrodes
in aqueous acid and alkaline solution
†Michael E G Lyons,*a and Stephane Floqueta
a
* To whom correspondence should be addressed. a Physical and Materials Electrochemstry
Laboratory, School of Chemistry, University of Dublin, Trinity College, Dublin 2, Ireland. .
Fax: 003531-6712826; Tel: 003531-8962051; E-mail:melyons@tcd.ieb
† Dedicated with great respect to Professor W John Albery (Algy) on the occasion of his 75th birthday.
Abstract
The kinetics mechanism of the oxygen evolution reaction at a series of RuO2/IrO2 mixed
oxides in aqueous acid and alkaline solution has been examined using a variety of electrochemical methods. Factors affecting the electrocatalytic activity have been elucidated and novel oxygen evolution mechanisms in terms of reactive oxyruthenium and oxyiridium surface groups are proposed.
Introduction
The use of hydrogen gas produced by the electrolysis of water is the basis of a long term energy conversion and storage option that has been and still continues to be the subject of considerable research and development, albeit occuring in fits and starts depending on current research funding priorities, fashions and directions. Alkaline water electrolysis, using electricity generated by renewable sources has been proposed as an environmentally inoffensive route to the production of the large volumes of hydrogen gas required by a possible hydrogen economy1-5. In practice the efficiency of water electrolysis is limited by the large anodic overpotential of the oxygen evolution reaction (OER)6. Over the past thirty years, considerable research effort has been devoted to the design, synthesis and characterization of anode materials, with the aim of achieving useful rates of the OER at the lowest possible overpotential, in order to optimize the overall electrolysis process. At practical current densities, anodes of RuO2 and IrO2 exhibit the lowest OER
Lyons PCCP WJA Issue
2010
Page | 2
electrolysis conditions but have been shown to be quite stable in polymer electrolyte Membrane (PEM) cells 8. We have recently reported in a series of papers that the oxides of the first row transition metals, in particular nickel and cobalt, offer a compromise solution, although they possess inferior electrocatalytic activity for the OER they display excellent long term corrosion resistance in alkaline solution and have the added advantage for being relatively inexpensive9,10. The subtext implicit in the latter statements is that the OER electrocatalytic mechanism is strongly dependent on the nature of the metal oxide electrode : whether one is dealing with an oxidized metal surface, a hydrous oxide electrode, or a thermally prepared DSA type oxide material. It is not unreasonable to state that the mechanism of the OER at oxidized metal and transition metal oxide electrodes in aqueous solution is of considerable scientific interest and importance and indeed remains controversial14,15. Specifically the question of the existance of a common mechanism for the process, which would facilitate the development of a theory of electrocatalysis for oxygen evolution, is therefore unresolved.
RuO2 and RuO2 based mixed oxide electrodes have been investigated widely as
electrocatalysts for the OER and chlorine evolution reactions. For example the mechanism of oxygen evolution at RuxTi1-xO2 coated titanium electrodes as a function of
solution pH have been investigated by Harrison and co-workers16 using a combination of steady state electrochemical methods and complex impedance spectroscopy. In slightly more recent work the surface chemistry of RuO2 and RuO2 based mixed oxide electrodes
(when the latter were operating actively as anodes for oxygen and chlorine evolution) has been investigated using XPS 17-20. Takusu et al21 presented comprehensive EXAFS data on the structure of Ru)2/IrO2 mixed oxide films deposited on Ti supports. The
electrochemical and electrocatalytic properties with respect to the OER and the oxygen reduction reaction (ORR) of a number of iridium compounds (including pyrochlores, perovskites and fluorides) in concentrated base (45% KOH) by Kotz and co-workers 22. Avaca and co-workers described the characterization of electrode surfaces modified by sol-gel derived RuxIr1-xO2 coatings for oxygen evolution in acid medium23. More recently
Marshall and co-workers24 described the electrochemical characterization of Ir
xSn1-xO2
powders as OER catalysts for PEM water electrolysers. Arico and co-workers described the preparation and evaluation of RuO2/IrO2, IrO2-Pt and IrO2/Ta2O5 electrodes for the
Lyons PCCP WJA Issue
2010
Page | 3
solution. The use of mixed Ru/Ir metal oxide catalysts in SPE cells have also recently been discussed in works by Tunold et al 27 and Song et al 28. Finally in recent years amorphous RuO2.xH2O has been found to possess significant energy storage capabilities
due to its ability to act as a ‘proton condenser’ and it represents the best material for use in electrochemical supercapacitors 29-31. This has led to a number of significant studies on the origin of the pseudocapacitance exhibited by these noble metal oxide materials32-35. In the present paper we revisit and extend the approach developed in part 1 published over twenty years ago7 which dealt with the OER mechanism and kinetics at both RuO
2
and RuxSn1-xO2 mixed oxide electrodes in alkaline solution. In the intervening years we
noted that many papers were published on the OER behaviour of mixed noble metal oxides (an ecletic mix of references to the latter being noted in the previous paragraph) but little work was reported on a dedicated kinetic analysis of Ru/Ir mixed oxides over the entire pH range. Here we present the results of a comprehensive examination of the catalytic properties with respect to OER activity of a series of conductive metallic IrxRu
1-xO2 electrodes in aqueous acid and alkaline solution. Unlike the Ru metal oxide material
prepared via the sol-gel method described by Periera et al36, our preferred oxide preparation route involves the thermal decomposition of the corresponding metal chloride solution applied on an appropriate substrate by a simple painting procedure. In the present paper plausable mechanisms (especially in the light of our recently published analysis of the OER mechanism at Fe, Ni and Co electrode surfaces9-13 ) for the OER in acid and base are also presented. Hence kinetic data obtained for a well characterized material over the entire pH range is presented and subjected to quantitative analysis. The focus is unashamadely electrochemical and concentrates on the examination of the mechanism of the OER using classical electrochemical techniques such as, for example, steady steady state Tafel plot analysis, reaction order studies and open circuit potential decay measurements. This is not to play down the usefullness of modern non-electrochemical spectroscopic 37-41 and computational techniques42-45 in mechanism elucidation. The seminal work produced by Bockris46 however stands as a clear examplar for the usefullness of this unsophisticated electrochemical approach47. Surface
electrochemistry is still not totally subsumed into surface science48. This has been
Lyons PCCP WJA Issue
2010
Page | 4
Experimental
The oxides were deposited on titanium foils (1 x 1 x 0.1 cm), on titanium rotating disc electrodes (0.2 cm2) and on porous titanium (1 cm2 of geometric surface purchased from Metafram). The supports were ultrasonically degreased in acetone, then in ethanol, and finally washed with Millipore water. The oxide electrodes were prepared via the thermal decomposition of a suitable salt. A convenient amount either (or both at a predetermined mole ratio for mixed oxide films) of RuCl3.xH2O or IrCl3.xH2O (Johnson-Matthhey) were
dissolved in 20% aqueous HCl solution and the solution was allowed to evaporate almost to dryness. The resulting material was then taken up in a small volume of isoproponal in order to form a paste which was painted onto the support by brush. After drying at 80°C for 15 minutes the electrodes were fired in air at a preselected chloride to oxide conversion temperature, typically 425°C for 10 minutes. The same procedure was repeated and several coatings were applied until the desired loading of catalyst was achieved. Typical oxide loadings of between 2-4 mg/cm2 were achieved after 2 – 4 deposition cycles respectively. The oxide loading was determined from the difference in weight of the electrode before and after the coating/annealing treatment. The electrodes were finally fired in air at 450°C for 2 hours. SPE composite electrodes were prepared by hot pressing the porous titanium/ oxide eelectrodes on a hydrated Nafion 117 membrane (DuPont de Nemours).
All solutions were made up using BDH ampoules of concentrated NaOH or H2SO4
solution. For the kinetic studies aqueous solutions of constant ionic strength (1 M) were used by adding the requesite amounts of Na2SO4 or NaCl. to the acid or base solution.
All experiments were performed at a solution temperature of 293 K.
A typical three compartment, electrode experimental cell was used. A Luggin capillary was utilized , the tip of which was placed ca 1 mm beneath the end of the working electrode. The Ohmic potential drop between the working electrode and the end of the Luggin capillary was estimated by taking the value of the high frequency resistance (at 30 kHz) from the Nyquist plot derived from complex impedance spectroscopy data. Typical values obtained for 1 M H2SO4 and 1 M NaOH were 0.25 Ω and 0.31 Ω respectively.
Lyons PCCP WJA Issue
2010
Page | 5
electrode in 0.5 M H2SO4 was used as reference.
The basic control element comprised of a computer controlled EG&G Model 273 potentiostat/galvanostat. Complex impedance spectroscopy measurements were facilitated using PAR Model 5208 lock-in amplifier and experimental control and subsequent data analysis was afforded by Model 378 Impedance software. For frequencies in the range 100 kHz - 5 Hz the 5208 lock-in amplifier was used. Data at lower frequencies were acquired via a FFT technique via the M378 software.
Cyclic voltammetry was performed at a sweep rate of 20 mV/s in the potential range between + 0.05 V and + 1.05 V (vs SCE) in acid solution and between – 0.65 and + 0.35 V (vs SCE) in alkaline medium. The area under the voltammetric curve was used to determine the surface charge Q* which was taken as a measure of the electrochemically active surface area of the oxide. Quasi steady state Tafel plots were recorded at a sweep rate of 1 mV/s. Every electrode was initially conditioned at + 0.05 V for 10 min followed by further conditioning at a potential close to the reversible potential of the OER (+ 0.95 V (acid solution), + 0.22 V (base solution)) before initiation of any slow sweep OER experiment. At the end of the latter the electrode was again conditioned at + 0.05 V for ten minutes before subsequent storage in MilliQ water. All Tafel plots are IR corrected. Steady state Tafel plot measurements were often complemented by studies of the decay of EMF recorded at open circuit. Open circuit potential decay measurements were usually performed after initially holding the potential of the electrode in the region 1.08 – 1.10 V (acid) or 0.35 – 0.37 V (base) for a given time period (ca 5 min). After switching off the potentiostat the electrode potential was subsequently measured at various time intervals using a high impedance voltmeter which was disconnected between readings in order to avoid any forced discharge.
Oxide coatings were subjected to SEM analysis using a JEOL Model 6400 scanning electron microscope.
Cyclic voltammetry was used to evaluate the extent of film loss (FL) due to dissolution and physical spalling of oxide particles from the electrode surface which arises during the course of extended polarization studies. We use %FL = 100 (1- Qt/Q0) where Q0
represents the charge density recorded after polarization of the fresh electrode at 500 mA/cm2 for a period of 2 hr and Qt denotes the charge density recorded voltammetrically
Lyons PCCP WJA Issue
2010
Page | 6
Results and Discussion
Cyclic voltammetry analysis and the nature of the oxymetal surface layers
The voltammetric behaviour of a set of thermally prepared RuO2/IrO2 mixed oxide films
(labeled as IrxRu1-xO2 for x = 0, 0.2, 0.5, 0.8 and 1.0) in aqueous acid and alkaline
solution are illustrated in fig.1 and fig.2 respectively. The potential window examined was 0.05 V to 1.05 V (vs SCE) for aqueous 1M H2SO4 solution (fig.1) and – 0.65 to 0.35
V (vs SCE) for aqueous 1 M NaOH solution (fig.2). In both sets of experiments the analytical sweep rate adopted was 20 mV/s, and the voltammograms were recorded as a function of oxide composition (expressed in terms of mole fraction of IrO2).
Insert fig.1 and fig.2 here.
The voltammetric curves recorded both in aqueous acid and base exhibit the characteristic shape expected for DSA type thermal oxide materials. In general large pseudocapacitative currents are seen across the potential window examined which are indicative the large real surface area associated with the thermally prepared oxide material. The voltammograms recorded for the mixed oxide IrxRu1-xO2 in aqueous acid were similar in
shape to those recently reported by Savinell and co-workers50. Rather broad and ill defined peaks are observed in the 0.35-0.45 V region and near 1.0 V (the latter peak reducing in position to near 0.9 V in IrO2 rich mixtures) in acid media. The
voltammograms exhibit greater definition when recorded in aqueous base. Distinct reversible peaks are noted at 0.3V prior to the onset of active oxygen gas evolution for all mixed oxide compositions with the exception of the pure IrO2 material. Furthermore two
sets of less well defined and broad peaks are observed at less anodic potentials at – 0.1 V and -0.35 V respectively for IrxRu1-xO2 materials in the composition range 0< x < 0.8.
This fine structure reduces to a well defined set of peaks at potentials of 0.1 V and – 0.25 V for the pure IrO2 material. A substantial increase in current is observed both in acid and
Lyons PCCP WJA Issue
2010
Page | 7
and Murphy 51.
There is now widespread agreement that the charge recorded during the course of voltammetric experiments with RuO2, IrO2, and IrxRu1-xO2 mixed oxide coatings on
titanium metal substrates in aqueous acid and alkaline solution is largely pseudocapacitive in nature, i.e. is associated mainly with interfacial redox processes. Most of this charge is distributed (as outlined in fig.1 and fig.2) rather broadly over an extended potential range which signifies an energetic heterogeneity with regard to the redox active active sites within the oxide surface. Burke and Healy have developed the reactive surface group concept52 which can be applied to electrocatalysis and in a previous paper we have suggested7 that the voltammetric peaks for both RuO2 and mixed
oxides involving RuO2 may be assigned to a series of redox transformations involving
tightly bound surface oxyruthenium species. Surface oxy groups are known to hydrate or hydroxylate when the oxide is immersed in an aqueous medium53,54 and rapid redox reactions can occur owing to simultaneous loss or gain of electrons and protons (and indeed hydroxide ions). It is not unreasonable to expect that similar oxyiridium species are present within both pure IrO2 films and within IrO2 based mixed oxide layers. Indeed
the chemical composition of IrO2 films formed via thermal decomposition of precursor
salts and in contact with aqueous acid and base solution may not be dissimilar to the anodically generated electrochromically active iridium oxide layers (AIROF’s) prepared via potential cycling of iridium metal in the corresponding aqueous media. The degree of hydration/hydroxylation exhibited by the thermally prepared film may differ substantially from that of its electrochemically prepared analog.
It is well established that thermally prepared RuO2 films exhibit three distinct redox
processes involving RuIII/IV, RuIV/VI and RuVI/VII surface redox transitions. The latter transformation which occurs at elevated anodic potentials prior to the onset of active oxygen gas evolution is most marked in base. The chemistry of anhydrous iridium oxide involves a major charge storage IrIII/IV transition and an IrIV/VI transition prior to the onset of active oxygen evolution.. We would therefore expect that the surface redox chemistry of a mixed oxide in which both components are electroactive, would exhibit rather complex voltammetric behaviour.
Lyons PCCP WJA Issue
2010
Page | 8
oxide interacts with water solvent molecules become bonded to the metal cations which exhibit Lewis acidity resulting in the transfer of a proton to a neighbouring oxygen site. Undissociated water molecules may also be present. Hence the oxide surface is extensively hydroxylated. It was determined that only oxycations at certain sites (presumably sites of low coordination such as kink or ledge sites) are capable of participating in the redox reactions giving rise to the peaks observed in the recorded voltammetric response. The important factor seems to be the ability of the latter type of cations to extensively coordinate water molecules. Inactive ruthenium or iridium species would exhibit a higher degree of oxygen bridging type coordination and would presumably exist along terrace sites. These ideas emphasing the important role of hydration in determing the difference between active and inactive surface bonded groups led to the designation of the former as surfaquo groups. Although the structure of such active surfaquo groupsis unknown it is very likely that the linkage to the surface involves one or more oxygen bridges to generate the following type of hydrous species (the bridging oxygens being represented here by –O-):
(-O-)2RuO2(OH2)2↔ (-O-)2RuO(OH)2(OH2) ↔ (-O-)2Ru(OH)4
The structures presented above correspond to the Ru(VI) surfaquo species. Such equilibria between hydrated oxides, oxyhydroxides and hydroxides are well established for hydrated oxides. The redox behaviour of such surface immobilized oxyruthenium groups is assumed to involve the simultaneous loss or gain of protons and electrons and be represented by the following equations
RuIII/IV : (-O-)2RuOH(OH2)3Æ (-O-)2Ru(OH)2(OH2)2 + H+ + e
-RuIV/VI : (-O-)2Ru(OH)2(OH2)2Æ (-O-)2Ru(OH)4 + 2H+ + 2e
-RuVI/VII : (-O-)2Ru(OH)4 Æ (-O-)2RuO(OH)3 + H+ + e
-The standard potentials of the latter transitions are typically 0.45V, 1.0 V and 1.4 V (all quoted with respect to the reversible hydrogen reference electrode RHE). A similar assignment may be made for the IrIII/IV redox transition as follows:
-Lyons PCCP WJA Issue
2010
Page | 9
Furthermore, at more anodic potentials the IrIV/VI redox transition may well come into play:
(-O-)2Ir(OH)2(OH2)2Æ (-O-)2Ir(OH)4 + 2H+ + 2e
While the latter expressions explain the high degree of reversibility exhibited by the redox peaks, they do not provide a rationale for the proposed acid/base character of the metal oxides7 as evidenced by the observed shifts in voltammetric peak potentials with changes in the solution pH. The potential-pH dependence for oxide systems in general is usually quoted as 59 mV per unit change in pH at 298K. This type of behaviour is typified by the Hg/HgO system55, which is frequently used as a reference electrode in alkaline solution. Murphy58 has shown for pure RuO2 electrodes that the shift in peak
potential maxima with changes in solution pH for the lower redox transitions are typically 15 mV per pH unit with respect to a hydrogen reference electrode in the same solution or about 75 mV per pH unit for a pH independent reference electrode. Such a result‡ is not in good agreement with typical oxide behaviour from which no change in peak potential with respect to a hydrogen reference electrode in the same solution would be expected on altering the pH. Even greater potential- pH shifts have been observed for hydrous oxide films. These have been interpreted in terms of hydrolysis effects55-57, i.e. the effect of loss of protons from water molecules co-ordinated to the cation. The effect is assumed to be greater for the oxidized state of the redox couple where the greater charge density on the cation facilitates proton loss from coordinated water molecules. Consequently the 5/4(2.303RT/F) V shift observed previously for the RuIII/IV and RuIV/VI transitions can be rationalised by invokation of the following reaction schemes:
(-O-)2RuOH(OH2)2Æ (-O-)2Ru0.25-(OH)2.25(OH2)1.75 + 1.25 H+ + e
(-O-)2Ru0.25-(OH)2.25(OH2)1.75Æ(-O-)2RuO0.75(OH)3.25 + 2.5 H+ + 2e
Lyons PCCP WJA Issue
2010
Page | 10
(-O-)2RuO-(OH)3 + (1+x)OH-Æ (-O-)2RuO(O-)1+x(OH)2-x+(1+x)H2O + e
-Consequently, the potential – pH response for the RuVI/VII transition is given by (1+x)(2.303RT/F) V per unit change in pH. The extent of hydrolysis is apparently lower in the case of thermally prepared films; the bonding of the oxycations to the rigid, anhydrous, highly conducting RuO2 lattice evidently affects the hydrolysis process.The
precise manner by which the oxide lattice affects the hydrolysis of the surface groups has yet to be established unambiguously. For hydrolysis reactions in general the charge on the central metal ion is important and the resulting electric field around the hydrolysis site may be slightly reduced by interactions with the highly mobile electrons in the solid. Alternative factors which may be of importance are: (i) a more limited access (and therefore influence) of OH- ions to the surface bonded species, (ii) the two bridging oxygens in the surface groups are not protonated at any stage (consequently the remaining hydrogen atoms are less likely to be removed) and (iii) some of the remaining hydrogen atoms may be partly stabilized by interactions either with the surface or other nearby surface groups.
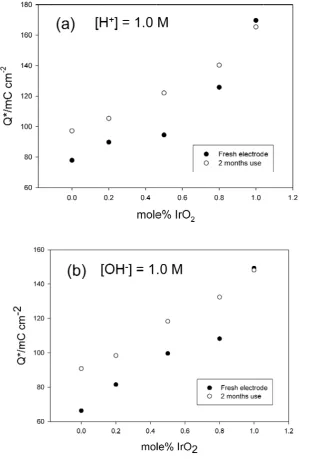
The integrated voltammetric charge Q* determined between pre-defined limits (usually 0.30 – 1.25 V (vs RHE)) has been shown to be a useful indicator of active surface area. We outline in fig.3 and fig.4 the variation of Q* with oxide composition for a series of IrxRu1-xO2 electrodes. The data was obtained both for freshly prepared oxide electrodes
and for ‘aged’ electrodes (i.e. electrodes which had been subjected to electrochemical polarazition studies in the oxygen evolution region for a 2 month period). Data is presented for 1.0 M H2SO4 and 1.0 M NaOH (fig.3(a) and 3(b) and in 0.1 M. H2SO4 and
0.1 M NaOH (fig.4(a) and 4(b)).
Insert fig.3 and fig.4 here.
It is well established that Q* depends on the calcination temperature and the values determined in the present work corresponding to a calcination temperature of 425˚C are in excellent agreement with previously published values for RuO2 and IrO2 electrode
materials58-61. It is clear from this voltammetry data that Q* is largest for a pure IrO2
Lyons PCCP WJA Issue
2010
Page | 11
observed for the mixed oxide materials IrxRu1-xO2 for decreasing values of x in the range
0.8-0.2. It is also significant that Q* increases on aging for every oxide composition with the exception of pure IrO2. This effect is observed regardless of whether the voltammetric
experiment is performed in dilute of concentrated acid or base. Hence we can conclude that active oxygen discharge can promote the wettability of the oxide surface since the increase in Q* value implies an increase in active surface area of the material with the electrolyte being able to access a greater proportion of the oxycations in the oxide lattice. This increase in Q* is most marked for pure RuO2 electrodes ans is not readily apparent
for pure IrO2 films. It has been suggested that Q* is related to the surface concentration of
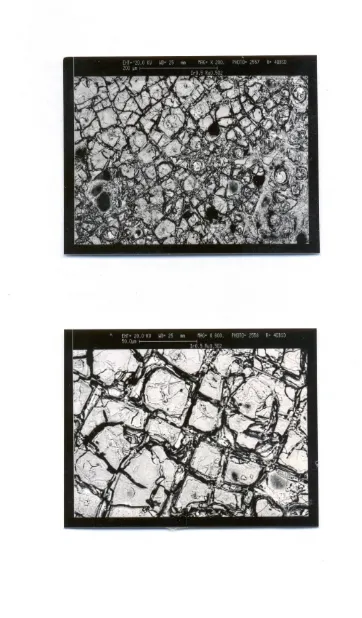
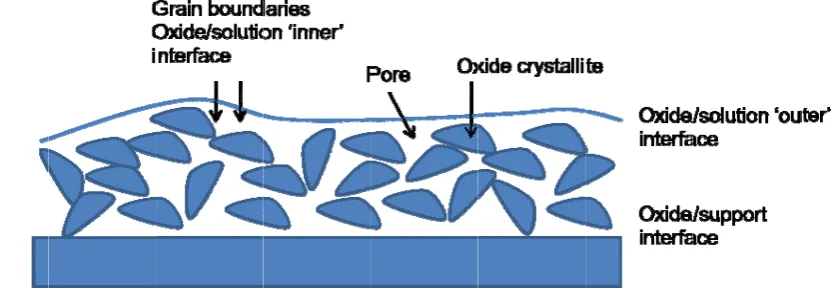
active sites60. The morphology of the supported oxide layer can be imaged directly using SEM methods and the results for an Ir0.5Ru0.5O2 electrode are outlined in fig.5. The
general morphology of a supported oxide layer is outlined schematically in fig.6. The high hydrophilicity of oxide surfaces is demonstrated by the capability of water molecules to penetrate into the layer through cracks, pores and grain boundaries, all of which contribute to the inner surface.
Insert fig.5 and fig.6 here.
The layer is made up of oxide crystallites separated by highly defect regions. Pores may also be present. Trasatti60 has noted that three types of interface must be considered. The first involves the oxide/solution macroboundary or outer surface. The second is the oxide/solution microboundary which arises on account of liquid penetration into pores and intergrain regions. This defines the inner surface. One finally must consider the oxide layer//support electrode interface. The first two interfaces are importance with respect to electrocatalysis whereas the third interface is important with respect to the mechanical stability of the oxide electrode. It has been experimentally established that the experimentally measured value of Q* depends on the potential sweep rate, the former increasing significantly in magnitude as the value of the latter decreases61. This suggests that increasing fractions of the inner surface of the oxide film becomes electroactive as the experimental timescale increases due to the diffusion of water molecules through cracks, pores and grain boundaries and subsequent acid/base reaction between bound metal oxyhydroxide groups and protons according to:
Lyons PCCP WJA Issue
2010
Page | 12
Indeed Trasatti and co-workers61 have envisaged the proton diffusion being described in terms of a surface Grotthus mechanism along the pore and crack walls, the process being facilitated by the presence of readily dissociatiable surface OH groups. Hence by analogy with the situation pertaining in solution it is to be expected that the mobility of H+ is considerably higherthan that of OH- and so access to inner surface sites is easier for free protons than for other proton donating species. Hence it would be expected that Q* values would be lower in alkaline solution than in acidic. This prediction is borne out in the present work where for pure freshly prepared IrO2 and RuO2 films, voltammetric
experiments performed in 1.0 M H2SO4 and NaoH suggest on analysis that the ratio
Q*acid/Q*base = 1.14 and 1.17 respectively. The corresponding ratio values for IrxRu1-xO2
mixed oxides were 1.16, 1.02 and 1.10 for x = 0.8, 0.5 and 0.2 respectively. It is expected that the Q* ratio should increase the more porous the oxide layer is61. Similar data were obtained for voltammetric experiments performed in more dilute dilute electrolyte solutions (0.5 and 0.1 M respectively). Hence we conclude that Q* depends not only on the calcination temperature but also on the solution pH and is a very useful parameter to facilitate characterization of the interfacial properties of metal oxide films in aqueous solutions.
Steady state Tafel plot analysis , reaction order studies and open circuit potential decay
measurements of the oxygen evolution reaction (OER) at IrO2, RuO2 and IrxRu1-xO2
mixed oxide electrodes in aqueous acid and base
The mechanism of anodic oxygen evolution at the thermally prepared oxide electrode surfaces in contact with aqueous acid and alkaline solution was examined using a variety of traditional electrochemical measurements such as steady state Tafel plot analusis, reaction order studies and examination of open circuit potential decay transients. Such methods have been shown to be extremely effective in aiding the assignment of mechanism of complex multistep, multielectron transfer surface electrochemical reactions such as the OER62.
Insert fig.7 and fig.8 here.
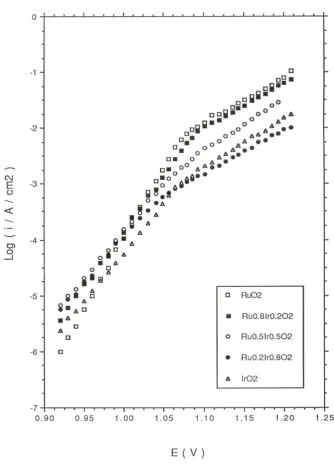
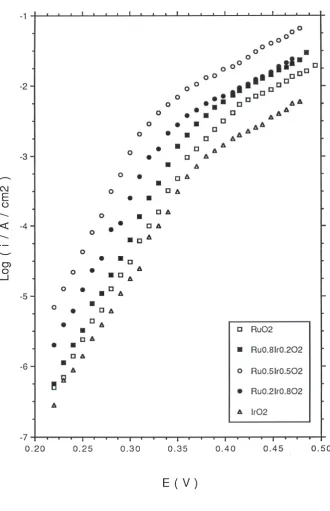
Typical tafel plots recorded in 1.0 M H2SO4 and 1.0 M NaOH at T = 293 K for IrO2,
Lyons PCCP WJA Issue
2010
Page | 13
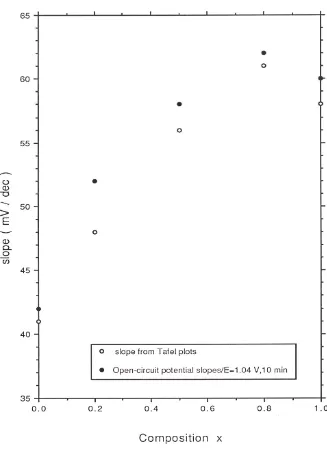
in figure 7 and figure 8 respectively. The potential was applied (in 10 mV step increments) in a direction from more anodic to less anodic values and the steady state value of the current was read after a period of 5 minutes application of the particular potential. Two distinct linear regions may be discerned in the Tafel plots recorded both in acid and base for all oxide compositions. The transition potential between the low and high Tafel slope region is also quite marked. In 1.0 M acid solution the Tafel slope varied from 39 mV/dec for pure RuO2 to 58 mV/dec for pure IrO2 and a regular increase in Tafel
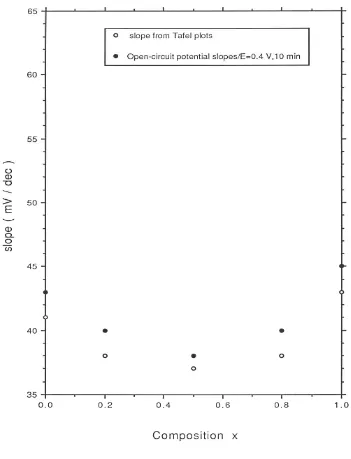
slope with iridium content x in the oxide was observed in acid solution (figure 9). In 1.0 M NaOH a Tafel slope of 41 mV/dec was obtained at low potential for pure RuO2
electrodes. A Tafel slope of ca.43 mV/dec was determined at low potential for pure IrO2
and slightly lower values measured for the mixed oxide electrodes (38 mV/dec for x = 0.2, 37 mV/dec for x = 0.5 and 37.5 mV/dec for x = 0.8). The variation of Tafel slope with oxide composition in 1.0 M NaOH is presented in fig.10. The Tafel slope recorded at higher anodic potentials in acid is typically close to 120 mV/dec for all oxide compositions and increases to ca. 140 mV/dec in alkaline solution. In acid solution is is noteworthy that the transition from low to high Tafel slope occurs later (at E = 1.08V) for RuO2 and Ir0.2Ru0.8O2 electrodes in comparasion with IrO2 and Ir0.8Ru0.2O2 electrodes
where the transition potential is located at E= 1.04 V. A similar observation pertains to alkaline solutions: the second Tafel region occurs later for pure RuO2 (E = 0.42 V)
compared with pure IrO2 (E = 0.37V).
Insert fig.9 and fig.10 here.
Lyons PCCP WJA Issue
2010
Page | 14
potential regions straddled the transition potential between the low and high tafel slope regions observed in the Tafel plots. In all casews after switching off the potentiostat the electrode potential was measured at various time intervals using a high impedance voltmeter, which was disconnected between readings in order to avoid any forced discharge. Typical results for pure RuO2 in 1 M H2SO4 and 1 M NaOH are presented in
figure 11 and figure 12 and correspondingly for pure IrO2 in figure 13 and figure 14
respectively. Similar results to those presented in fig.11-14 were obtained for the mixed oxide materials IrxRu1-xO2 (x = 0.8, 0.5 and 0.2). As is clear from fig.11-fig.14 well
defined exponential decays and excellent linear plots of E versus log t were obtained. For all oxide systems examined in acid and base slopes obtained from the E versus log t curves were slightly lower in magnitude by ca. 2 mV/decade as compared with those derived from steady state polarization measurements. These values are also presented in figure 9 and figure 10.
Insert fig.11 and fig. 12 here. Insert fig. 13 and fig.14 here.
Steady state polarization measurements were performed for the range of mixed oxides IrxRu1-xO2 in acid and base over a range of acid and base concentrations in order to
extract reaction order data. Biphasic dual slope Tafel plots where observed for the range of acid concentrations studies (0.1 M, 0.5 M and 1.0 M H2SO4). For all mixed oxide
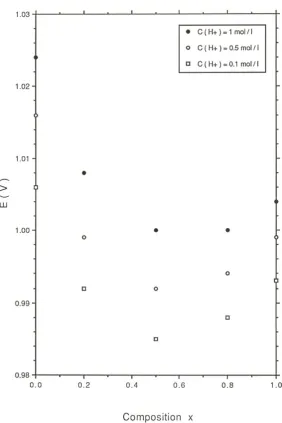
compositions examined, at any given potential in the low Tafel slope region, the corresponding current density was observed to scale with acid concentration, and decreased with decreasing acid concentration value. In contrast the current density remained invariant with acid concentration in the high Tafel slope region. A similar result was found to pertain when the polarization experiments were performed in alkaline solution. Again the current in the high Tafel slope region remained independent of base concentratiuon. The variation of oxygen evolution potential at a fixed oxygen evolution rate (expressed as a current density) of i = 10-4A/cm2 with oxide composition for a series
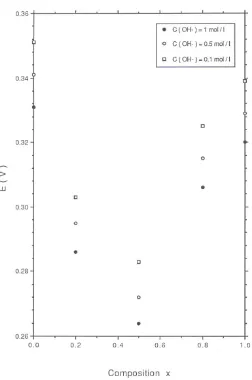
of IrxRu1-xO2 electrodes in 0.1, 0.5 and 1.0 M H2SO4 is presented in figure 15. The
Lyons PCCP WJA Issue
2010
Page | 15 = 0.5.
Insert fig.15 and fig.16 here.
In a further series of experiments it was found that for any oxide composition the oxygen evolution potential at a constant current density increased linearly with increasing acid concentration and decreased linearly with increasing base concentration. Typical results are presented for RuO2 and IrO2 electrodes in fig.17 and fig.18.
Insert fig.17 and fig.18 here.
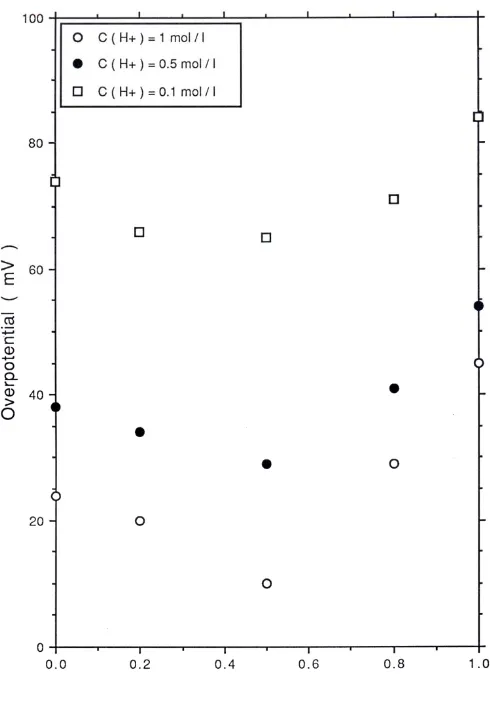
The exchange current density for oxygen evolution was also found to vary with oxide composition both in acid and base solution. The maximum exchange current density was found for the IrxRu1-xO2 electrodes with x = 0.5. Furthermore for every x value exchange
current densities were larger in acid solution than for base solutions. Furthermore the variation in OER overpotential for IrxRu1-xO2 electrodes as a function of mixed oxide
composition and over a range of concentrations are presented in fig.19 (acid solutions) and fig.20 (alkaline solutions). Again the minimum overpotential is observed for the x = 0.5 composition in acid and alkaline media. Furthermore the overpotential was found to be lower in 1.0 M H2SO4 (η = 10 mV) than for more dilute acid ([H+] = 0.1 M, η = 65
mV). The converse pertained in base where for [OH-] = 1.0 M, η = 124 mV whereas for
[OH-] = 0.1 M, η = 83 mV. This data is summarized in table 1.
Insert fig.19 and fig.20 here. Insert table 1 here.
It is reasonable to use Q* as a measure of the real surface area of the oxide electrode.
Conseuqently the parameter i Q*was chosen to estimate the actual electrocatalytic
activity of the oxide electrode. The variation of i Q*recorded at a fixed potential of 1.1
V in 1.0 M H2SO4 with oxide composition x is presented in fig.21 . The same factor
recorded at a potential of 0.3 V in 1.0 M NaOH is outlined in fig.22. We note from fig.21
Lyons PCCP WJA Issue
2010
Page | 16
decreases for higher x values corresponding to the iridium oxide rich layers. This behaviour is in contrast to the observed variation in Tafel slope value which varies from ca. 40 mV/dec for x = 0 (pure RuO2 films) to 57 mV/dec for x = 1 (pure IrO2 material). It
is the common contention that the higher the value of Tafel slope the less efficient the
electrocatalytic activity, and so in acid solution the parameter i Q* and Tafel slope do
not match each other as the oxide composition is varied. The situation observed in alkaline solution (fig.22) is different however. Here log(i Q*)admits a maximum value
for x = 0.5. This scales directly with the observed Tafel slope behaviour where a minimum Tafel slope of ca. 37 mV/dec is observed for x = 0.5. Further work will have to be done to further develop these interesting observations.
Insert fig.21 and fig.22 here.
In a final series of kinetic experiments we examined the effect of [H+] and [OH-] concentration on the oxygen evolution rate at fixed potential. Potentials in the low Tafel slope region were chosen, typically 0.95, 0.98 and 1.01 V in acid solution and 0.25, 0.27 and 0.29 V in base. Electrolyte concentrations of 0.1, 0.3, 0.5, 0.8 and 1.0 M concentration were chosen and constant ionic strength conditions were employed in order to minimize diffuse double layer effects. Hence appropriate amounts of Na2SO4 and NaCl
were added to H2SO4 and NaOH to ensure an ionic strength of 1.0 M when the hydrogen
and hydroxide ion concentrations were variied. Tafel slopes obtained under conditions of constant ionic strength were the same as those extracted from polarizaton measurements where the ionic strength was allowed vary. In all cases linear plots of logiversus logcH+
or log
OH
c − were obtained. Typical examples for RuO2 and IrO2 are presented in fig.23
and fig.24.
Insert fig.23 and fig.24 here.
In acidic media the mixed oxide composition seems to influence the reaction order. We found that the reaction order decreased from a value of – 3/2 for pure RuO2 (where the
Tafel slope is 40 mV/dec) to a value of – 1 for pure IrO2 where the Tafel slope had a
Lyons PCCP WJA Issue
2010
Page | 17
the Tafel slope) admitted values intermediate between these two extreme values as outlined in fig.25. In contrast in alkaline solution the reaction order was found to remain reasonably constant and close to 1 regardless of the oxide composition as illustrated in fig.26.
Insert fig.25 and fig.26 here.
The classical approach to the oxygen evolution reaction (OER) has usually been in terms of the formation of discrete adsorbed intermediates such as OH radicals, which subsequently react with other intermediates or with the electrolyte to liberate oxygen gas. According to this adsorption type approach, if the stability of the adsorbed intermediate formed in the primary discharge step can be increased, then the rate control can shift to a later step. Thus the kinetics of oxygen generation on ruthenium66, which possesses substantial electrocatalytic activity in acid solution (b = 2.303RT/2F) has been interpreted in terms of direct interaction between strongly adsorbed hydroxyl groups, while the behaviour of platinum67 which is an intrinsicallyinferior electrocatalyst in acid solution [b = 2(2.303RT/F)], is usually rationalized in terms of rate determining radical generation in the primary step. More recently the concept of the cyclic formation/decomposition of higher valent state surface bonded oxycation moeities in the oxygen evolution pathway has received attention since the early work of Burke, Lyons and McCarthy68. This type of approach has received attention especially in connection with electrocatalysis exhibiting relatively low Tafel slope values, where, according to a more conventional interpretation, only strong surface intermediate adsorption interaction is considered to be involved. It is useful at this stage to summarize the diagnostic mechanistic parameters obtained in the present work. Pure RuO2 electrodes (corresponding to x = 0) exhibit low overpotential
Tafel slopes close to 40 mV/dec or more generally 2(2.303RT/3F) V/dec both in acid and base. The reaction order with respect to the hydronium H+ ion at low pH, mH+ = (d log i /d
log cH+)E = - 1.5 and at high pH the reaction order with respect to hydroxide ion OH-,
mOH- = (d log i / d log cOH-)E = 1.0. The latter quantities are defined at fixed elctrode
potential E. In contrast for pure IrO2 (corresponding to x = 1) the low overpotential Tafel
slope in acid is close to 60 mV/dec or more generally 2.303RT/F. Furthermore, the reaction order with respect to the hydronium H+ ion at low pH, mH+ = (d log i /d log cH+)E
Lyons PCCP WJA Issue
2010
Page | 18
i / d log cOH-)E = 1.0. The corresponding Tafel slope was close to 40 mV/dec. The
situation for the mixed oxide system IrxRu1-xO2 (0.2 < x , 0.8) is more complex. The
reaction order exhibited values intermediate between the two extremes of – 1.5 and – 1.0 in acid solutions and the value tended to approach unity as the fraction of iridium oxide in the oxide mixture was increased. Tafel slopes showed similar intermediate values for the mixed oxide in acid solutions. In contrast in alkaline solution the Tafel slope remained close to 40 mV/dec over the entire oxide composition range and the reaction order with respect to OH- ion concentration was close to 1.0. At higher overpotential the Tafel slope
for both pure RuO2 and IrO2 , and indeed for the mixed oxide material IrxRu1-xO2 is
expected, frem much previous work , to be close to ca. 120 mV/dec or more generally 2(2.303RT/F) in both acid and alkaline solutiuons.. In the present work the observed Tafel slope at elevated anodic potentials in base was close to 140 mV/dec or 7(2.303RT/3F). This discrepancy between theoretical and observed Tafel slope value at high overpotentials can be attributed to resistive effects brought about by blocking of the electrode surface due to oxygen gas buildup. Hence any mechanism proferred must take account of the latter diagnostic features.
Bearing in mind our previous discussion of the nature of metal surfaquo groups, we suggest the following mechanism for the OER reaction at RuO2 electrodes in acid:
(-O-)2Ru(OH)4 ↔ (-O-)2RuO(OH)3 + H+ + e- fast
(-O-)2RuO(OH)3→ (-O-)2Ru+O(OH)3 + e- slow rds
(-O-)2Ru+O(OH)3↔ (-O-)2RuO(OH)2 + O2 + 2H+ + 2e- fast
(-O-)2RuO(OH)2 + H2O ↔ (-O-)2Ru(OH)4 fast
In base the corresponding mechanism is given by:
(-O-)2RuO-(OH)3+OH-↔ (-O-)2RuO.O-(OH)2 + H2O + e- fast
(-O-)2RuO.O-(OH)2→ (-O-)2RuO2(OH)2 + e- slow rds
(-O-)2RuO2(OH)2 +2OH-↔ (-O-)2RuO2(OH)2+O2 +2H+ + 2e- fast
(-O-)2RuO2(OH)2+ OH- + H2O ↔ (-O-)2Ru(OH)4 fast
Lyons PCCP WJA Issue
2010
Page | 19
second step (quantified by the heterogeneous electrochemical rate constant k’2) is slow
and kinetically rate determining and involves the generation of the unstable Ru(VIII) surface species. We also note that the surfaquo group is linked via two bridging oxygen species (-O-) to the bulk oxide lattice. In these cyclic redox schemes the surface bonded oxyruthenium species is allowed to maintain an octahedral arrangement of oxygen species about the central metal ion. Such a feature, together with ion due to loss of protons or addition of hydroxyl ions, appears to be a characteristic feature of hydrous oxide species. The corresponding mechanisms for IrO2 in acid and base using octahedral oxyiridium
surfaquo groups are outlined below. In acid medium the first two steps in the process involve the following transformations, with the second OH restructuring step being rate determining at low overpotential.
(-O-)2IrO-(OH)(OH2)2 + OH-↔ (-O-)2IrO-(OH*)(OH)(OH2) + H2O + e- fast
(-O-)2IrO-(OH*)(OH)(OH2) → (-O-)2IrO-(OH)2(OH2) slow rds
The rate determining step involves a restructuring process between two energeticxally inequivalent bound hydroxyl groups on the oxide surface. This step will, on kinetic analysis, produce a Tafel slope of 60 mV/dec in agreement with experiment. In base the first two steps involve the following processes:
(-O-)2IrO-(OH)(OH2)2 + OH-↔ (-O-)2IrO-(OH)2(OH2) + H2O + e- fast
(-O-)2IrO-(OH)2(OH2) → (-O-)2IrO(OH)2(OH2) + e- slow rds
These steps involve and initial redox transformation between Ir(IV) and Ir(V) followed by a rate determining step involving generation of an unstable Ir(VI) surfaquo group which serves as a precursor to di-oxygen. The final step is rapid:
(-O-)2IrO(OH)2(OH2) + 3 OH-↔ (-O-)2 IrO-(OH)(OH2)2 + O2+ H2O + 2e- fast
We can follow on from our recent work on the OER reaction at oxidized iron, nickel and cobalt electrodes in base8-12 and write down the following general mechanistic pathway for MO2 electrodes with M = Ru and Ir.
-Lyons PCCP WJA Issue
2010
Page | 20
[MOm(OH)n(OH*)(OH2)y-1]p-→ [MOm(OH)n+1(OH2)y-1]
p-[MOm(OH)n+1(OH2)y-1]p-→ [MOm(OH)n+1(OH2)y-1](p-1)- + e
-[MOm(OH)n+1(OH2)y-1](p-1)- + 2OH-↔ [MOm(OH)n-1(OH2)y-1](p-1)- + O2 + 2H2O + 2e
-MOm(OH)n-1(OH2)y-1](p-1)- + OH- + H2O ↔ [MOm(OH)n(OH2)y]
p-For the RuO2 electrode the initial oxidation state in the sequence is Ru(VI) and so p = 2m
+ n – 6, whereas for IrO2 we begin with Ir(IV) and so p = 2m + n -4. The second step in
the sequence is rate determining for IrO2 in acid whereas the third is rate limiting for IrO2
in base and for RuO2 over the entire pH range. At high overpotentials rate control changes
to the first discharge step for both RuO2 and IrO2 over the entire pH range.
The mechanistic schemes proposed in the present communication can be shown to be in good agreement with experimental data using very elementary kinetic arguments. We consider a surface EE process and assume to a first approximation Langmuir adsorption conditions. We consider for example the situation in base where the second electron transfer step resulting in the formation either of the unstable Ru(VIII) or Ir(VI) surfaquo species is rate limiting. The net reaction flux fΣ is given by:
2
4 SOH
fΣ =i FA= Γk′ (1)
Where ΓSOHdenotes a surface concentration and SOH is identified as the surface species
(-O-)2RuO.O-(OH)2 (Ru(VII) or (-O-)2IrO(OH)2(OH2) Ir(V). We assume that the
heterogeneous electrochemical rate constant obeys the Butler-Volmer equation and so:
[ ]
00 2 0
2 2 2 2
( )
exp F E E exp
k k k
RT
β β ξ
⎡ − ⎤
′ = ⎢ ⎥=
⎣ ⎦ (2)
In the latter expression we have introduced the normalised potential as:
(
0)
F
E E
RT
ξ = − (3)
Now we apply the quasi steady state approximation to SOH to obtain
2
1 1 2 0
SOH
S OH H O SOH SOH
d
k a k a k
dt − −
Γ = Γ′ − ′ Γ − Γ′ ≅
(4)
And so we obtain
2 1 1 2 S OH SOH H O k a
k a k
−
− ′Γ
Γ =
Lyons PCCP WJA Issue
2010
Page | 21
Where ΓS denotes the surface coverage of the Ru(VI) or the Ir(IV) surfaquo group. Hence
the net flux is given by
2 1 2 1 2 4 OH H O
k k a i
f
FA k a k
− Σ
− ′ ′
= =
′ + ′ (6)
If we assume that the heterogeneous electrochemical rate constants for the initial discharge step also obey the Butler-Volmer equation then we write
(
)
(
)
0 1 0 0
1 1 1 1
1
0 0
1 1
0
1 1
exp ( ) exp[ ]
1
exp ( )
exp 1 F
k k E E k
RT
F
k k E E
RT
k
β β ξ
β β ξ − − − ⎡ ⎤ ′ = ⎢ − ⎥= ⎣ ⎦ − ⎡ ⎤ ′ = ⎢− − ⎥ ⎣ ⎦ = ⎡⎣ − ⎤⎦ (7)
If we assume that the symmetry factors all admit the same value then β1=β2 =β and the net
flux takes the value
(
)
(
)
[ ]
[
]
(
)
[ ]
[ ]
[ ]
2 2 2 0 01 2 1 2
0 0
1 1 2 2
0 0 1 2 0 0 1 2 0 0 1 2 0 0 1 2 exp
4 exp 1 exp
exp 2
exp 1 exp
exp exp OH H O OH H O OH H O
k k a i
f
FA k a k
k k a
k a k
k k a
k a k
β β ξ
β ξ β ξ
βξ
β ξ βξ
βξ ξ − − − Σ − − − + ⎡ ⎤ ⎣ ⎦ = = − − + ⎡ ⎤ ⎣ ⎦ ≅ − − + ⎡ ⎤ ⎣ ⎦ ≅ − + (8)
A similar expression may be derived for RuO2 electrodes in acid solution where we can
readily show that:
[ ]
[ ]
2 2
0 0
1 2 1 2
0 0
1 2 1 2
exp
4 exp
S H O S H O
H H
k k a k k a
i f
FA k a k k a k
βξ ξ
+ +
Σ
− −
′ ′Γ Γ
= = =
′ + ′ − + (9)
Now at low overpotentials if 0 0
2 1
k <<k− then eqn.8 reduces to:
(
)
(
)
2 2 0 0 1 2 0 1 0 1 exp 1 4 exp 1 S OH H OH O S OH
k k i
f a
FA k a
K a a
β ξ β ξ − − Σ − −
= ≅ Γ ⎡⎣ + ⎤⎦
= Γ ⎡⎣ + ⎤⎦
(10)
Furthermore the corresponding expression for acid yields the following expression:
(
)
2 0 0 1 1 2 0 1 exp 14 H S H O
k k i
f a a
FA k + β ξ
− Σ
−
= ≅ Γ ⎡⎣ + ⎤⎦ (11)
Lyons PCCP WJA Issue
2010
Page | 22
(
)
2.303
log 1
dE RT
b
d i β F
= =
+ (12)
And the reaction order with respect to hydroxide ion and hydrogen ion activity is
log 1.0 log log 1.0 log OH OH E H H E d i m d a d i m d a − − + + ⎛ ⎞ =⎜⎜ ⎟⎟ = ⎝ ⎠ ⎛ ⎞ =⎜⎜ ⎟⎟ = − ⎝ ⎠ (13)
This kinetic analysis predicts the correct value of the Tafel slope but does not generate the experimentally observed fractional reaction order of – 1.5. Instead if we follow the example of Albery69 and introduce a double layer correction into the expression for the heterogeneous electrochemical rate constant and replace eqn.2 by
[
]
0
0 2 0
2 2 2 2
( *)
exp F E E exp ( )
k k k
RT
β φ β ξ ζ
⎡ − − ⎤
′ = ⎢ ⎥= −
⎣ ⎦ (14)
Where * ln * H RT a F F RT φ φ ζ + = = (15)
We then obtain the following modified expression for the net reaction flux
(
)
0
2 2
4 SOH SOHexp
fΣ =i FA= Γk′ = Γk ⎡⎣β ξ ζ− ⎤⎦ (16) We apply the QSSA to determine the SOH surface coverage and obtain the following
expression in the limit of low overpotential when k2′ <<k−′1:
2
[ ]
2
0 1
1 1 2 0
1
( ) S H Oexp
SOH S H O H
H
k a
k a k a k
k a ξ
+ + − − Γ ′ ′ ′
Γ = Γ + ≅ (17)
Lyons PCCP WJA Issue
2010
Page | 23
[
] [ ]
[
]
( )[
]
2 2 2 0 0 1 2 0 1 0 0 1 2 0 1 0 01 2 1
0 1
exp (1 ) exp 4
exp (1 ) exp ln( ) exp (1 )
S H O
H
S H O
H H
S H O
H
k k a
i f
FA k a
k k a
a k a
k k a
a k
β
β
β ξ ζ
β ξ β ξ + + + + Σ − − − − + − Γ = ≅ + − Γ ⎡ ⎤ = + ⎣ ⎦ Γ = + (18)
Suitable algebraic manipulation of eqn.19 yields that mH+ = − +
(
1 β)
= −3 2 and(
)
(
)
(
)
2.303 1 2.303 2 / 3
b≅ RT +β F = RT F or 40 mV/dec at 298K, if we assume that
0.5
β ≅ . This is in excellent agreement with experiment at low pH. Finally the
mechanistic indicator b=60mV dec/ which is observed for IrO2 in acid medium at low
overpotential can be rationalised by assuming that the purely chemical hydroxyl reorganization step following the initial electrochemical discharge reaction is rate limiting. If we assume that the rate constant for the latter reorganization step is designated as k2 then we can show that
8
2
4 SOH
fΣ =i FA= Γk (19)
In the latter expression ΓSOH*denotes the surface coverage of the oxyiridium surfaquo
[MOm(OH)n(OH*)(OH2)y-1]p- moeity. Again we show that:
2
[ ]
*2
0 1
1 1 2 0
1
( ) S H O exp
S H O
SOH H
H
k a
k a k a k
k a ξ
+ + − − Γ ′ ′
Γ = Γ + ≅ (20)
Hence the net flux assuming that k2 <<k−′1 is
[ ]
2 0 1 2 0 1 exp 4S H O
H
k k a
i f
FA k a + ξ
Σ
−
Γ
= ≅ (21)
Further manipulation results in the assignation that b≅2.303
(
RT F)
and mH+ = −1.0 inexcellent agreement with experiment.
We note that the higher value Tafel slope of ca 140 mV/dec observed for both oxides over the entire pH range at higher overpotentials can be attributed to rate control switching to the first electrochemical step.
If we assume that Ru and Ir type oxymetal surfaquo groups act independently on the electrode surface during the OER reaction then we can propose that the observed Tafel slope in the corresponding mixed oxide would be given by : bobs =xbIr + −(1 x b) Ruwhere x denotes
Lyons PCCP WJA Issue
2010
Page | 24
that bRu = 40 mV/dec and bIr = 60 mV/dec in acid then bobs = 50 mV/dec. We note however
from table 1 that Tafel slopes for the x = 0.5 mixture are all close to 60 mV/dec , and does not depend on the value of the acid concentration. Indeed the observed Tafel slope reflects the influence of the iridium oxide component more than that of the nominally more catalytically active (when defined in terms of Tafel slope value) ruthenium oxide component even when x (the iridium oxide mole fraction) is as low as 0.2. Hence we conclude that the mixed oxide surface layer in acid may possibly be enriched with the iridium component. In base the Tafel slopes for both RuO2 and IrO2 are both close to 40 mV/dec and so we predict
that the observed value of the Tafel slope should remain independent of the oxide composition.
Since the techniques available for obtaining in situ structural information about species present at the electrode/solution interface are still relatively limited then the mechanisms outlined in the previous paragraphs must be regarded as somewhat speculative even though they are based o72,73n sound chemical principles. It must be noted that the oxidation states proposed to be involved in the oxygen evolution reaction (IV, VI, VII and VIII) are well established both for ruthenium and Iridium (V and VI) under highly oxidizing conditions70. No trace of a peak for the RuVII/VIII or IrIV/VItransitions are observed in cyclic voltammograms recorded for RuO2, IrO2 or the IrxRu1-xO2 mixed oxide
electrodes in alkaline solution. While this may be due to the fact that the RuVIII or IrVI species are extremely unstable in alkaline solutions of high pH (and therefore their formation would be reflected only in terms of the current associated with the evolution of their decomposition product, i.e. molecular oxygen gas), it would also be due to the fact that the formation of these particular species extends over a considerable potential range, the lower end of which either overlaps with, or commences just above, the peaks observed for the RuVI/VII transition or the IrIII/IV transition. Indeed it has been suggested71 that the reason why hydrous Ir(IV) oxide is electronically conducting while the corresponding iridium(III) oxide is electrically insulating, is that the higher oxide is non-stoichiometric, i.e. a mixture of Ir(V) or Ir(VI) oxide in a predominately Ir(IV) oxide
lattice. Similarly, in the case of anhydrous β-nickel hydroxide, the oxidized form is virtually pure Ni(III) (the metal to oxygen ratio being given as NiO1.5. However in the
case of the hydrated nickel hydroxide the oxidized (γ) form has a significantly different ratio NiO1.85; the latter apparently containing a significant Ni(IV) content. It is significant
Lyons PCCP WJA Issue
2010
Page | 25
redox transformation is observed.
The change in Tafel slope observed at higher potentials for the oxygen evolution reaction for all the oxide systems examined in the present work can be attributed to saturation of the surface with regard to coverage by an intermediate such as the Ru(VII) surfaquo species (-O-)2RuO.O-(OH)2 or the Ir(V) surfaquo species (-O-)2IrO(OH)2(OH2).
A new rate determining step, possibly direct OH- ion discharge at less active regions of the metal oxide surface then predominates at more anodic applied potentials. We have noted many times that the oxygen evolution rate reaches a maximum at current densities in the region of 1 A/cm2, this limiting value being determined by screening of the electrode surface by a vigorously evolving stream of gas bubbles. This bubble screeniing may also account for the somewhat higher value of 140 mV/dec observed in most experiments rather than the theoretically expected diagnostic factor of ca. 120 mV/dec. Our experimental studies have indicated that the potential for oxygen evolution recorded at a fixed oxygen evolution rate (typically at either 10-5 or 10-4 A/cm2) decreases in a linear manner with increasing OH- ion concentration over the range 0.1 – 1.0 M. This effect is observed both for the mixed oxide material IrxRu1-xO2and for the pure RuO2 and
IrO2 materials. In contrast the oxygen evolution potential recorded in acid solution at
OER rates of 10-5 or 10-4 A/cm2 was found to increase in a linear manner with acid concentration both for the mixed oxide material IrxRu1-xO2and for the pure RuO2 and IrO2
materials. The latter observation may be rationalised by assuming that the increase in concentration of sulfate species lowers the activity of water at the oxide/solution interface. This factor would then give rise to an inhibition of the oxygen evolution reaction. On the other hand we note that increasing the base concentration will increase the OH- activity at the oxide/solution interface, thereby decreasing the overpotential and enhancing the rate of the oxygen evolution reaction.
A more detailed interpretation of the manner in which the base concentration influences the rate of oxygen evolution can be obtained by recalling a previously published observation on the voltammetry of thermally prepared RuO2 electrodes in base (fig.2(a)
Lyons PCCP WJA Issue
2010
Page | 26
at the oxide surface is enhanced, since, even though the operating potential is constant, the voltage difference between the latter and the reversible Ru(VI/VII) peak is greater in the more strongly alkaline solutions. Thus the slow step represented by:
(-O-)2RuO.O-(OH)2→ (-O-)2RuO2(OH)2 + e-
is faster in strong base , and this, together with the greater availability of hydroxide ions, could well explain the enhancement of the OER in more strongly alkaline solutions. A similar effect may well operate in the mixed oxide and pure IrO2 solution. We have
previously stressed that the overpotentials observed in the present work are not oxygen overpotentials. In fact from the viewpoint of electrode kinetics the gas evolution reaction may be regarded almost as an incidential subsequent reaction whose main importance lies in the fact that it results in the regeneration of the lower state of the surfaquo redox active group . With regard to the rate determining step and the magnitude of the overpotential, the important reference point (which we have shown previously to depend both on base concentration and solution temperature6) is the potential for the reversible RuVI/VII transition.
Steady state measurements of electrode processes are often complemented by studies on the decay of e.m.f on open circuit (OCPD technique) which can also in many cases, characterise the kinetics and mechanism of the basic process involved in the electrode reaction. The approach is frequently adopted in cases where elucidation of reaction mechanisms by steady state polarization techniques is complicated by continuous alteration of the electrode surface with time. In the OCPD experiment one fixes the potential of the working electrode to a certain value and at t = t0 cuts off the current and
observes the decay of the potential. Now since the total observed current consists of the
sum of the capacitative and Faradaic contributions i= +iC iF, and after the current is
turned off i=0 so iC = −iF . Since the double layer capacitance is given by CDL =dq dη,
then −i dtF =dq=C dDL η. For a net anodic reaction with η>RT F then
[
]
0exp DL
i β ηF RT dt C dη
− = and integrating over the time duration of the decay
experiment we get:
[
]
0 0 0 exp t t DL t
i dt C F RT d
η
η
β η η
−
∫
=∫
− . Now if t>>t0 and η0 >>ηtthen:{
}
[
]
0 DL exp t
i t=C RT βF −β ηF RT . The latter may be solved for the overpotential to
Lyons PCCP WJA Issue
2010
Page | 27
0
ln DL ln
t
C RT
RT RT
t
F Fi F
η
β β β
⎧ ⎫
= ⎨ ⎬−
⎩ ⎭ (22)
Hence under the stated conditions a plot of ηt versus lnt gives the symmetry factor or
transfer coefficient β and hence the Tafel slope b. The intercept of the OCPD plot will
yield the exchange current i0 provided that the double layer capacitance CDL is known.
We assume here that during the decay the double layer capacitance remains constant. If it
does then the plot of ηt versus lnt will be linear and have the slope b=RT βF.
The loss of charge capacity under open circuit conditions displayed by hydrated films is assumed to be a consequence of the fact that most of the charge storage region is located above the thermodynamic potential for the decomposition of water. Self discharge is assumed to proceed by an electrochemical mechanism analogous to that of corrosion, i.e. by the simultaneous occurrence of anodic and cathodic reactions as a mixed potential via a local cell mechanism. In such systems either the anodic or cathodic process tends to be rate limiting and a potential corresponding to one or the other of the processes is set up. For example, the open circuit potential decay of hydrous multilayer rhgodium oxide films in strongly alkaline solution can be rationalized in terms of the following reaction scheme74:
2 2
,
2 2
( )
( ., ) ( ) ( ., )
( ., ) ( ., ) e H ( ., ) ( ., )
S OH SOH e lattice
RhO hydr surf e lattice H O RhOOH hydr surf OH
RhOOH hydr surf RhO hydr bulk RhO hydr surf RhOOH hydr bulk
− + − − − − + → + + + → + ⎯⎯⎯→ + ←⎯⎯⎯ +
Oxygen evolution proceeds by the overall reaction:
( )
2 22SOH → 1 2 O +H O+2S
Lyons PCCP WJA Issue
2010
Page | 28
RuO2 rich mixed oxide films, reduction of Ru(VIII) and Ru(VII) surfaquo species
according to the reactions:
(-O-)2RuO2(OH)2 + e-Æ (-O-)2RuO.O-(OH)2
(-O-)2RuO.O-(OH)2 + H2O + e- Æ (-O-)2RuO-(OH)3 + OH
-The corresponding reactions for pure IrO2 and IrO2 rich mixed oxide films involve
reduction of Ir(VI) and Ir(V) surfaquo species:
(-O-)2IrO(OH)2(OH2) + e- → (-O-)2IrO-(OH)2(OH2)
(-O-)2IrO-(OH)2(OH2) + H2O + e- → (-O-)2IrO-(OH)(OH2)2 + OH
-Again these latter processes are assumed to be rapid compared with the OER. It is important to note that unlike the situation outlined for hydrous rhodium oxide films the reduction does not proceed to any extent into the bulk of the thermally prepared film but remains essentially localized in the outer hydrated surface region of the film. The similarity of the slopes of the E vs log t and Tafel plots for OER suggests that the OER kinetics are similar in both cases.
The variation of Tafel slope and OPD b parameter are presented in fig.9 and fig.10 as a function of oxide composition. In these results it is clear that for all oxide compositions, and in both acid and base, the b factor derived from OPD curves is slightly larger than that derived from analysis of steady state Tafel plots. According to theoretical considerations the slope of the open circuit potential decay curve will be identical to the Tafel slope only if the electrode capacitance (i.e. the surface capacitance) remains constant during the decay., i.e. under conditions where the coverage by intermediates in the rate determining step is independent of potential. The slight dissimilarity between the OPD slopes and the Tafel slopes observed in fig.9 and fig.10 could possibly be due to a slight dependence of surfaquo group coverage on potential74,75.
Conclusions
Lyons PCCP WJA Issue
2010
Page | 29
importance lies in the fact that it results in the regeneration of the lower state of the surfaquo redox active group . This key concept has not been sufficiently appreciated in work reported to date.
Notes and references
‡ The peak potential maxima (measured vs RHE scale) recorded for pure RuO2 electrodes are
RuIII/IV : 0.5 V (base) and 0.7 V (acid); RuIV/VI : 1.0 V (base) and 1.3 V (acid); RuVI/VII: 1.35 V (base), not onserved in acid. Here acid refers to 1.0 M H2SO4 and base refers to 1.0 M
NaOH.
1 K.Zeng, D. Zhang, Prog. Ener., Comb. Sci., 2010, 36, 307.
2 H. Tributsch, Int. J. Hyd. Ener., 2008, 33, 5911.
3 G.W. Crabtree, M.S. Dresselhaus, M.V. Buchanan, Physics Today, December 2004, pp.39-44.
4 J.Ohi, J. Mater. Res., 2005, 20, 3180.
5 D.E. Hall, J. Electrochem. Soc., 1983, 130, 317.
6 M.E.G. Lyons, L.D. Burke, J. Chem. Soc., Faraday Trans. I, 1987, 83, 299 (Part 1 of
the present series of papers).
7 A. Michas, F. Andolfatto, M.E.G. Lyons, R. Durand, Key Engineering Materials, 1992, 72-74, 535.
8 M.E.G. Lyons, M.P. Brandon, J. Electroanal. Chem., 2010, 641, 119.
9 M.E.G. Lyons, M. P. Brandon, Phys.Chem.Chem. Phys., 2009, 11, 2203.
10 M.E.G. Lyons, M.P. Brandon, Int.J. Electrochem. Sci., 2008, 3, 1386.
11 M.E.G. Lyons, M.P. Brandon, Int. J. Electrochem. Sci., 2008, 3, 1425.
12 M.E.G. Lyons, M.P. Brandon, Int.J. Electrochem. Sci., 2008, 3, 1463.
13 S. Trasatti, Electrochim Acta, 1984, 29, 1503.
14 K. Kinoshita, Electrochemical Oxygen Technology, Wiley Interscience, New York, 1992.
15 K.A. Denton, J.A. Harrison, R.I. Knowles, Electrochim Acta, 1981, 26, 1197.
16 H.Y. Hall, P.M.A. Sherwood, J. Chem. Soc. Faraday Trans. 1, 1984, 80, 135.
17 J. Augustynski, L. Balsenc, J. Hinden, J. Electrochem. Soc., 1978, 125, 1093.
Lyons PCCP WJA Issue
2010
Page | 30
19 R. Kotz, H.J. lewerenz, S. Stucki, J. Electrochem. Soc., 1983, 130, 825.
20 T. Arikawa, Y. Takasu, Y. Murakami, K. Asakura, Y. Iwasawa, J. Phys. Chem.B., 1998, 102, 3736.
21 M.V. ten Kortenaar, J.F. Vente, D.J.W. IJdo, S. Muller, R. Kotz, J. Power Sources, 1995, 56, 51.
22 F.I. Mattos-Costa, P. de Lima-Neto, S.A.S. Machado, L.A. Avaca, Electrochim. Acta, 1998, 44, 1515.
23 A. Marshall, B. Borresen, G. Hagen, M. Tsypkin, R. Tunold, Electrochim. Acta, 2006,
51, 3161.
24 A. Di Blasi, C.D’Urso, V. Baglio, V. Antonucci, A.S. Arico, R. Ornelas, F. Matteucci, G. Orozco, D. Beltran, Y. Meas, L.G. Arriaga, J. Appl. Electrochem., 2009, 39, 191.
25 Y. Takasu, N. Yoshinaga, W. Sugimoto, Electrochem. Commun., 2008, 10, 668.
26 E. Ratsen, G. Hagen, R. Tunold, Electrochim. Acta., 2003, 48, 3945.
27 S. Song, H. Zhang, X. Ma, Z. Shao, R.T. Baker, B. Yi, Int. J. Hyd. En., 2008, 33,
4955.
28 J.P. Zheng, P.J. Cygan, T.R. Jow, J. Electrochem. Soc., 1995, 142, 2699.
29 A. Burke, J. Power Sources, 2000, 91, 37.
30 M. Winter, R.J. Brodd, Chem. Rev., 2004, 104, 4245.
31 W. Sugimoto, H. Iwata, K. Yokoshima, Y. Murakami, Y. Takasu, J. Phys. Chem. B., 2005, 109, 7330.
32 D.A. McKeown, P.L. Hagans, L.P.L. Carette, A.E. Russell, K.E. Swider, D.R. Rolison, J. Phys. Chem. B., 1999, 103, 4825.
33 A.R. de Souza, E.Arashiro, H. Golveia, T.A.F. Lassali, Electrochim. Acta, 2004, 49,
2015.
34 B.E. Conway, V. Birss, J. Wojtowicz, J. Power Sources, 1997, 66, 1.
35 A.J. Terezo, E.C. Pereira, Mater. Lett., 2002, 53, 339.
36 M.T.M. Koper, J. Electroanal. Chem., 2005, 574, 375.
37 M.T.M. Koper, Faraday Discuss., 2008, 140, 11.
38 C.A. Lucas, M. Cormack, M.E. Gallagher, A. Brownrigg, P. Thompson, B. Fowler, Y. Grunder, J. Roy, V. Stamenkovic, N.M. Markovic, Faraday Discuss., 2009, 140,
41.
39 H. Noguchi, T. Okada, K. Uosaki, Faraday Discuss., 2009, 140, 125.