Normative Values of Cognitive and Physical Function in Older
Adults: Findings from The Irish Longitudinal Study on Ageing
Rose Anne Kenny, MD,* Robert F. Coen, PhD,
†John Frewen, MSc,* Orna A. Donoghue, PhD,*
Hilary Cronin, MD,* and George M. Savva, PhD*
OBJECTIVES: To provide normative values of tests of
cognitive and physical function based on a large sample representative of the population of Ireland aged 50 and older.
DESIGN: Data were used from the first wave of The Irish
Longitudinal Study on Ageing (TILDA), a prospective cohort study that includes a comprehensive health assess-ment.
SETTING: Health assessment was undertaken at one of
two dedicated health assessment centers or in the study participant’s home if travel was not practicable.
PARTICIPANTS: Five thousand eight hundred
ninety-seven members of a nationally representative sample of the community-living population of Ireland aged 50 and older. Those with severe cognitive impairment, dementia, or Par-kinson’s disease were excluded.
MEASUREMENTS: Measurements included height and
weight, normal walking speed, Timed Up-and-Go, hand-grip strength, Mini-Mental State Examination (MMSE), Montreal Cognitive Assessment (MoCA), Color Trails Test, and bone mineral density. Normative values were estimated using generalized additive models for location shape and scale (GAMLSS) and are presented as percen-tiles, means, and standard deviations.
RESULTS: Generalized additive models for location shape
and scale fit the observed data well for each measure, lead-ing to reliable estimates of normative values. Performance on all tasks decreased with age. Educational attainment was a strong determinant of performance on all cognitive tests. Tests of walking speed were dependent on height. Distribution of body mass index did not change with age, owing to simultaneous declines in weight and height.
CONCLUSION: Normative values were found for tests of
many aspects of cognitive and physical function based on
a representative sample of the general older Irish popula-tion.J Am Geriatr Soc 61:S279–S290, 2013.
Key words: geriatric assessment; reference values; cog-nition; gait; bone density; grip; body mass index
T
he comprehensive geriatric assessment (CGA) is now widely used as a multidomain assessment in clinical practice, with various validated tests used to measure med-ical, functional, psychologmed-ical, and social domains.The CGA informs evidence-based, goal-directed, patient-oriented interventions by multidisciplinary teams. In general, clinicians adapt the CGA for local use, and although there are recommended domains for assessment, the tests that are used depend on the setting, local prac-tice, and experience. There is evidence that this targeted approach is superior to general medical assessment. In a recent Cochrane review,1 CGA resulted in lower mortal-ity, greater likelihood of independent living, better long-term cognitive outcomes, and lower rates of institutional care.
Interpretation of the tests used in the CGA relies on the availability of reliable, up-to-date reference or “norma-tive” values that correspond to the range of test scores observed in the population and with which the individual can be compared.
This article provides normative values for a battery of tests that are typical of a CGA and were adminis-tered to a national population-representative sample as part of The Irish Longitudinal Study on Ageing (TILDA). These measures included the Mini-Mental State Examination (MMSE), the Montreal Cognitive Assess-ment (MoCA), executive function measured using the Color Trails Test, height, weight, body mass index (BMI), bone density measured according to heel bone ultrasound, the Timed Up-and-Go (TUG) test, walking speed, and grip strength.
From *The Irish Longitudinal Study on Ageing, Trinity College Dublin; and†Mercer’s Institute for Research on Ageing, St James’s Hospital, Dublin, Ireland.
Address correspondence to Dr. George Savva, The Irish Longitudinal Study on Ageing, Lincoln Gate, Trinity College Dublin, Dublin 2, Ireland. E-mail: [email protected]
DOI: 10.1111/jgs.12195
JAGS 61:S279–S290, 2013 ©2013, Copyright the Authors
METHODS
Sample
The TILDA sample is described in detail in an accompany-ing article within this issue.2In brief, the TILDA cohort is a nationally representative sample of 8,175 adults aged 50 and older (4,431 women). The study sample was recruited based on the RANSAM sampling frame, which is based on the Irish national directory of all residential addresses.3 Geographic clusters were generated, and 640 of these were selected for use in the study, stratified according to area level socioeconomic status and geographical location. Forty addresses were selected within each cluster, and an interviewer visited each. All individuals aged 50 and older living in each selected household were invited to partici-pate in the study. The household response rate was 62.0%. Further details of the study design can be found elsewhere.4
After the home interview, each participant was invited to undergo a comprehensive health assessment at one of two dedicated health assessment centers or in their own home if travel to a center was not practicable. Research nurses conducted assessments. Eight hundred sixty-one (10.5%) participants had a home assessment, and 5036 (61.6%) were assessed in a health assessment center. The home assessment did not include all of the measures included in the health assessment, so a total available sam-ple of 5,897 individuals was available for some measures and 5,036 for others. Characteristics of the health center and home assessment samples are described elsewhere in this issue.5
Inclusion and Exclusion Criteria
Every member of the population of Ireland aged 50 and older living at a private residential address (not in a long-term care institution) was equally likely to be invited to participate in the study. At Wave 1 (baseline), TILDA did not include any participant who could not personally consent to the study, excluding individuals with severe cognitive impairment.
Those with diagnosed dementia, Alzheimer’s disease, or Parkinson’s disease or who scored less than 10 on the MMSE were also excluded from the present analysis (n=62). The normative values are therefore applicable to the community-living population of Ireland without Parkinson’s disease or severe cognitive impairment.
TILDA Health Assessment
Details of the rationale for the selection of tests included in the TILDA assessment and the standardized operational procedures and quality control processes under which they were conducted are described elsewhere.5 A brief descrip-tion of the radescrip-tionale for the test selecdescrip-tion and the methods used to obtain the measures from which norms were calcu-lated is given below.
A panel of experts devised the TILDA test battery with regard to several requirements: first, to incorporate the main elements of a CGA, in particular the domains of cognitive and physical function; second, to maintain a
degree of comparability with previous population-based studies and a relevance to clinical practice; third, to incor-porate recent developments and novel elements; and finally, to be conducted within a reasonable time frame for a single health assessment center visit. The measures reported in the current article include well-known tests that are commonly applied but for which up-to-date nor-mative values do not exist in the Irish population (e.g., TUG test), as well as those for newer tests that are becom-ing more widely adopted but for which normative values have been established in only a small number of cohorts worldwide (e.g., MoCA).
Measures
The Irish Longitudinal Study on Ageing participants are characterized according to the highest level of education attained at any point in their lives. None or primary edu-cation typically corresponds to fewer than 11 years of full-time education. Secondary education is regarded as completion of the junior certificate, group certificate, or leaving certificate and typically corresponds to between 11 and 13 years of full-time education. The final group includes those who completed tertiary education, including any diploma or degree at any time in their lives.
Height was measured using a wall-mounted measur-ing rod (SECA 240, SECA, Birmmeasur-ingham, UK). Height was dichotomized for stratification of grip strength, gait speed, and TUG normative values with the cutoff at the sex-spe-cific median for the sample (173 cm for men and 160 cm for women). Weight was measured using electronic floor scales (SECA), and BMI was calculated as weight/height2 with weight measured in kilograms and height in meters.
The MMSE and MoCA were used to assess global cog-nitive performance. The MMSE is a well-established6 test used to screen for cognitive impairment that includes mea-sures of orientation, registration, attention, calculation, recall, and language. The MoCA7 is known to be more sensitive to mild cognitive deficits than the MMSE when applied in cognitively intact older adults. In addition to the domains that the MMSE measures, MoCA assesses execu-tive function, abstraction, and visuospatial ability. MoCA and MMSE scores range from 0 to 30. Executive function was measured using the Color Trails Test.8 In Task 1, the participant was asked to draw a line connecting a series of 25 numbers that alternate between pink and yellow. In the second task, they were instructed to alternate between pink and yellow colored numbers, avoiding distractors. The completion times for both trail tasks were recorded.
Analysis
Generalized Additive Models for Location, Shape and Scale (GAMLSS)9were used to estimate normative values. GAMLSS are a generalization of the more widely known
generalized linear models. In the current analysis, continu-ous measures are modelled using the Box Cox Power Exponential (BCPE) distribution, while discrete measures are modeled using the negative binomial distribution. The BCPE distribution has four parameters, corresponding to location, scale, skew, and kurtosis of the distribution.10 The negative binomial distribution has two parameters, corresponding to location and dispersion. GAMLSS allows all model parameters to be modelled as functions of the independent variables (e.g., allowing the standard devia-tion as well as the mean of a distribudevia-tion to vary with age and sex). The package gamlss (http://gamlss.org) in statisti-cal software R (R Foundation for Statististatisti-cal Computing, Vienna, Austria) was used throughout.
Age was included as a continuous variable in each of the regression models. To account for the fact that many relationships with age are nonlinear, restricted cubic splines were calculated and used instead of age per se in regression models. This approach breaks age up into groups defined according to “knots” at their boundaries. Between each pair of knots, that is within each age group, the relationship between the outcome of interest and age
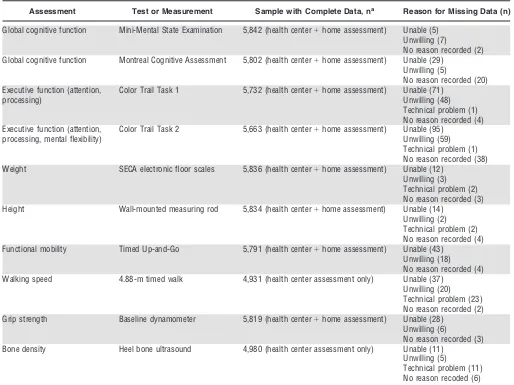
Table 1. Specific Tests and Measures Used and Numbers with Complete or Missing Data for Each Assessment
Assessment Test or Measurement Sample with Complete Data, na Reason for Missing Data (n)
Global cognitive function Mini-Mental State Examination 5,842 (health center+home assessment) Unable (5) Unwilling (7)
No reason recorded (2) Global cognitive function Montreal Cognitive Assessment 5,802 (health center+home assessment) Unable (29)
Unwilling (5)
No reason recorded (20) Executive function (attention,
processing)
Color Trail Task 1 5,732 (health center+home assessment) Unable (71) Unwilling (48) Technical problem (1) No reason recorded (4) Executive function (attention,
processing, mental flexibility)
Color Trail Task 2 5,663 (health center+home assessment) Unable (95) Unwilling (59) Technical problem (1) No reason recorded (38) Weight SECA electronic floor scales 5,836 (health center+home assessment) Unable (12)
Unwilling (3) Technical problem (2) No reason recorded (3) Height Wall-mounted measuring rod 5,834 (health center+home assessment) Unable (14)
Unwilling (2) Technical problem (2) No reason recorded (4) Functional mobility Timed Up-and-Go 5,791 (health center+home assessment) Unable (43)
Unwilling (18) No reason recorded (4) Walking speed 4.88-m timed walk 4,931 (health center assessment only) Unable (37)
Unwilling (20) Technical problem (23) No reason recorded (2) Grip strength Baseline dynamometer 5,819 (health center+home assessment) Unable (28)
Unwilling (6)
No reason recorded (3) Bone density Heel bone ultrasound 4,980 (health center assessment only) Unable (11)
Unwilling (5)
Technical problem (11) No reason recoded (6)
[image:3.595.44.558.340.725.2]varies as a third-order polynomial. These polynomials are constrained to join smoothly at each knot, creating a smooth continuous function, the complexity of which depends on the number of knots,k, used in its estimation. In practice, k-1 continuous variables, which when entered into a linear regression model yield the nonlinear relation-ship with age as described above, replace the continuous variable “age.” The additional covariates considered for each model include sex, level of education (for cognitive tests), and height (for tests of walking speed and strength). Interaction terms between all covariates and between age and each covariate as well as higher-order interactions were also considered.
Selecting the model for each measure therefore involves selecting the covariates and interaction terms to be included and the number of knots to use for each spline. The BCPE distribution has four parameters, so four model equations need to be specified for each continuous measure. Each model was selected to minimize the Akaike Information Criterion (AIC). First, the equation for the location parameter was selected. The number of knots for the cubic spline was set between two (a straight line) and seven. A forward and backward stepwise selection was used for each number of knots to select which of the covariates and interactions was to be included, using the Generalized AIC calculated using the gamlss function
stepGAIC(). These models were then compared, and the number of knots that led to the model with the smallest AIC was selected. Once the equation for the location was selected, this process was repeated to select the equation for the scale parameter, given the location equation, and for the shape parameters, given the scale and location equations.
Inverse probability weights were then applied to the final model to ensure that estimates were applicable to the population. For each participant, the weight applied was the inverse of the probability that a member of the com-munity-living older population of Ireland selected at ran-dom with his or her characteristics would have undergone the TILDA health assessment. Weights were calculated in a two-step procedure. First, the distribution of age, sex, and educational attainment among the TILDA home inter-view sample was compared with the distribution among the older Irish population reported in the Quarterly National Household Survey (2010) to calculate an initial probability weight. Second, the probability of completing a health assessment given participation in the home inter-view was calculated based on characteristics recorded in the interview. These probability weights were multiplied to create the final weight. Missing data are rare, so missing data with respect to individual measures was assumed to be missing completely at random.
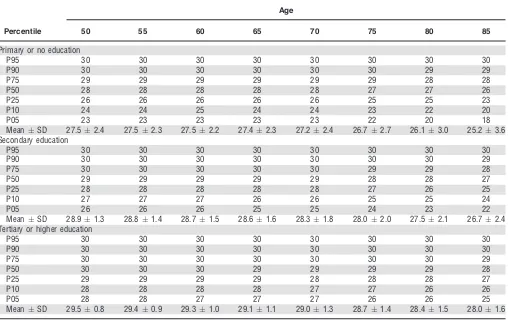
Table 2. Mini-Mental State Examination Scores Stratified According to Highest Educational Attainment, Based on a Sample of 5,842 Individuals Aged 50 and Older Representative of the Community-Dwelling Population of Ireland without Known Dementia, Parkinson’s Disease, or Severe Cognitive Impairment
Percentile
Age
50 55 60 65 70 75 80 85
Primary or no education
P95 30 30 30 30 30 30 30 30
P90 30 30 30 30 30 30 29 29
P75 29 29 29 29 29 29 28 28
P50 28 28 28 28 28 27 27 26
P25 26 26 26 26 26 25 25 23
P10 24 24 25 24 24 23 22 20
P05 23 23 23 23 23 22 20 18
MeanSD 27.52.4 27.52.3 27.52.2 27.42.3 27.22.4 26.72.7 26.13.0 25.23.6 Secondary education
P95 30 30 30 30 30 30 30 30
P90 30 30 30 30 30 30 30 29
P75 30 30 30 30 30 29 29 28
P50 29 29 29 29 29 28 28 27
P25 28 28 28 28 28 27 26 25
P10 27 27 27 26 26 25 25 24
P05 26 26 26 25 25 24 23 22
MeanSD 28.91.3 28.81.4 28.71.5 28.61.6 28.31.8 28.02.0 27.52.1 26.72.4 Tertiary or higher education
P95 30 30 30 30 30 30 30 30
P90 30 30 30 30 30 30 30 30
P75 30 30 30 30 30 30 30 29
P50 30 30 30 29 29 29 29 28
P25 29 29 29 29 28 28 28 27
P10 28 28 28 28 27 27 26 26
P05 28 28 27 27 27 26 26 25
MeanSD 29.50.8 29.40.9 29.31.0 29.11.1 29.01.3 28.71.4 28.41.5 28.01.6
[image:4.595.43.551.400.720.2]For each measure, the 5th, 10th, 25th, 50th, 75th, 90th, and 95th percentiles are reported for every fifth year of age from age 50, stratified according to any covariates included in the final model. Although data from all partici-pants aged 50 and older were used in the estimation of the normative values, the small numbers of participants aged 85 and older led to imprecise estimates of normative val-ues at those ages, so estimates of normative valval-ues are pro-vided only up to age 85. Because the distributions of many of the tests are nonnormal, it is not appropriate to use the means and standard deviations of test scores when com-paring an individual with the population, although means and standard deviations are of interest, for example, when performing power calculations, so these values were extracted from each model and supplied along with quan-tiles.
RESULTS
Of the 5,013 participants who attended the health assess-ment center, 2,720 (54%) were female, and the mean age was 62.0. Including the additional 843 who had a health assessment in their own home, 3,176 (54%) were female, and the mean age was 63.1. The sample was ethnically homogeneous, with 98% of the Irish population aged 50 and older describing themselves as white (census data
available from the Central Statistics Office at www.cso.ie). A full description of the socioeconomic and health status of both cohorts is described elsewhere in this issue.5
Table 1 shows numbers of individual participants who provided valid measurements for each test. The numbers with missing data were small, with the highest rate of missing data arising from the second color trail task (N=193, 3.3% of the sample). Tables 2–9 show modeled 5th, 10th, 25th, 50th, 75th, 90th, and 95th percentiles along with the mean and standard deviation for each of the measures described above reported every fifth year of age from 50 to 85. Values for intermediate ages should be estimated using linear interpolation between the supplied values; for example, an individual aged 62 will have scores two-fifths of the way between those for individuals aged 60 and 65.
Mini-Mental State Examination (Table 2), MoCA (Table 3), and time to complete the trail tasks (Table 4) varied according to highest educational attainment and so are stratified according to education; differences between men and women, although statistically significant, were relatively minor, so cognitive test scores are not stratified according to sex. The simultaneous decline in weight and height (Table 5) with age means that the distribution of BMI in the population did not change substantially with age, so a table for BMI is not provided. Median BMI was
Table 3. Montreal Cognitive Assessment Scores Stratified According to Highest Educational Attainment, Based on a Sample of 5,802 Individuals Aged 50 and Older Representative of the Community-Dwelling Population of Ireland without Known Dementia, Parkinson’s Disease, or Severe Cognitive Impairment
Percentile
Age
50 55 60 65 70 75 80 85
Primary or no education
P95 29 29 29 28 28 28 27 27
P90 28 28 28 28 27 27 26 26
P75 27 26 26 26 26 25 24 23
P50 24 24 24 24 23 22 21 20
P25 22 22 21 21 20 19 18 16
P10 19 19 19 18 17 16 14 12
P05 17 17 17 16 15 13 12 9
MeanSD 24.03.5 23.83.6 23.53.7 23.13.9 22.54.1 21.74.5 20.74.9 19.35.5 Secondary education
P95 29 29 29 29 29 29 28 28
P90 29 29 29 29 28 28 27 27
P75 27 28 27 27 27 26 26 25
P50 26 26 26 26 25 24 23 22
P25 24 24 24 23 23 22 20 18
P10 22 22 21 21 20 19 17 15
P05 20 20 20 19 19 17 15 12
MeanSD 25.42.9 25.42.9 25.32.9 25.13.0 24.63.2 23.83.6 22.74.1 21.14.7 Tertiary or higher education
P95 30 30 30 30 29 29 29 29
P90 30 29 29 29 29 29 28 28
P75 29 29 28 28 28 27 27 27
P50 28 27 27 27 26 26 25 24
P25 26 26 25 25 24 24 23 22
P10 25 24 24 23 22 21 20 19
P05 24 23 22 22 21 20 19 17
MeanSD 27.32.0 27.02.1 26.72.3 26.32.5 25.82.7 25.32.9 24.73.2 23.93.5
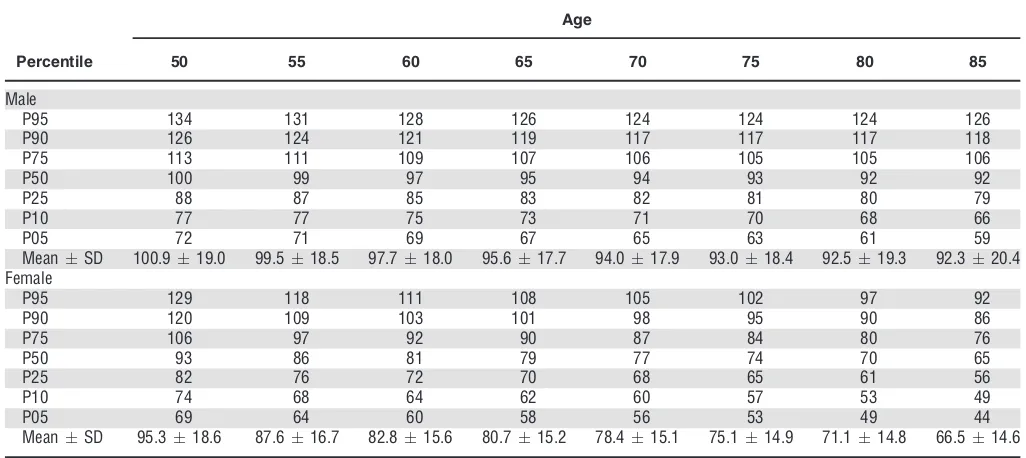
[image:5.595.47.557.400.722.2]between 28.0 and 29.0 kg/m2 in men at all ages and between 27.0 and 28.0 kg/m2in women. There were sub-stantial and statistically significant differences according to sex and height for TUG (Table 6), usual walking speed (Table 7), and grip strength (Table 8). Normative values for heel bone mineral density measured according to the stiffness index (Table 9) are stratified according to sex.
DISCUSSION
Summary of Findings
This study provides normative values for many of the tests undertaken as part of a geriatric assessment, based on a sample representative of the community-living Irish popu-lation aged 50 and older without known dementia,
Parkin-son’s disease, or severe cognitive impairment. Values were calculated based on the health assessment conducted dur-ing Wave 1 of TILDA.
Strengths and Weaknesses of the Study
This study was based on a large population-representative sample who underwent a comprehensive health assessment including many tests typical of a geriatric assessment. The sample included those who attended a health assessment center and those who opted for a home-based health assessment. Inverse probability weights were applied to all estimates to correct for possible selection bias to the TILDA sample.
Individuals with severe cognitive impairments or a doctor’s diagnosis of dementia or Parkinson’s disease were
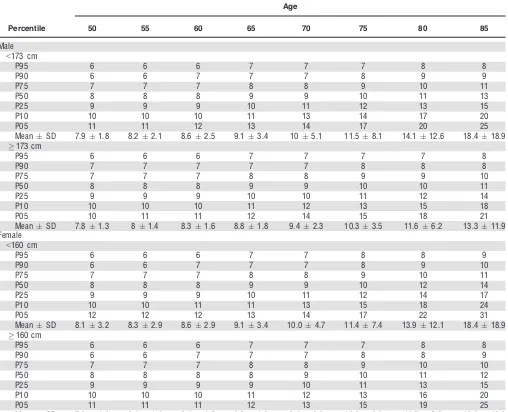
Table 6. Time to Complete Timed Up-and-Go (seconds) Test Based on a Sample of 5,791 individuals Aged 50 and Older Representative of the Community Dwelling Population of Ireland without Dementia, Parkinson’s Disease, or Severe Cognitive Impairment
Percentile
Age
50 55 60 65 70 75 80 85
Male
<173 cm
P95 6 6 6 7 7 7 8 8
P90 6 6 7 7 7 8 9 9
P75 7 7 7 8 8 9 10 11
P50 8 8 8 9 9 10 11 13
P25 9 9 9 10 11 12 13 15
P10 10 10 10 11 13 14 17 20
P05 11 11 12 13 14 17 20 25
MeanSD 7.91.8 8.22.1 8.62.5 9.13.4 105.1 11.58.1 14.112.6 18.418.9
173 cm
P95 6 6 6 7 7 7 7 8
P90 7 7 7 7 7 8 8 8
P75 7 7 7 8 8 9 9 10
P50 8 8 8 9 9 10 10 11
P25 9 9 9 10 10 11 12 14
P10 10 10 10 11 12 13 15 18
P05 10 11 11 12 14 15 18 21
MeanSD 7.81.3 81.4 8.31.6 8.81.8 9.42.3 10.33.5 11.66.2 13.311.9 Female
<160 cm
P95 6 6 6 7 7 8 8 9
P90 6 6 7 7 7 8 9 10
P75 7 7 7 8 8 9 10 11
P50 8 8 8 9 9 10 12 14
P25 9 9 9 10 11 12 14 17
P10 10 10 11 11 13 15 18 24
P05 12 12 12 13 14 17 22 31
MeanSD 8.13.2 8.32.9 8.62.9 9.13.4 10.04.7 11.47.4 13.912.1 18.418.9
160 cm
P95 6 6 6 7 7 7 8 8
P90 6 6 7 7 7 8 8 9
P75 7 7 7 8 8 9 10 10
P50 8 8 8 8 9 10 11 12
P25 9 9 9 9 10 11 13 15
P10 10 10 10 11 12 13 16 20
P05 11 11 11 12 13 15 19 25
MeanSD 7.91.6 8.11.6 8.41.7 8.81.8 9.42.2 10.33.2 11.55.8 13.312.0
[image:8.595.43.551.294.706.2]excluded, as were those living in long-term care institu-tions, but the sample included individuals with chronic dis-eases that would potentially affect their test scores, so the results should be taken to be representative of the general community-living older population and not the healthy older population. Identifying a healthy cohort, that is sepa-rating the pathological from the physiological age-related change in the older population, is difficult, and removing all of those with a chronic condition that might in some way affect their performance would result in a small, highly atypical sample.
The models fit the observed data well, and the sample size was adequate for estimating the models. The modeled values were also compared with those generated using quantile regression and with basic descriptive statistics across age groups to validate the approach. Using
GAMLSS models with the BCPE distribution for continu-ous measures is a well-validated approach to producing reference curves and is recommended by the World Health Organization Multicentre Growth Reference Study Group after a comprehensive comparison of methods for the crea-tion of child growth curves.11 As with all modeling approaches, there is a danger of overfitting models to data, as well as producing results that are model driven as opposed to data driven. The study did not include suffi-cient individuals aged 85 and older, so normative values are provided only up to age 85. Less than 4% of data were missing for all tests, and most cases arose from participants being unable to complete the test. Those with missing data were excluded from the analyses, so esti-mated normative values are applicable to those willing and able to complete each assessment.
Table 7. Usual Walking Speed (seconds) Based on Sample of 4,931 Individuals Aged 50 and Older Representative of the Community-Dwelling Population of Ireland without Dementia, Parkinson’s Disease, or Severe Cognitive Impairment
Percentile
Age
50 55 60 65 70 75 80 85
Male
<173 cm
P95 170 169 166 162 157 152 147 142
P90 164 163 160 155 151 145 140 134
P75 155 152 150 145 140 135 129 123
P50 144 142 139 135 129 123 117 110
P25 133 130 127 123 118 111 104 96
P10 122 119 115 111 105 98 90 80
P05 114 111 107 103 97 89 80 69
MeanSD 143.617.0 141.017.7 137.818.0 133.717.9 128.518.3 122.419.1 115.520.5 108.122.1
173 cm
P95 174 173 170 166 161 156 151 146
P90 168 166 164 159 155 149 144 139
P75 158 156 153 149 144 139 133 126
P50 148 145 142 138 133 127 120 113
P25 137 134 130 126 121 114 107 98
P10 125 121 118 114 108 101 92 83
P05 117 113 110 106 100 92 82 72
MeanSD 147.017.4 144.418.2 141.218.4 137.118.4 131.918.7 126.020.0 119.021.0 111.023.0 Female
<160 cm
P95 170 168 165 160 154 147 140 133
P90 163 161 158 153 147 140 133 125
P75 152 150 147 142 135 128 121 113
P50 141 138 135 130 124 117 108 99
P25 130 127 123 118 112 104 96 86
P10 119 115 111 107 100 92 83 72
P05 111 107 104 99 93 84 74 64
MeanSD 141.117.8 138.218.5 134.718.6 129.818.4 123.618.5 116.219.1 108.020.0 99.121.1
160 cm
P95 175 173 170 165 159 152 146 139
P90 168 166 163 158 152 145 138 130
P75 157 154 151 146 140 133 125 117
P50 145 143 139 134 128 121 112 104
P25 134 130 127 122 116 108 99 90
P10 122 118 115 110 104 95 86 75
P05 115 111 107 102 96 87 77 66
MeanSD 145.218.3 142.319.0 138.719.2 133.919.0 127.719.1 120.319.8 112.120.8 103.122.0
[image:9.595.49.560.88.520.2]Comment on Specific Measures
This is the first study to provide population-based norma-tive data for the TUG test performed at a normal pace. Men performed the TUG test slightly faster than women, and TUG times were faster in taller participants. Variation in TUG time increased with age, with large differences between the fastest and slowest participants at the oldest ages. TUG times were slower than those reported in a recent meta-analysis,12 although that analysis included studies with differing inclusion criteria, varying test proto-cols, and small convenience samples, making a direct com-parison difficult. Another study13 reported faster TUG times in a Spanish population, but these were calculated for TUG performed at fast pace.
Grip strength was greater in men than women. Grip strength declines from age 50 onward and declines faster
after the age of 65. In general, the TILDA population had weaker grip strength than in several other studies,14–16 including normative data provided in the Baseline dyna-mometer manual,17although because none of these studies used population-representative samples, they may reflect healthier, more-robust groups. Many of these studies used the Jamar dynamometer, which has excellent interinstru-ment reliability with the Baseline dynamometer18 used in the current study.
Walking speed declined with increasing age and was faster in men than women and in taller than smaller partici-pants of both sexes. The decline was slightly curvilinear, with the most pronounced decline after age 65. The walking speed of the TILDA population was faster than or similar to that of community-dwelling adults of a comparable age in other studies using the GAITRite walkway.19–21 This may be because of the long acceleration period available to
par-Table 8. Maximum Grip Strength (kg) from Two Trials of Each Hand, Based on a Sample of 5,819 Individuals Aged 50 and Older Representative of the Community-Dwelling Population of Ireland without Known Dementia, Parkinson’s Disease, or Severe Cognitive Impairment
Percentile
Age
50 55 60 65 70 75 80 85
Male
<173 cm
P95 51 49 48 46 43 40 37 34
P90 48 46 45 43 40 37 35 32
P75 43 41 40 38 36 34 31 28
P50 38 36 35 34 32 29 27 24
P25 33 32 30 29 27 25 22 20
P10 29 27 26 25 23 21 19 16
P05 27 24 24 23 21 18 16 16
MeanSD 38.47.5 36.47.4 35.37.2 34.07.0 31.86.7 29.26.5 26.66.3 23.86.1
173 cm
P95 56 53 53 51 48 45 42 40
P90 53 51 49 48 45 42 40 37
P75 48 46 45 43 41 38 35 32
P50 42 41 39 38 36 34 31 28
P25 37 36 35 33 31 29 26 24
P10 33 31 30 29 27 25 22 20
P05 30 28 27 27 24 22 20 18
MeanSD 42.77.8 40.77.7 39.77.6 38.47.4 36.17.1 33.67.0 30.96.8 28.26.7 Female
<160 cm
P95 31 29 28 27 26 24 23 23
P90 29 27 26 26 24 23 22 21
P75 26 24 24 23 22 20 19 18
P50 23 21 21 20 19 18 17 16
P25 20 18 18 18 17 16 14 13
P10 17 15 15 15 14 13 12 10
P05 16 13 13 14 13 11 10 9
MeanSD 23.04.6 21.34.7 20.74.5 20.34.2 19.13.9 17.93.9 16.84.1 15.74.5
160 cm
P95 34 32 32 31 29 27 27 27
P90 32 30 30 29 27 26 25 25
P75 29 27 26 26 24 23 22 21
P50 25 24 23 23 22 21 19 18
P25 22 21 20 20 19 18 16 15
P10 19 17 17 17 16 15 13 12
P05 17 15 15 15 14 13 11 10
MeanSD 25.55.1 23.75.2 23.25.0 22.74.6 21.64.4 20.44.4 19.24.7 18.25.2
[image:10.595.43.551.92.516.2]ticipants before the timed walk, highlighting the importance of standardization of every aspect of such a test.
BMI does not appear to decline with age in the com-munity-living older population of Ireland. Previous studies have shown varying patterns of BMI change with age in older adults but have tended to show a similar distribution of BMI in those aged 60 to 69 and 70 to 79, with lower BMI in those aged 80 and older.22,23
In interpreting the cognitive test scores, it is worth re-emphasizing that, although the sample excluded those with known dementia or severe cognitive impairment, it is likely that a significant proportion of the sample had dis-ease that might have impaired their cognitive function, particularly in the oldest age groups. This approach of excluding individuals with dementia or severe cognitive impairment while including those with possible mild impairment is commonly taken when supplying normative values for cognitive tests24,25 because it is difficult to dis-tinguish between age-related and mild pathological decline in cognitive ability.
Mini-Mental State Examination scores declined with age, and this decline was more pronounced at lower edu-cation levels, as previously reported.25Normative data for MMSE has been stratified according to sex in some previ-ous studies, with differences between men and women in the oldest age groups and at the lowest percentiles,26 but no substantial effect of sex on MMSE score was found in the current study, possibly because individuals in long-term care institutions were excluded. The MMSE does not discriminate cognitive function well in cognitively intact individuals, as the overlapping MMSE percentiles demon-strate, but can identify the lowest performing 5th and 10th percentiles in most subgroups. MoCA scores in this study declined with age, and similar to MMSE, this decline was
more pronounced with lower education levels. The median values for MoCA reported here are 1 to 2 points higher than those reported recently in 2,653 ethnically diverse participants of the Dallas Heart Study.24 This, along with the previous finding that the cutoff score of 26 originally proposed for the MoCA lacks specificity in many popula-tions,27 highlights the need for population-specific norms. Educational attainment strongly affect MoCA and MMSE scores. Using the recently suggested cutoff of 20 for indica-tion of cognitive impairment on the MoCA,28half of those aged 85 with primary education or less would be catego-rized as impaired, compared with only 10% of those aged 85 with third-level or higher education. Limited normative data exist for the Color Trails Test. The trend of longer completion time with age is demonstrated, and the greater effect of education on the Trails 2 norms is similar to that reported previously.8,29–31
Bone mineral density (BMD) declines with age, partic-ularly in women. Although many normative studies of BMD exist in middle-aged and older populations, the majority use dual-energy X-ray absorptiometry,32,33which is considered to be the criterion standard for osteoporosis diagnosis. Heel bone ultrasound provides a complementary measure of bone density that is also useful as a low-cost, portable screening measure for osteoporosis, and this study is one of the first to provide normative values for heel bone ultrasound measurements derived from an unselected sample from a middle-aged and older population.
CONCLUSION
This study reports a comprehensive range of up-to-date normative values for many measures currently indicated for use in CGA. The population used was representative of
Table 9. Heel Bone Stiffness Index Based on a Sample of 4,980 Individuals Aged 50 and Older Representative of the Community-Dwelling Population of Ireland without Known Dementia, Parkinson’s Disease, or Severe Cognitive Impairment
Percentile
Age
50 55 60 65 70 75 80 85
Male
P95 134 131 128 126 124 124 124 126
P90 126 124 121 119 117 117 117 118
P75 113 111 109 107 106 105 105 106
P50 100 99 97 95 94 93 92 92
P25 88 87 85 83 82 81 80 79
P10 77 77 75 73 71 70 68 66
P05 72 71 69 67 65 63 61 59
MeanSD 100.919.0 99.518.5 97.718.0 95.617.7 94.017.9 93.018.4 92.519.3 92.320.4 Female
P95 129 118 111 108 105 102 97 92
P90 120 109 103 101 98 95 90 86
P75 106 97 92 90 87 84 80 76
P50 93 86 81 79 77 74 70 65
P25 82 76 72 70 68 65 61 56
P10 74 68 64 62 60 57 53 49
P05 69 64 60 58 56 53 49 44
MeanSD 95.318.6 87.616.7 82.815.6 80.715.2 78.415.1 75.114.9 71.114.8 66.514.6
[image:11.595.44.557.90.319.2]community-dwelling individuals aged 50 and older living in the Republic of Ireland. Up-to-date population-specific normative values are essential to enable clinicians to com-pare the performance of their patients with that observed in the general community-living older population, guiding better diagnosis and management of older adults.
ACKNOWLEDGMENTS
We are grateful to the TILDA research team for the design and running of the health assessment center and to the TILDA participants.
Conflict of Interest: The authors have no financial or
personal conflicts of interest with respect to this work. This study is funded by the Irish Government, The Atlantic Philanthropies, and Irish Life.
Author Contributions: RA Kenny and H Cronin: study
concept and design, acquisition of subjects and data, inter-pretation of data, preparation of manuscript. RF Coen: study concept and design, interpretation of data, prepara-tion of manuscript. J Frewen and OA Donoghue: analysis and interpretation of data, preparation of manuscript. GM Savva: analysis and interpretation of data, preparation of manuscript.
Sponsor’s Role: The funding sources had no role in
the design, methodology, data analysis, or preparation of this manuscript.
REFERENCES
1. Ellis G, Whitehead MA, Robinson D et al. Comprehensive geriatric assess-ment for older adults admitted to hospital: Meta-analysis of randomised controlled trials. BMJ 2011;343:d6553.
2. Whelan B, Savva GM. The design and methodology of The Irish Longitudi-nal Study on Ageing. J Am Geriatr Soc 2013;61:S265–S268.
3. Whelan BJ. RANSAM: A random sample design for Ireland. Econ Soc Rev 1979;10:169–174.
4. Kearney PM, Cronin H, O’Regan C et al. Cohort profile: The Irish Longi-tudinal Study on Ageing. Int J Epidemiol 2011;40:877–884.
5. Cronin H, O’Regan C, Kearney PM et al. Health and Ageing: Development of The Irish Longitudinal Study of Ageing health assessment. J Am Geriatr Soc 2013;61:S269–S278.
6. Folstein MF, Folstein SE, McHugh PR. ‘Mini-mental state’. A practical method for grading the cognitive state of patients for the clinician. J Psychi-atr Res 1975;12:189–198.
7. Nasreddine ZS, Phillips NA, Bedirian V et al. The Montreal Cognitive Assessment, MoCA: A brief screening tool for mild cognitive impairment. J Am Geriatr Soc 2005;53:695–699.
8. D’Elia LF, Satz P, Lyons Uchiyama C et al. Color Trails Test. Professional Manual. Odessa, FL: Psychological Assessment Resources, Inc., 1996. 9. Stasinopoulos DM, Rigby RA. Generalized additive models for location
scale and shape (GAMLSS) R. J Stat Softw 2007:23.
10. Rigby RA, Stasinopoulos DM. Smooth centile curves for skew and kurtotic data modelled using the Box-Cox power exponential distribution. Stat Med 2004;23:3053–3076.
11. Borghi E, de Onis M, Garza C et al. Construction of the World Health Organization child growth standards: Selection of methods for attained growth curves. Stat Med 2006;25:247–265.
12. Bohannon RW. Reference values for the timed up and go test: A descrip-tive meta-analysis. J Geriatr Phys Ther 2006;29:64–68.
13. Pondal M, del Ser T. Normative data and determinants for the Timed “Up and Go” test in a population-based sample of elderly individuals without gait disturbances. J Geriatr Phys Ther 2008;31:57–63.
14. Bohannon RW, Peolsson A, Massy-Westropp N et al. Reference values for adult grip strength measured with a Jamar dynamometer: A descriptive meta-analysis. Physiotherapy 2006;92:11–15.
15. Peters MJH, van Nes SI, Vanhoutte EK et al. Revised normative values for grip strength with the Jamar dynamometer. J Peripher Nerv Syst 2011;16:47–50.
16. Werle S, Goldhahn J, Drerup S et al. Age- and gender-specific normative data of grip and pinch strength in a healthy adult swiss population. J Hand Surg Eur Vol 2009;34:76–84.
17. Mathiowetz V, Kashman N, Volland G et al. Grip and pinch strength: Normative data for adults. Arch Phys Med Rehabil 1985;66:69–74. 18. Mathiowetz V, Vizenor L, Melander D. Comparison of baseline
instru-ments to the Jamar dynamometer and the B&L engineering pinch gauge. OTJR 2000;20:147–162.
19. Hollman JH, McDade EM, Petersen RC. Normative spatiotemporal gait parameters in older adults. Gait Posture 2011;34:111–118.
20. Oh-Park M, Holtzer R, Xue X et al. Conventional and robust quantitative gait norms in community-dwelling older adults. J Am Geriatr Soc 2010;58:1512–1518.
21. Callisaya ML, Blizzard L, Schmidt MD et al. Sex modifies the relationship between age and gait: A population-based study of older adults. J Gerontol A Biol Sci Med Sci 2008;63A:165–170.
22. Chiu HC, Chang HY, Mau LW et al. Height, weight, and body mass index of elderly persons in Taiwan. J Gerontol A Biol Sci Med Sci 2000;55A: M684–M690.
23. Launer LJ, Harris T. Weight, height and body mass index distributions in geographically and ethnically diverse samples of older persons. Ad Hoc Committee on the Statistics of Anthropometry and Aging. Age Ageing 1996;25:300–306.
24. Rossetti HC, Lacritz LH, Cullum CM et al. Normative data for the Mon-treal Cognitive Assessment (MoCA) in a population-based sample. Neurol-ogy 2011;77:1272–1275.
25. Crum RM, Anthony JC, Bassett SS et al. Population-based norms for the Mini-Mental State Examination by age and educational level. JAMA 1993;269:2386–2391.
26. Chatfield M, Matthews FE, Brayne C. Using the Mini-Mental State Exami-nation for tracking cognition in the older population based on longitudinal data. J Am Geriatr Soc 2007;55:1066–1071.
27. Coen RF, Cahill R, Lawlor BA. Things to watch out for when using the Montreal Cognitive Assessment (MoCA). Int J Geriatr Psychiatry 2011;26:107–108.
28. Waldron-Perrine B, Axelrod BN. Determining an appropriate cutting score for indication of impairment on the Montreal Cognitive Assessment. Int J Geriatr Psychiatry 2012;27:1189–1194.
29. Mitrushina MN, Boone KB, D’Elia LF. Handbook of Normative Data for Neuropsychological Assessment, 2nd Ed. New York: Oxford University Press, 2005.
30. LaRue A, Romero LJ, Ortiz IE et al. Neuropsychological performance of Hispanic and non-Hispanic older adults: An epidemiologic survey. Clin Neuropsychol 1999;13:474–486.
31. Messinis L, Malegiannaki A-C, Christodoulou T et al. Color Trails Test: Normative data and criterion validity for the Greek adult population. Arch Clin Neuropsychol 2011;26:322–330.
32. Kelly TL, Wilson KE, Heymsfield SB. Dual energy x-ray absorptiometry body composition reference values from NHANES. PLoS ONE 2009;4: e7038.