Prediction of Broad spectrum Pathogen Attachment
to Coating Materials for Biomedical Devices
† School of Pharmacy, University of Nottingham, Nottingham NG7 2RD, UK.
§ Centre for Biomolecular Sciences, School of Life Sciences, University of Nottingham, Nottingham NG7 2RD, UK.
¶ Faculty of Engineering, University of Nottingham, Nottingham NG7 2RD, UK
# Koch Institute for Integrative Cancer Research, MIT, Cambridge MA, 02139 4307, USA
& Department of Chemistry and Physics, La Trobe Institute for Molecular Science, La Trobe University, Kingsbury Drive, Melbourne, Victoria 3086, Australia; Monash Institute for
Pharmaceutical Sciences, Parkville 3052, Australia; School of Chemical and Physical Sciences, Flinders University 5046, Australia
Corresponding authors email addresses: [email protected]; [email protected]; [email protected]
Bacterial infections are a large and re emerging global healthcare issue because of ageing populations, the evolution of multi and pan antibiotic resistant pathogens, increasing numbers of immunocompromised patients, and developments in and use of medical devices. Immune responses abate with ageing, and concurrent medical conditions mean that hospitalizations are increasing and nosocomial infections more prevalent.1 2 Antibiotic resistance is a major global healthcare challenge, and the increased use of implantable and indwelling medical devices is hampered by the risk of bacterial infections, especially by multi antibiotic resistant pathogens.3 4 Additionally, wound infections, traumatic burns, suppressed immune responses due to HIV infection or organ transplantation, and increased survival of patients with chronic serious conditions such as cystic fibrosis and diabetes add to the overall burden of infection.
summarized in recent reviews.6 12 In spite of some promising outcomes, given the immense size of materials space, it is essential that automated and high throughput materials synthesis and assessment methods be adopted to identify suitable materials quickly and allow their use in medical devices.13
synthesis and assessment of materials is not sufficient to guarantee discovery of the best materials.
An experimental high throughput materials discovery campaign was undertaken to identify new acrylate polymers with reduced attachment and biofilm formation, initially using a single strain belonging to each of three major pathogen species, but subsequently using multiple clinical
isolates.22 (PA), (SA), and uropathogenic
(UPEC) attachment was compared with existing commercial medical device materials such as silicone rubber and silver containing hydrogel coatings. Acrylate polymers presented in a microarray format (see Figure 1) were screened to identify promising materials that minimized bacterial attachment and biofilm formation and in an foreign body infection model. 22 23 Some of these materials are now undergoing regulatory approval for use as urinary catheter coatings.
predictive capabilities. Although linear models of the relationships between surface chemistry and bacterial attachment reported by Hook et al. showed some predictive abilities for pathogen attachment, nonlinear neural network based models are often significantly more robust and predictive and were used in the current study. Sanni et al.25 also results of reported a study that used the highest performing (lowest bacterial attachment) subset of the monomers reported in the Hook et al. study and used here, correlating bacterial cell attachment with a composite parameter composed of contributions from the lipophilicity and molecular flexibility of the monomer units. There is often a lack of clarity, even within the QSPR modelling community, on the two main purposes of machine learning and other statistical methods that model the relationships between the properties of molecules or materials and their biological effects. One aim is to understand the details of the molecular interactions and mechanisms underlying the biological phenomena being modelled. The other aim, now dominant in drug discovery and materials design, is to be able to predict the biological response of materials yet to be synthesized, allowing very large virtual libraries of synthetically feasible materials to be prioritized for subsequent synthesis and testing and discovering useful materials more quickly. This aim is driven by the need to translate into real medical applications novel materials with hitherto inaccessible properties. It is this aim that our current research is pursuing. These disparate but synergistic uses of models have been elucidated recently by Winkler and Fujita.26 QSPR models can also be used fitness functions in evolutionary processes that allow materials to be evolved towards one of more desirable properties.27
pathogens It should be noted that these experiments and models predict the attachment of single pathogen strains to polymers not mixtures of different pathogens. The approach we have taken is similar to multitask networks28 29, which have proven to be successful in predicting the biological activities of small molecules against several targets. Multitask models potentially have wide applicability in materials science and medicine as they can identify materials with low attachment for a range of important pathogens and strains, rather than for a single pathogen strain. We compare the performance of the multi pathogen model to that of the three, single pathogen strain computational models. Such models may also lead to general rules that relate low attachment to specific types of surface chemistry of polymers. A similar computational approach is used in small molecule drug discovery to find alternative drug targets.30
Data for pathogen attachment to a polymer library containing 496 acrylate copolymers and homopolymers were obtained from Hook et al.23 Acrylate polymers was used because of the robustness and reliability of this type of polymer when used in the microarray format in our hands.23 24, 31 33 Homo and copolymers were generated by combinatorial reaction of different ratios of each monomer prior to UV initiated polymerization. The nomenclature adopted for the copolymers is as follows: 1A(30%) means the polymer is composed of 70% of monomer 1 and 30% of monomer A by volume.
removed the background signal from an equivalent microarray immersed in fresh uninoculated media
F = Fpolymer + bacteria – Fpolymer (1)
As the fluorescence spanned several orders of magnitude, we modelled the logarithm of the fluorescence, logF.
Polymer microarrays may contain errors due to monomer carry over between spots despite washing procedures, other types of printing errors, and cell attachment may be heterogeneous due to poor presentation on the slide. We identified likely problematic replicates in the arrays using modified Thomson’s tau. This identifies suspect measurements using the variance between of data point replicates.
= ta/2 * (n 1)
√ ∗ n 2+ta/2
(2)
where n = sample size, ta/2 = critical student’s t test value at with sample size n 2. We chose a = 0.05, viz. statistical significance at 95% level. Data points were omitted if > ∗ where S is standard deviation of the sample, δ is the absolute difference of a data point and the sample mean. Replicates identified by this process were discarded, and values of the remaining replicates were averaged for the modelling studies.
The analyses also required the removal of polymers having logF values below 5.6, the detection limit of the pathogen attachment assay, as we did not have information on what their actual fluorescence/attachment values were. It was also necessary to remove a few model outliers, a process that must be done carefully and objectively. Polymers with low fluorescence values that were <2.5σ of the background fluorescence were removed. These two steps
eliminated 89 polymers from the PA data set, 18 from the SA data set and 409 from the UPEC data set. Four additional outliers were identified from the models. Polymers 1A(30%), 5F(15%), 9D(15%) for the PA attachment model, and 5D(10%) for the SA attachment model had fluorescence values inconsistent with fluorescence of copolymers with similar compositions and were poorly predicted by the models.
identities and structures of the monomers used to generate the additional smaller and larger polymer arrays used to valid model predictions are summarized in Supplementary Figure S2 and S3.
. Schematic of the processes employed in the micro array fabrication, pathogen screening, modelling of data, and prediction of pathogen attachment for new polymers.
set and 95 points in the test set. The protocol for measuring attachment of UPEC was different to that for the other two pathogens, as artificial urine was added to the culturing protocol to simulated the service environments that urinary catheters will encounter. This increased the variance in the measured bacterial fluorescence and resulted in a lower degree of attachment of UPEC to the polymers compared to that for SA and PA. UPEC also forms weaker adhering biofilms compared to PA and SA. Consequently, the UPEC data set only contain 87 polymers after omitting those below the detection limit (the majority), with experimental artefacts, or with unusually high variability in replicates. This data set was partitioned into 70 points for the training set and 17 for test set. After outlier removal and polymers with fluorescence below the detection limit, the resulting 968 multi pathogen attachment polymer data set was split to a training set of 774 points and a test set of 194 points.
adjusted by a parameter, β, to obtain a model with the lowest standard error of prediction (SEP) for all three pathogens. This resulted in a set of descriptors shown in the table S1.
We have also used experimental time of flight secondary ion mass spectrum (ToF SIMS) ion peaks derived from analysis of the surfaces of the polymer spots in the library as descriptors. These data were also obtained from Hook et al. and contained surface characterization of one spot from the six replicates.23 The assignment of the identities of the peak ions and association with the polymer structures is described by Hook and Scurr.32 The water contact area (WCA), a measure of surface polarity, was also measured in this paper and employed here as an experimental descriptor. Experimental data used for modelling are shown in Table S3.
The multi pathogen models were generated from a data set that combined all three pathogen attachment data sets, using an indicator variable as a descriptor to distinguish between the presence (1) or absence (0) of a specific pathogen. A Bayesian regularized Neural Network with Gaussian prior (BRANNGP) was used to generate the pathogen attachment models.40 The neural network consisted of one input, one hidden and one output layer. The number of nodes in the hidden layer was varied from 2 to 10. However, previous reports41 have shown that less than five hidden layer nodes are sufficient in almost all cases, and that specifying larger numbers of nodes results in almost identical models because of the Bayesian regularization.41 The best model for each case was identified as the one with the lowest test set standard error of prediction (SEP), as is best practice.42 However the standard error of estimation (SEE) for the training set prediction, and the r2 value for the training and test set predictions were also reported.
Bayesian regularized neural networks are relatively immune to)41 or chance correlations by randomly redistributed only the y values. This gave models with r2 values very close to zero, as would be expected.
As described above, the predictions of pathogen adhesion of two new polymer libraries were complicated by a change in experimental protocols after generating, measuring, and modelling the data using GFP modified bacteria. Pathogens genetically modified to express the mCherry fluorescent protein were used to check the prediction of the models for a new polymer array containing homo and copolymers. This prevented a direct, quantitative validation of model predictions. The logarithm of the mCherry intensities were autoscaled (normalized) and three classes (low, medium, and high attachment) defined for each normalized set of data by inspection of the distributions in the histograms (see Supporting Figure S4). Truth tables were generated from the class membership of attachment of PA and UPEC to each polymer in the array.
The attachment of each of (PA), (SA), and uropathogenic
Individual models predicting the attachment of each pathogen to the same polymer library were reported by Epa et al. using computed molecular descriptors specifically chosen to be chemically interpretable.24 The aim of this prior work was to generate models that provided some insight into the relationship between surface chemistry and pathogen attachment, as well as making quantitative prediction of bacterial attachment of new materials. More arcane molecular descriptors generally provide improved predictive power at the expense of loss of chemical interpretability. Given the added complexity of modelling surface chemistry polymer attachments relationships for several pathogens simultaneously, in this work we chose descriptors solely for their ability to generate the most accurate predictions of pathogen attachment. We employed indicator variable descriptors to allow the entire set of pathogen attachment data to be used to train multi pathogen attachment models that predict the performance of polymer libraries for all three pathogens (see Methods).
Here we compare the performance of multi pathogen attachment models with those that predict attachment of single pathogens. We reiterate, these experiments and models predict the attachment of single pathogen strains to polymers not coincident mixtures of pathogens, as often occur in infections. Model performance was assessed by the ability of each model to recapitulate the attachment performance of polymers in a test set not used to train the models. We also compared the performance of experimental ion peak and water contact angle descriptors with computed molecular descriptors for single and multi pathogen attachment models, to assess whether the extra effort involved in ToF SIMS experiments was justified by higher model accuracy or interpretability.
models were generated by a Bayesian neural network (BRANN), and a linear multiple regression model (MLR) was also included for comparison. Clearly, the BRANN multi pathogen model had significantly lower standard error of prediction (SEP) than the linear model so predicted the attachment to polymers in the test set more accurately (the r2 was also higher than the linear model). This is consistent with earlier studies of models predicting each pathogen separately.23 24
. Statistics of pathogen attachment neural network (BRANN) models based on molecular descriptors. Neff is the number of effective adjustable weights, and Ndes is the number of descriptors employed, Nhidden in the number of nodes in the hidden layer, SEE is the standard error of estimation, SEP is the standard error of prediction and r2 is the squared correlation coefficient of the predictions
Training set Test set
Model Nhidden Neff Ndes SEE r2 SEP r2
Multi pathogen (MLR) … 22 22 0.30 0.59 0.28 0.60
Multi pathogen 7 488 41 0.16 0.86 0.19 0.81
8 246 30 0.17 0.88 0.17 0.87
7 310 18 0.12 0.87 0.14 0.78
uropathogenic 7 33 18 0.30 0.78 0.24 0.94
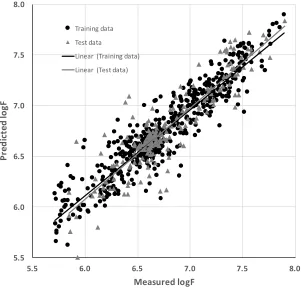
indicating a high level of statistical significance and showing that the model was robust and strongly predictive. Figure 2 illustrates the performance of the multi pathogen model in predicting the attachment of bacteria to the polymer library.
Measured and predicted attachment (estimated using the log of the GFP fluorescence, logF) of the multi pathogen attachment model employing computed molecular descriptors.
The linear MLR multi pathogen attachment model was also statistically significant (r2~>0.5, Table 2)44 but the standard errors of prediction were larger (0.28 logF) than the nonlinear BRANN model (0.22 logF). The linear models were derived to elucidate the likely contributions of the descriptors to the models. The contributions of the computed molecular descriptors to the multi pathogen model are summarized in Figure 3. The main purpose of this and related figures in the paper is to show which descriptors make positive or negative contributions to the
5.5 6.0 6.5 7.0 7.5 8.0
5.5 6.0 6.5 7.0 7.5 8.0
Measured logF Training data
Test data
Linear (Training data)
[image:16.612.160.461.156.444.2]attachment of one of more pathogens, to provide a qualitative measure of the size of the contribution, and to make inferences of the role of surface chemistry where possible.
. The weights of the descriptors in the linear multi pathogen attachment model. The error bars represent the standard errors in the parameter estimations from the MLR model. See Supplementary Table S2 for an explanation of these descriptors and Discussion for the relevance to the model.
Models relating pathogen attachment to surface chemistry were also generated for each pathogen separately. The model that best predicted PA attachment to polymers in the test set was derived using a neural network with 8 nodes in the hidden layer and used 30 descriptors. The training set SEE was 0.17 logF and r2 was 0.88, while the test set had an SEP of 0.17 logF and an r2 of 0.87. This suggests that the model was not overtrained and was quite robust. The SA attachment model had a training set SEE of 0.12 and a test set SEP of 0.14, and an r2 of 0.87 and 0.78 for predictions of attachment to polymers in the training and test sets respectively.
Despite the smaller data set size of the UPEC attachment study, a statistically valid and
predictive model was obtained. The model used two neurons in hidden layer and 18 descriptors.
The training and test set SEE and SEP values were 0.30 and 0.24 respectively, and the r2 for
training set was 0.78 and for test set 0.94.
The graphs showing the correlations between the measured and predicted attachment for the
individual pathogen models employing computed molecular descriptors are shown in
Supplementary Figure S5.
Experimentally measured ToF SIMS ion peaks and water contact angles (WCA) were also
used as descriptors in the pathogen attachment models to assess their efficiency relative to the
computed descriptors. The results of modelling the three individual pathogen data sets, and the
combined multi pathogen data sets with the experimental ToF SIMS analysis and WCA data are
summarized in Table 2. A linear MLR attachment model for multiple pathogens is included for
comparison and to allow the contributions of ion peaks to the model to be evaluated.
. Statistics of pathogen attachment BRANN models based on ToF SIMS molecular ion
peaks and WCA values. See Supplementary Table S3 for ToF SIMS descriptors used in the
models
Training set Test set
Model Nhidden Neff Ndes SEE r2 SEP r2
Multi pathogen (MLR) … 16 16 0.31 0.55 0.33 0.52
Multi pathogen (BRANN) 5 378 79 0.12 0.76 0.21 0.74
6 173 57 0.14 0.92 0.22 0.81
uropathogenic 2 44 10 0.24 0.87 0.24 0.84
As with the pathogen attachment model generated using computed molecular descriptors, the
best performing attachment model employed a neural network (BRANN) with 5 neurons in the
hidden layer and 79 descriptors. This model contained more effective weights but fewer
descriptors than the same model using computed molecular descriptors. The training and test sets
were predicted with good accuracy, with SEE and SEP values of 0.12 and 0.21 logF and r2
values of 0.76 and 0.74 respectively. Values of r2 above 0.7 shows that it is possible to generate a
good combined model for the attachment of all three pathogens to the polymer library using data
obtained from experimental techniques: ToF SIMS, and WCA 33. Figure 4 illustrates the
performance of this multi pathogen model in predicting the attachment of bacteria to the polymer
library.
5.5 6.0 6.5 7.0 7.5 8.0
5.5 6.0 6.5 7.0 7.5 8.0
Measured logF Training data
Test data
Linear (Training data)
Measured and predicted attachment (estimated using the log of the GFP fluorescence,
logF) of the multi pathogen attachment model employing ToF SIMS ion peak features and WCA
from experiments as descriptors.
As with the linear multi pathogen attachment model based on computed molecular descriptors,
the experimental descriptors also generated a linear (MLR) model of multi pathogen attachment
of lower statistical significance (r2>0.5, Table 2).44 The standard error of prediction was larger
(0.33 logF) than the nonlinear model (0.21 logF) and larger than that of linear multi pathogen
attachment model using computed molecular descriptors (0.28 logF). The contributions of the
experimental descriptors to the linear model are summarized in Figure 5.
. The weights of the descriptors in the linear multi pathogen attachment model (different
scales for the ToF SIMS ion peaks, WCA, and the indicator variables for the three pathogens).
The error bars represent the standard errors in the parameter estimations from the MLR model.
The best PA attachment model was obtained using a neural network containing 6 neurons in
the hidden layer and 57 descriptors. The training and test sets were well predicted by this model,
with SEE and SEP values of 0.14 and 0.22 logF and r2 values of 0.92 and 0.81 for training and -800.00
-600.00 -400.00 -200.00 0.00 200.00
test sets respectively. The number of descriptors in the model is higher than in the other bacterial
attachment models for SA and UPEC. The optimal SA attachment model was obtained from a
BRANN model that used 8 neurons in the hidden layer and 19 descriptors. Again, the training
and test set attachment was well predicted by the model, with SEE and SEP values of 0.11 and
0.14 logF for training and test sets. The corresponding r2 values for these predictions were 0.88
for the training set and 0.84 for the test set. The low standard errors, high r2 values, and the
similarity in the prediction efficacy of training and test set data show that this model of SA
attachment to the polymer library using experimental features is robust and predictive. The
quality of the models is similar to those reported previously by Epa et al.,24 which had an
SEP=0.12 logF and r2=0.85 for the test set. The most predictive UPEC attachment model for the
polymer library was obtained also using a neural network with 2 neurons in the hidden layer and
10 descriptors. This model predicted attachment of UPEC with SEE and SEP values of 0.24 and
the r2 values of 0.87 and 0.84 for training and test sets. The relatively small number of
experimental descriptors and excellent model metrics show that there are few key molecular
features important for UPEC attachment to the polymer surface. The model SEE and SEP values
of 0.24 are significantly better than those reported by Epa, (0.43 and 0.48) presumably because
the descriptors employed were more efficient than the chemically interpretable set used in the
earlier study. In our study, r2 was higher for training set 0.87 vs 0.58 in Epa et al.’s model, while
r2 for test set was a slightly lower at 0.84 versus 0.73 in the Epa et al. study. However, as we
have shown previously, the standard errors are a more robust measure of model predictivity than
The graphs showing the correlations between the measured and predicted attachment for the
individual pathogen models employing experimental descriptors are shown in Supplementary
Figure S6.
We would first like to clarify that the term multi pathogen should be not be confused with the
term polymicrobial, which describes a situation where a number of bacterial species and strains
coexist (common in many infections). By multi pathogen, we mean we have tested one bacterial
species and strain at a time. We have not performed experiments where we mix several strains
together and examine their collective behaviour.
The attachment of the three pathogens to the polymer library are reasonably well correlated
with each other, with r2 values greater than 0.5 for all species, as Table 3 shows. UPEC
attachment shows good correlation with PA and SA, while PA and SA attachment are correlated
to a slightly lesser extent. The significance of the pathogen indicator variables (1 when pathogen
present and 0 when absent) to the attachment models was interesting. Only the UPEC indicator
variable was statistically significant in the models, and the weights of the PA and SA indicator
variables were similar and much smaller. Given the caveat that we are only examining single
strains of each pathogen, we might imply that PA and SA may have more similar structure
property relationships and levels of attachment compared to UPEC.
. Correlation matrix (r2) for the attachment of the three pathogens to the polymer library.
PA SA UPEC
PA 1.00 0.52 0.66
UPEC 0.66 0.72 1.00
The differences between the single pathogen and multi pathogen models for the two types of
molecular descriptors are summarized in Tables 1 and 2. It is clear that there are not large
differences in the predictive power of the single pathogen models compared to the multi
pathogen model for each family of descriptors. This is illustrated graphically in Figure 6, which
summarizes the SEP values for pathogen attachment generated by pathogen specific models or
the by the multi pathogen model. Clearly, the test set SEP values for predicted attachment from
single pathogen models, are similar to those from the multi pathogen models. This suggests
strongly that multi pathogen models are effective, and have quantitative predictive power that is
similar to the individual pathogen models. Consequently, it should be feasible to generate models
that can make accurate quantitative predictions of pathogen attachment to materials for more
than three pathogens. The fact that such models can be derived relatively simply by use of
indicator variables as descriptors shows that the structure activity (attachment) relationships
between the pathogens may be described well by a nonlinear additive function such as a log
linear relationship. There is also a degree of inductive transfer of knowledge (a type of ‘read
across’) where internal models predicting the adhesion of each pathogen learn from each other.45
It has been proposed relatively recently that multi task machine learning models have improved
generalization performance because they use information from related tasks as an inductive
bias.46 The efficacy of the multi pathogen model may also be aided by the moderate correlations
between the attachment of the three pathogens to the polymer library. Bacterial pathogens whose
attachment to polymers are not as strongly correlated with each other may not be predicted as
Standard errors of prediction values for test set for single pathogen versus multi
pathogen models generated using molecular descriptors or experimental surface analytical ToF
SIMS descriptors.
The results summarized in Tables 1 and 2 suggest that nonlinear models derived from
computed and experimental descriptors have similar abilities to predict attachment of pathogens
to polymers in the test set (SEP values of 0.19 and 0.21 logF). However, the linear model of
pathogen attachment based on computed molecular descriptors had significantly better predictive
power than that based on experimental ToF SIMS and WCA descriptors (0.28 versus 0.33 logF).
Consequently, it may be argued that it is not essential to obtain ToF SIMS data for model
generation, unless these types of experimental descriptors provide additional insight into the role
0 0.05 0.1 0.15 0.2 0.25 0.3 0.35
PA SA UPEC PA SA UPEC
Experimental descriptors Computed molecular descriptors
of surface chemistry on pathogen attachment compared with computed molecular descriptors.
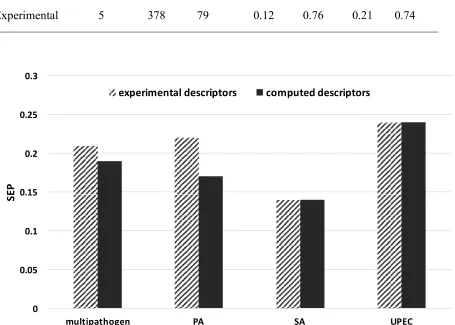
Table 4 summarizes the statistics of the two multi pathogen models. Figure 7 compares the
performance of the two descriptor types in predicting the attachment of the test set.
. Statistics of multi pathogen attachment models. See Supplementary Tables S1 and S3
for details of the descriptors used in the models.
Training Test
Descriptor set Nhidden Neff Ndes SEE r2 SEP r2
Computed 7 488 41 0.16 0.86 0.19 0.81
Experimental 5 378 79 0.12 0.76 0.21 0.74
0 0.05 0.1 0.15 0.2 0.25 0.3
multipathogen PA SA UPEC
[image:25.612.79.534.312.637.2]. Test set SEP values for the four pathogen attachment models for the two types of
descriptors. The experimental descriptors were dominated by ToF SIMS ion intensities and the
WCA did not play a significant role.
The model using experimental ToF SIMS ion peaks uses a less complex neural network
architecture but more descriptors than the model using computed molecular descriptors.
However, the number of effective weights in the model, derived from the Bayesian
regularization, are similar. It is clear that both methods for encoding the molecular characteristics
of the polymers generated very good, robust, and predictive attachment models, and the model
quality is similar. The SEP values for all models derived using computed molecular descriptors
are equal to or lower than those derived using experimental descriptors, as Figure 7 shows. The
performance of the UPEC model using ToF SIMS ions peak and computed molecular descriptors
are comparable despite the model derived from ToF SIMS descriptor being sparser (10 relevant
descriptors compared to 18).
The weights of the descriptors in the linear multi pathogen models gives some insight into the
role surface chemistry plays in attachment of the three pathogens. The unweighted contributions
the computed descriptors made to the model are shown in Figure 3. Curiously, in this linear
model, the contributions that the PA and SA indicator variables made to the model were very
similar, suggesting similar structure property relationships at the polymer surfaces, and similar
levels of pathogen attachment, despite having fundamentally different cell surfaces and signal
transduction machineries (gram negative vs gram positive). In spite of being easy to calculate
and capable of generating robust model that make good predictions of the attachment of
pathogens to polymers, the molecular descriptors are quite arcane and difficult to interpret in
the attachment model, meaning that when these molecular properties are larger, pathogen
attachment reduces. The largest negative contribution was from the PVSAs6 descriptor and the
most positive contribution was from the TIC1 descriptor. The PVSAs6 descriptor is one a of a
group of P VSA like descriptors that is defined as the amount of the molecular van der Waals
surface area (VSA) having a property P in a certain (binned) range.47 TIC1 is the first order
neighbourhood total information content of the molecule, a measure of molecular (graph)
complexity. It is related to Shannon entropy.48
The unweighted contributions the sparse experimental descriptors make to this model are
summarized graphically in Figure 5. Significantly, WCA makes a negligible contribution to
pathogen attachment in either individual or multi pathogen models. Previously Hook et al had
also found no correlation between contact angle and pathogen attachment.23 Conventional
wisdom teaches that reduced bacterial attachment often requires bound water in hydrophilic
structures. As noted by Hook et al previously, these relatively hydrophobic materials clearly do
not function by that mechanism. This is consistent with the poor predictive power provide by a
surface wettability parameter across these diverse material libraries for eukaryotic and
prokaryotic cells, discussed in detail elsewhere.43
In the multi pathogen attachment models using the ToF SIMS surface analysis data, the
indicator variables for the pathogen identity were also significant, with the UPEC indicator
variable making a much larger negative contribution to the model than the PA and SA indicator
variables. This may be due to the significantly lower average attachment of UPEC to the polymer
library. The C4H+ ion peak made the largest negative contribution to the model, approximately 3
times larger than the next most significant ion peaks (Figure 5). The dominance of hydrocarbons
with pendent hydrocarbon groups bonded to the ester moiety are more resistant to bacterial
attachment. The exceptions are the C2H3+, C3H , C6H11+ and C6H6O+ ions that made positive
contributions to the model. The C2H3+fragment ion is present in the spectra of all polymers and
is likely to have contributions from both the backbone and the polymer pendant groups. The
C3H peak is present at elevated intensities in the mass spectra of monomers 7, 14 and is
consequently assigned to a fragment of an aromatic ring. C6H11+ could be an aliphatic chain or a
cyclohexane ring fragment (e.g. from monomer 5) but it makes negligible contribution to the
multi pathogen linear model in any case. The C6H6O+ ion fragment comes mostly from the
phenol fragment present in monomer 7. These contributions towards the logF model imply that
small aliphatic groups (all hydrophobic) on the meth/acrylate polymer were correlated with low
bacterial attachment, as was previously reported by Hook et al. and Epa et al.23 24 The more
hydrophilic phenolic fragment C6H6O+ appears to enhance attachment of pathogens in the multi
pathogen model, again consistent with these previous studies. It was conjectured that the
functional groups in the polymer facilitated hydrogen bonding with peptidoglycans, teichoic
acids, proteins, lipopolysaccharides, lipoteichoic acids or exopolysaccharides present on the
bacterial cell surface or that are component of biofilms.
There is relatively little difference between the test set standard errors of prediction (Figure 6)
for models using computed or experimental descriptors (ToF SIMS ion peak dominated). Models
derived from experimental descriptors have larger prediction errors for the PA attachment but
smaller errors for UPEC models (this may also be an artefact of the small training set size of this
data set). Clearly the computed descriptors avoid the need for further experiments, but the
experimental descriptors may be easier to interpret in terms of how the surface chemistry of the
relationship (QSPR) methods, use of computed molecular descriptors is desired as it allows
properties of new molecules to be predicted prior to synthesis. The use of experimentally derived
data may be useful in cases where the characterization experiments have been carried out for
another purpose, or where other synthesis or processing properties have a significant effect or
their performance.
As mentioned previously previous work on bacterial attachment modelling has been reported
Epa et al.24, Hook et al.23 and Sanni et al.25. The simplest modelling approach was by Sanni et al.,
where the authors generated a linear attachment model using a composite descriptor derived
from the log of the octanol water partition coefficient (logP) and number of rotatable bonds in
the monomer. The model was derived from only (meth)acrylate materials containing
hydrocarbon pendant groups and it failed to predict attachment for other chemistries that
promoted greater biofilm formation. The predictions inside this restricted chemical space domain
of applicability had an r2 of 0.67, good for such a simple linear model.
Hook et al. employed a partial least squared (PLS) linear method using ions obtained from
ToF SIMS experiments to find relationship between surface chemistry and bacterial attachment.
The authors were able to make relatively good models for PA and SA with r2 values of 0.68 and
0.76 respectively, while PLS failed to find a statistically valid predictive model for UPEC (r2
<0.3). In this paper, we were able to make substantially improved quantitative models predicting
the polymer attachment of all three pathogens (see Table 3). This shows that sparse selection of
features, combined with an optimal non linear modelling method BRANN, can create
significantly improved predictive models compared to those generated by PLS or other linear
Epa et al. sparse selection of computed, interpretable molecular descriptors generated bacterial
attachment models consistent with those of the current study presented in Table 2. It is
interesting to note that, despite different sets of descriptors being used, models of similar quality
were obtained.
Prediction of the attachment properties of test sets partitioned from a large data set and never
used to generate the model is a pragmatic way of measuring the predictivity power of
computational models. However, the ultimate test is to predict the attachment properties of new
polymers. The models derived for bacterial attachment from computed molecular descriptors
were used to estimate bacterial attachment for two new libraries, one containing polymers made
from 12 monomers Supplementary Table S6), and the other containing 368 polymers derived
from 21 monomers (Supplementary Table S7). Attachment data were obtained for PA and
UPEC. As explained in the Methods section, these polymer attachment experiments used a
different fluorescent protein, mCherry instead of GFP to generate the data used to validate model
predictions. Differences between the different fluorophores meant that quantitative comparisons
between the predicted and measured pathogen attachment to these new monomers could not be
made, and classification methods were employed. Predictions were made for low, medium, or
high pathogen of polymers in the two new libraries based on the distribution of predicted logF
values. Predictions of the multi pathogen and single pathogen attachment (log GPF fluorescence)
models were also normalized and assigned to the low, medium and high attachment classes.
Prediction accuracy was assessed by use of truth tables, and the percentage of class membership
correctly predicted.
As the truth tables for classification by models in Supplementary Figure S7 show, the
predicting the class membership of the new materials in both new polymer arrays. The class
membership for attachment of PA to the larger polymer library was predicted with accuracies of
60% and 71% for the multi pathogen and specific PA models respectively. The class
membership prediction accuracies were slightly lower for the smaller validation polymer library.
In this case PA attachment was predicted with 55% and 40% accuracies for the multi pathogen
model and specific PA model respectively. Given that classes would be assigned correctly 33%
of the time by chance, the specific PA model attachment to the smaller polymer library
predictions are not statistically significant but those of the multi pathogen model are. Adhesion
of UPEC to polymers is generally lower and the experimental error larger, however, both models
predicted the class membership with reasonable accuracies (39% and 46% for multi pathogen
and single pathogen models respectively). Although this study did not allow us to assess the
predicted pathogen attachment to new polymer libraries quantitatively, it does strongly suggest
that the models have useful predictive capabilities that will be helpful in selecting improved
materials with the ability to resist the attachment and biofilm formation for multiple pathogens.
We have shown that it is possible to predict the individual attachment of three important
pathogens to a library of copolymers using a model that employs a specific set of
descriptors. This model can predict the attachment of each pathogen to the polymers with
accuracies similar to those of models specifically trained to predict a single pathogen. This offers
the possibility of developing a generalized description of the response of multiple bacterial
strains to materials. This could ultimately become a framework with which new materials with
broad pathogen resistance can be designed and optimized, rather than relying on ‘one pathogen
associated infections in the clinic and more broadly in other non clinical applications where
formation of biofilms is problematic. We anticipate the multi pathogen modelling approach may
be extendable to more than three pathogens and to experiments where several bacterial species
(or strains) are coexisting. This will open the way for a comprehensive predictive capability that
could be used to assess the suitability of novel materials for highly effective implantable
materials.
. The following files are available free of charge.
Supplementary information showing molecular descriptors used in models, explanation of the
molecular descriptors, correlations of molecular descriptors with logF, correlations of ToF SIMS
ion peaks with logF, experimental and predicted mCherry fluorescence of test polymer libraries,
monomers used in polymer library used to train models, graphs showing predicted attachment
performance for individual pathogen models, histograms of distributions of measured and
predicted attachments for two pathogens, truth tables for predicted pathogen attachment versus
measured attachment, Structures of monomers used to generate small and large validation
polymer libraries(file type, PDF)
AUTHOR INFORMATION
*E mail: [email protected]; [email protected].
The manuscript was written through contributions of all authors. All authors have given approval
This work was supported by the UK Engineering and Physical Sciences Research Council
(EPSRC) grant EP/N006615/1 for the University of Nottingham Programme Grant in Next
Generation Biomaterials Discovery, and a Wellcome Trust grant number 085245.
ABBREVIATIONS
SA, Staphylococcus aureus; PA, Pseudomonas aeruginosa; UPEC, uropathogenic Escherichia
coli; QSPR, quantitative structure property relationships; BRANN, Bayesian regularized neural
network; MLR, multiple linear regression; SEP, standard error of prediction; SEE, standard error
of estimation; ToF SIMS, Time of flight secondary ions mass spectrometry; WCA, water
contact angle; logP, logarithm of the octanol/water partition coefficient; MLREM, multiple
1. Bush, K.; Courvalin, P.; Dantas, G.; Davies, J.; Eisenstein, B.; Huovinen, P.; Jacoby, G. A.; Kishony, R.; Kreiswirth, B. N.; Kutter, E.; Lerner, S. A.; Levy, S.; Lewis, K.; Lomovskaya, O.; Miller, J. H.; Mobashery, S.; Piddock, L. J. V.; Projan, S.; Thomas, C. M.; Tomasz, A.; Tulkens, P. M.; Walsh, T. R.; Watson, J. D.; Witkowski, J.; Witte, W.; Wright, G.; Yeh, P.; Zgurskaya, H. I., Tackling antibiotic resistance. (12), 894 896. 2. Blair, J. M. A.; Webber, M. A.; Baylay, A. J.; Ogbolu, D. O.; Piddock, L. J. V., Molecular mechanisms of antibiotic resistance. (1), 42 51. 3. Holban, A. M.; Gestal, M. C.; Grumezescu, A. M., New Molecular Strategies for
Reducing Implantable Medical Devices Associated Infections. (29), 3375 3382.
4. Al Mohajer, M.; Darouiche, R. O., Sepsis Syndrome, Bloodstream Infections, and Device Related Infections. (6), 1203 1223.
5. Challenge:First Global Patient Safety, WHO Guidelines on Hand Hygiene in Health Care. 2009.
6. Krishnamoorthy, M.; Hakobyan, S.; Ramstedt, M.; Gautrot, J. E., Surface Initiated Polymer Brushes in the Biomedical Field: Applications in Membrane Science, Biosensing, Cell Culture, Regenerative Medicine and Antibacterial Coatings. (21), 10976 11026.
7. Yu, Q.; Wu, Z.; Chen, H., Dual function antibacterial surfaces for biomedical applications. , 1 13.
8. Villapun, V. M.; Dover, L. G.; Cross, A.; Gonzalez, S., Antibacterial Metallic Touch Surfaces. (9), 736.
9. Szunerits, S.; Boukherroub, R., Antibacterial activity of graphene based materials. (43), 6892 6912.
10. Santos, M. R. E.; Fonseca, A. C.; Mendona, P. V.; Branco, R.; Serra, A. C.; Morais, P. V.; Coelho, J. F. J., Recent Developments in Antimicrobial Polymers: A Review. (7), 599.
11. Maas, M., Carbon Nanomaterials as Antibacterial Colloids. (8), 617. 12. von Gundlach, A. R.; Garamus, V. M.; Gorniak, T.; Davies, H. A.; Reischl, M.; Mikut, R.; Hilpert, K.; Rosenhahn, A., Small angle X ray scattering as a high throughput method to classify antimicrobial modes of action. (5), 918 925.
13. Magennis, E. P.; Hook, A. L.; Davies, M. C.; Alexander, C.; Williams, P.; Alexander, M. R., Engineering serendipity: High throughput discovery of materials that resist bacterial
attachment. , 84 92.
14. O'Toole, G. A.; Wong, G. C., Sensational biofilms: surface sensing in bacteria. , 139 146.
15. Pruss, B. M., Involvement of Two Component Signaling on Bacterial Motility and Biofilm Development. (18).
16. Guttenplan, S. B.; Kearns, D. B., Regulation of flagellar motility during biofilm formation. (6), 849 871.
17. Harapanahalli, A. K.; Younes, J. A.; Allan, E.; van der Mei, H. C.; Busscher, H. J., Chemical Signals and Mechanosensing in Bacterial Responses to Their Environment.
18. Wang, Y.; Lee, S. M.; Dykes, G., The physicochemical process of bacterial attachment to abiotic surfaces: Challenges for mechanistic studies, predictability and the development of control strategies. (4), 452 464.
19. Guilhen, C.; Forestier, C.; Balestrino, D., Biofilm dispersal: multiple elaborate strategies for dissemination of bacteria with unique properties. (2), 188 210. 20. Wang, Y.; Lee, S. M.; Dykes, G., The physicochemical process of bacterial attachment to abiotic surfaces: Challenges for mechanistic studies, predictability and the development of control strategies. (4), 452 464.
21. Moorthy, S.; Keklak, J.; Klein, E. A., Perspective: Adhesion Mediated Signal Transduction in Bacterial Pathogens. (1).
22. Hook, A. L.; Chang, C. Y.; Yang, J.; Atkinson, S.; Langer, R.; Anderson, D. G.; Davies, M. C.; Williams, P.; Alexander, M. R., Discovery of novel materials with broad resistance to bacterial attachment using combinatorial polymer microarrays. (18), 2542 2547.
23. Hook, A. L.; Chang, C. Y.; Yang, J.; Luckett, J.; Cockayne, A.; Atkinson, S.; Mei, Y.; Bayston, R.; Irvine, D. J.; Langer, R.; Anderson, D. G.; Williams, P.; Davies, M. C.; Alexander, M. R., Combinatorial discovery of polymers resistant to bacterial attachment.
(9), 868 875.
24. Epa, V. C.; Hook, A. L.; Chang, C.; Yang, J.; Langer, R.; Anderson, D. G.; Williams, P.; Davies, M. C.; Alexander, M. R.; Winkler, D. A., Modelling and Prediction of Bacterial
Attachment to Polymers. (14), 2085 2093.
25. Sanni, O.; Chang, C. Y.; Anderson, D. G.; Langer, R.; Davies, M. C.; Williams, P. M.; Williams, P.; Alexander, M. R.; Hook, A. L., Bacterial attachment to polymeric materials correlates with molecular flexibility and hydrophilicity. (5), 695 701.
26. Fujita, T.; Winkler, D. A., Understanding the Roles of the "Two QSARs". (2), 269 274.
27. Le, T. C.; Winkler, D. A., Discovery and Optimization of Materials Using Evolutionary Approaches. (10), 6107 6132.
28. Ramsundar, B.; Liu, B.; Wu, Z.; Verras, A.; Tudor, M.; Sheridan, R. P.; Pande, V., Is Multitask Deep Learning Practical for Pharma? (8), 2068 2076. 29. Yuan, H.; Paskov, I.; Paskov, H.; Gonzalez, A. J.; Leslie, C. S., Multitask learning improves prediction of cancer drug sensitivity. , 31619.
30. Talevi, A., Multi target pharmacology: possibilities and limitations of the "skeleton key approach" from a medicinal chemist perspective. , 205.
31. Epa, V. C.; Yang, J.; Mei, Y.; Hook, A. L.; Langer, R.; Anderson, D. G.; Davies, M. C.; Alexander, M. R.; Winkler, D. A., Modelling human embryoid body cell adhesion to a
combinatorial library of polymer surfaces. (39), 20902 20906. 32. Hook, A. L.; Scurr, D. J., ToF SIMS analysis of a polymer microarray composed of poly(meth)acrylates with C6 derivative pendant groups. (4), 226 236. 33. Hook, A. L.; Yang, J.; Chen, X.; Roberts, C. J.; Mei, Y.; Anderson, D. G.; Langer, R.; Alexander, M. R.; Davies, M. C., Polymers with hydro responsive topography identified using high throughput AFM of an acrylate microarray. (16), 7194 7197.
35. Mauri, A.; Consonni, V.; Pavan, M.; Todeschini, R., Dragon software: An easy approach
to molecular descriptor calculations. (2), 237
248.
36. Valenzuela, L. M.; Knight, D. D.; Kohn, J., Developing a Suitable Model for Water
Uptake for Biodegradable Polymers Using Small Training Sets. , 6273414.
37. Toropova, A. P.; Toropov, A. A.; Kudyshkin, V. O.; Leszczynska, D.; Leszczynski, J.,
Optimal descriptors as a tool to predict the thermal decomposition of polymers. (5), 1171 1181.
38. Duchowicz, P. R.; Fioressi, S. E.; Bacelo, D. E.; Saavedra, L. M.; Toropova, A. P.;
Toropov, A. A., QSPR studies on refractive indices of structurally heterogeneous polymers. , 86 91.
39. Burden, F. R.; Winkler, D. A., Optimal Sparse Descriptor Selection for QSAR Using
Bayesian Methods. (6 7), 645 653.
40. Burden, F. R.; Winkler, D. A., An Optimal Self Pruning Neural Network and Nonlinear
Descriptor Selection in QSAR. (10), 1092 1097.
41. Burden, F.; Winkler, D., Bayesian Regularization of Neural Networks. In
, Livingstone, D. J., Ed. Humana Press: Totowa, NJ, 2009; pp 23 42.
42. Alexander, D. L. J.; Tropsha, A.; Winkler, D. A., Beware of R2: Simple, Unambiguous
Assessment of the Prediction Accuracy of QSAR and QSPR Models. (7), 1316 1322.
43. Alexander, M. R.; Williams, P., Water contact angle is not a good predictor of biological
responses to materials. (2), 02C201.
44. Tropsha, A.; Gramatica, P.; Gombar, V. K., The importance of being earnest: Validation
is the absolute essential for successful application and interpretation of QSPR models. (1), 69 77.
45. Varnek, A.; Gaudin, C.; Marcou, G.; Baskin, I.; Pandey, A. K.; Tetko, I. V., Inductive
Transfer of Knowledge: Application of Multi Task Learning and Feature Net Approaches to
Model Tissue Air Partition Coefficients. (1), 133 144.
46. Erhan, D.; L'Heureux, P. J.; Yue, S. Y.; Bengio, Y., Collaborative filtering on a family of
biological targets. (2), 626 635.
47. Labute, P., A widely applicable set of descriptors. (4 5),
464 477.
48. Raychaudhury, C.; Ray, S. K.; Ghosh, J. J.; Roy, A. B.; Basak, S. C., Discrimination of
Isomeric Structures Using Information Theoretic Topological Indexes.
TOC
Bacterial infections are common in implanted medical devices used to manage chronic health
conditions. Device infection and pathogen tolerance to antibiotics can be reduced by polymers
that resist the formation of bacterial biofilms. We show that a single machine learning model can
predict attachment of multiple pathogens to polymers for the first time, accelerating development