Introduction
Mental well-being of young people is affected by many aspects of
their lives including school experience (HBSC Briefing Paper 13,
2007), friendships and peer relations (Settertobulte and Gaspar de
Matos, 2004), as well as family life and family relationships (HBSC
Briefing papers 11 & 12, 2007). Adolescence can be a time of
emotional distress for a number of young people, brought on by
biological and psychological changes occurring through puberty, in
conjunction with external changes such as school transitions,
changing peer and friendship networks and changes in family
structure and relationships. Parental separation and re-partnering
often result in further upheavals in the home environment such as
parent-child conflict, economic hardship and family disorganisation.
Good emotional and physical health enables young people to deal
with these challenges and eases the transition through adolescence
(Petersen et al, 1997). Promoting young people’s health can therefore
have long-term benefits for individuals and societies.
In a previous Briefing Paper (HBSC Briefing Paper 2, 2003) age
and gender patterns and trends in mental well-being were presented
using 1994-2002 HBSC survey data. In line with other academic
research findings (West and Sweeting, 2003; Bergman and Scott,
2001), the mental well-being of boys was found to be better than
that of girls and children in primary school had better mental
well-being than those in secondary. Trend data showed some
improvement in happiness and confidence between 1994 and 2002.
This fourteenth Briefing Paper in the HBSC series aims to
examine the personal and social environmental factors known to
affect mental well-being of 11-15 year-olds in Scotland and presents
findings from the Scottish 2006 Health Behaviour in School-Aged
Children: WHO Collaborative Cross-National Survey (HBSC). Trends in
mental well-being between 1994 and 2006 are presented using data
from previous HBSC surveys. The survey methodology is described in
the Technical Appendix.
This paper examines happiness, life satisfaction, perceived health,
confidence and their association with gender, age, family affluence,
family structure and geography. The purpose of the paper is to
increase knowledge and understanding of the mental well-being of
young people in Scotland with a focus on inequalities and to create
a picture of those most at risk of adverse outcomes; to provide
evidence for policy makers and practitioners; and to inform actions
aimed at health improvement among adolescents. HBSC is the Health Behaviour in School-Aged Children: WHO Collaborative Cross-National Study
Mental well-being of young people in Scotland:
1994 – 2006
Kate Levin, Joanna Todd, Dorothy Currie and Candace Currie
Child and Adolescent Health Research Unit, The University of EdinburghSummary of main findings
~ Gender differences and age differences from earlier surveys
persist in 2006 with higher levels of happiness, life
satisfaction, perceived health and confidence among boys
and younger adolescents
~ Young people living with both parents are more likely to
report excellent health, high life satisfaction and happiness
and less likely to report multiple health complaints than
those living in single parent or step families
~ The small proportion of young people who live in remote
rural Scotland have high life satisfaction but those living in
urban areas and accessible towns are more likely to feel
confident. Levels of happiness are highest among girls living
in remote rural Scotland and among boys living in urban
areas and accessible towns
~ Young people from high affluence families are more likely to
report feeling happy and having excellent health than those
from low affluence families and average life satisfaction
increases with family affluence
~ Between 1994 and 2006 young people’s happiness and
confidence has increased and the proportion of young
A demographic breakdown of young people in Scotland
Table 1 gives a breakdown of the percentage of Primary 7 (P7),
Secondary 2 (S2) and Secondary 4 (S4) boys and girls living in
different family structures, geographies and at levels of low, medium
and high family affluence according to the data collected in the
2006 HBSC survey.
Happiness
Young people were asked to rate how happy they feel about their life
at present. Overall, 49% of respondents report being very happy,
52% of boys and 45% of girls. The proportion of young people who
report that they are very happy is highest in P7, approximately 60%
for boys and girls. In S2 this falls to 55% for boys and 44% for girls,
and in S4 to 42% and 31% respectively. Gender differences exist in
S2 and S4 with a higher proportion of ‘very happy’ boys than girls.
Figure 1 presents happiness by family affluence, split into low,
medium and high family affluence (see Appendix). The proportion of
young people who report feeling very happy increases as family
affluence increases. Girls from high affluence families are more likely
to report feeling very happy than those from low affluence families
while there is no significant difference for boys.
0 10 20 30 40 50 60 70
Girls Boys
high FAS medium FAS
low FAS %
Figure 1:Proportion of boys and girls who are very happy by FAS Table 1:Social and demographic characteristics of the 2006 Scottish HBSC sample
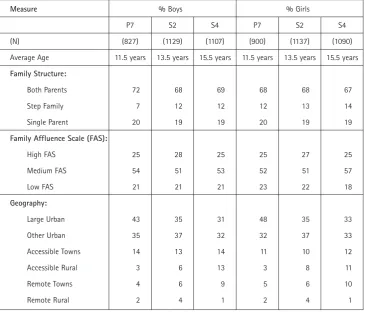
Measure % Boys % Girls
P7 S2 S4 P7 S2 S4
(N) (827) (1129) (1107) (900) (1137) (1090)
Average Age 11.5 years 13.5 years 15.5 years 11.5 years 13.5 years 15.5 years
Family Structure:
Both Parents 72 68 69 68 68 67
Step Family 7 12 12 12 13 14
Single Parent 20 19 19 20 19 19
Family Affluence Scale (FAS):
High FAS 25 28 25 25 27 25
Medium FAS 54 51 53 52 51 57
Low FAS 21 21 21 23 22 18
Geography:
Large Urban 43 35 31 48 35 33
Other Urban 35 37 32 32 37 33
Accessible Towns 14 13 14 11 10 12
Accessible Rural 3 6 13 3 8 11
Remote Towns 4 6 9 5 6 10
Remote Rural 2 4 1 2 4 1
Where percentages do not add up to 100 this is due to rounding.
The proportion of ‘very happy’ boys is higher in urban areas and
accessible towns than in the rest of Scotland (Figure 2). For girls, the
opposite is true with the highest rates of happiness in remote rural
[image:2.595.308.531.494.690.2]Figure 3 shows the trend in the proportion of ‘very happy’ boys
and girls over time. Both boys and girls have seen an increase in
happiness, from 39% and 30% in 1994 to 52% and 45% in 2006 for
boys and girls respectively. Of the three year groups, the greatest rise
in happiness over time is observed among S2 girls and boys.
In 2006 a higher proportion of young people living with both
parents report being very happy compared with those from single
parent or step families.
Life satisfaction
Young people were asked to rate their life satisfaction (see Appendix).
Boys and girls rate their life satisfaction equally in P7 (Figure 4), but
0 10 20 30 40 50 60 70
Girls Boys
Remote Rural Remote
Towns Accessible
Rural Accessible
Towns Other
Urban Large
Urban %
0 10 20 30 40 50 60 70
Girls Boys
2006 2002
1998 1994
%
6.6 6.8 7.0 7.2 7.4 7.6 7.8 8.0 8.2
Girls Boys
Secondary 4 Secondary 2
[image:3.595.305.519.129.317.2]Primary 7 Figure 2:Proportion of boys and girls who are very happy by
geography
6.6 6.8 7.0 7.2 7.4 7.6 7.8 8.0
Girls Boys
high FAS medium FAS
[image:3.595.58.280.130.324.2]low FAS 8.2
Figure 3:Trends in the proportion of boys and girls who are very happy
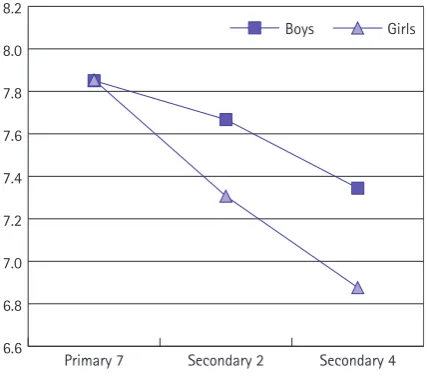
[image:3.595.57.279.380.570.2]Figure 4:Average life satisfaction score by age and gender
Figure 5:Average life satisfaction score by FAS
in S2 gender differences emerge and by S4 these are larger still, with
an average life satisfaction score of 7.34 for boys and 6.88 for girls.
Figure 5 presents average life satisfaction scores by family
affluence. Girls and boys with low family affluence have lower
average life satisfaction than those who have medium or high family
affluence. Life satisfaction rises with family affluence and this rise is
particularly great amongst S2 girls and S4 boys.
Life satisfaction is higher for boys and girls living with both
parents and among young people living in remote rural Scotland. Life
satisfaction was measured only in 2002 and 2006 surveys so it is not
possible to report trends. There is no change in the life satisfaction
[image:3.595.305.520.383.569.2]Subjective indicators of health
Subjective indicators of health are a way of assessing perceived
levels of mental well-being. The two indicators presented here are in
response to questions asking young people to rate their health. The
first relates to general health, while the second provides a list of
symptoms from which the young person may select and note
frequency. Subjective health complaints may be physiological,
psychological or a combination of the two, and many are associated
with depression in young adulthood and adolescence (Vasquez and
Blanco, 2006; Garber et al, 1991). Previous research has shown that
depressive symptoms like sleeping problems in adolescence predict
future depression in adulthood (van Lang et al, 2007).
Perceived health
Boys are more likely to rate their health as excellent than girls, 26%
compared with 17%. This gender difference is smallest at P7 and
greatest at S4 (Figure 6), where more than twice as many boys than
girls rate their health as excellent. This is consistent with all HBSC
countries (Cavallo et al, 2006).
Figure 7 presents the proportion of boys and girls who perceive
their health to be excellent within different family structures. Young
people living with both parents are more likely to report having
excellent health, compared with those living in single parent or step
families. Approximately 20% of boys and 14% of girls from step and
single parent families describe their health as excellent, compared
with 28% and 18% of boys and girls respectively who live with both
parents.
Young people from high affluence families are more likely to
report excellent health than those from low affluence families.
Perceived health as measured here was reported only in 2002 and
2006 so it is not possible to report trends. There are no differences in
reported health between 2002 and 2006.
Multiple health complaints
Young people are described as having multiple health complaints if
they report having two or more common symptoms (see Appendix),
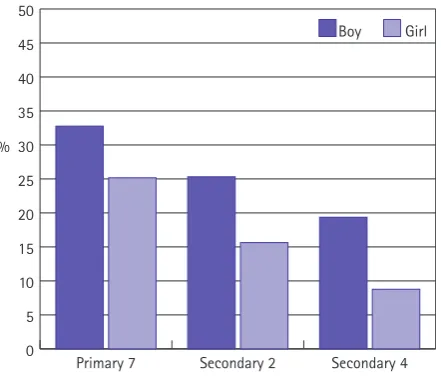
each at least twice a week. Twenty two percent of boys and 31% of
girls have multiple health complaints. The breakdown by age group is
shown in Figure 8. The gender difference is largest for S4 pupils of
whom 37% of girls and 21% of boys have multiple health
complaints.
The proportion of young people reporting multiple health
complaints has fallen over time from 27% and 37% in 1994 to 22%
and 31% in 2006 for boys and girls respectively (Figure 9).
Examination of 2006 data shows that the proportion of girls and
boys reporting multiple health complaints falls as family affluence
rises. Young people living with both parents are less likely to have
multiple health complaints than those living in other family types.
0 5 10 15 20 25 30 35 40 45 50
Girl Boy
Secondary 4 Secondary 2
[image:4.595.308.529.114.303.2]Primary 7 %
Figure 6:Proportion of young people with excellent health
0 5 10 15 20 25 30 35 40 45 50
Girls Boys
step family single parent
[image:4.595.309.529.354.540.2]both parents %
Figure 7:Proportion of young people with excellent health by family structure
0 5 10 15 20 25 30 35 40 45 50
Girls Boys
Secondary 4 Secondary 2
[image:4.595.309.528.593.776.2]Primary 7 %
Confidence
When asked how often they feel confident in themselves, 20% of
young people in Scotland respond that they always feel confident.
Boys are more likely to report always feeling confident (25%
compared with 16% of girls) and confidence is greatest amongst P7s
(28%) and lowest among S4s (13%). The gender difference is
greatest at the older age groups with approximately twice as many
boys than girls always feeling confident.
Boys living in urban areas and accessible towns feel more
confident than their rural contemporaries (Figure 10). Remote rural
Scotland has the lowest rates of confidence for boys (13%) and girls
(10%).
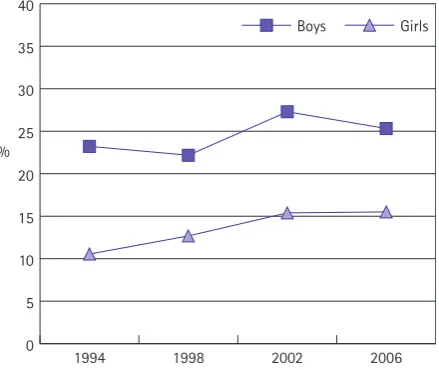
Among girls in Scotland the proportion always feeling confident
has risen from 11% in 1994 to 16% in 2006 (Figure 11). Boys’
confidence has also increased slightly during this period, from 23%
to 25%, but this rise is not statistically significant.
Discussion
Previous research has shown that emotional and mental health
problems in childhood and adolescence are predictors of risk
behaviours such as smoking (Dierker LC et al, 2007), drinking
(Verdurmen et al, 2005), eating disorders (Beato-Fenrnadez et al,
2004) and violence (Craig & Harel, 2004). Mental well-being and
behavioural problems during childhood and adolescence may predict
these problems in adulthood (Roza et al, 2003; Aalto-setala et al,
2002). Early intervention to ensure mental well-being and to prevent
mental health problems among adolescents is therefore not only
beneficial during the teenage years but also in the longer term.
The Scottish Executive’s National Programme for Improving
Mental Health and Well-Being (Scottish Executive, 2003) focuses on
promoting mental well-being, preventing mental health problems,
supporting those experiencing mental health problems, reducing
inequalities in mental health and eliminating the stigma attached to
mental health problems. One of its six priority areas is children and
young people. ‘The Mental Health of Children and Young People: a
framework for promotion, prevention and care’ proposes to invest in
supporting mental health services for young people and eliminating
mental illness, as well as promoting mental well-being among young
people in Scotland.
Historically mental health has been assessed using indicators of
psychiatric morbidity. However, in taking a broader view of mental
health it is important to assess the level of mental well-being and
track it over time. Health Scotland’s Indicator Programme plans are
underway to develop national indicators for this age group. The
Scottish HBSC study is currently one of the only national sources of
information on young people’s mental well-being.
This briefing paper has shown that a number of HBSC indicators
of mental well-being have improved over time and there has been a
narrowing of gender differences in happiness and confidence, as well
as in feeling left out and helplessness (not shown here).
0 5 10 15 20 25 30 35 40 45 50
Girls Boys
2006 2002
1998 1994
[image:5.595.309.528.129.314.2]%
Figure 9:Trends in the proportion of boys and girls with multiple health complaints
0 5 10 15 20 25 30 35 40
Girls Boys
Remote Rural Remote
Towns Accessible
Rural Accessible
Towns Other
Urban Large
[image:5.595.309.528.369.563.2]Urban %
Figure 10:Proportion of boys and girls always confident by geography
0 5 10 15 20 25 30 35 40
Girls Boys
2006 2002
1998 1994
%
[image:5.595.308.528.607.792.2]Nevertheless, boys have higher rates of mental well-being compared
with girls and mental well-being of 11 year olds is better than that
of 15 year olds. This paper has shown that the environment in which
young people grow up is associated with various indicators of
mental well-being. Specifically, family structure, family affluence and
geography of residence are all associated with mental well-being of
young people. The protective effect of good parent-child
communication was shown in a previous briefing paper (HBSC
Briefing Paper 12, 2007). Parents, teachers and health professionals
all play a role in supporting young people and promoting mental
well-being among adolescents in Scotland. Earlier briefing papers
have shown the importance of the school environment and
interpersonal relationships on the mental well-being of adolescents,
(HBSC Briefing Paper 10, 2004; HBSC Briefing Papers 12 & 13, 2007).
Future work will investigate whether the improvement in mental
well-being observed between 1994 and 2006 has been experienced
equally across social groups.
TECHNICAL APPENDIX
Scotland, along with 41 other countries in Europe and North America,
participated in the 2005/2006 Health Behaviour in School-Aged
Children (HBSC): WHO Collaborative Cross-National Survey. Previous
surveys were conducted in 1989/90, 1993/94, 1997/98 and 2001/02
and findings from these have been published in a series of international
and Scottish reports and briefing papers listed at the end of this
document which can be found at www.education.ed.ac.uk/cahru/.
The 2006 HBSC survey in Scotland
The 2006 HBSC survey was carried out in 198 schools across Scotland.
Pupils from mixed ability classes anonymously completed
question-naires in the classroom. The sample was nationally representative
and included pupils from Primary 7 (11-year-olds, n=1727),
Secondary 2 (13-year-olds, n=2266) and Secondary 4 (15-year-olds,
n=2197) giving a total sample of 6,190. On completion of fieldwork,
national data files were prepared using the standard documentation
procedures of the HBSC International Protocol and submitted to the
HBSC International Data Bank at the University of Bergen, Norway.
Notes on statistics
When differences between proportions are specifically commented
on in this briefing paper these differences are statistically significant
at 95% unless otherwise stated.
HBSC items reported in this briefing paper
Family Affluence Scale
The schoolchildren surveyed were assigned low, medium or high FAS
classification where FAS 1 (score = 0–3) indicates low affluence; FAS
2 (score = 4, 5) indicates middle affluence; and FAS 3 (score = 6, 7)
indicates high affluence. Scores were calculated using the following
survey items:
Does your family own a car, van or truck? Response categories
were: No (= 0), Yes, one (= 1), Yes, two or more (= 2). This item is a
component of a Scottish deprivation index developed by Carstairs
and Morris (Carstairs & Morris, 1991), which is used widely in
research on health inequalities.
Do you have your own bedroom for yourself? Response categories
were: No (= 0), Yes (= 1). This item is a simple proxy for overcrowding,
classified by Townsend (Townsend, 1987) as housing deprivation; it is
also a component of the Scottish deprivation index.
During the past 12 months, how many times did you travel away
on holiday with your family? Response categories were: Not at all (=
0), Once (= 1), Twice (= 2), More than twice (= 2). This item is a
measure of deprivation in home facilities (Townsend, 1987).
How many computers does your family own? Response categories
were: None (= 0), One (= 1), Two (= 2), More than two (= 2). This
item has been added to the questionnaire since the 2001/2002
survey to identify families with higher socioeconomic status in
affluent countries.
Family Structure
Young people were asked to describe which adults they lived with in
their main home (where they live most of the time) and given
options from which they could tick as many as they wished: Mother,
Father, Stepmother (or father’s partner), Stepfather (or mother’s
partner), Grandmother, Grandfather, I live in a foster or children’s
home, Someone or somewhere else. Only the first four categories
were included in this paper.
Urban-Rural Classification
The Urban-Rural classification was assigned by school postcode.
Young people were classified as living in one of the following: Large
urban areas (the four cities: Glasgow, Edinburgh, Aberdeen and
Dundee), other urban areas (settlements with population
10,000-125,000), accessible towns (settlements of 3-10,000 people within a
30 minute drive of a settlement of 10,000 or more), accessible rural
(settlements of less than 3,000 people within a 30 minute drive of a
settlement of 10,000 or more), remote towns (settlements of
3-10,000 people more than a 30 minute drive of a settlement of
10,000), remote rural (settlements of less than 3,000 people more
than a 30 minute drive of a settlement of 10,000).
Happiness
Young people were asked: In general, how do you feel about your life
at present? …Response options were: I feel very happy, I feel quite
happy, I don’t feel very happy, I’m not happy at all.
Life satisfaction
Life satisfaction was measured using the following question
accompanying a picture of a ladder: Here is a picture of a ladder –
bottom is the worst possible life – in general where on the ladder do
you feel you stand at the moment? A score of 6 or more was defined
as a high life satisfaction.
Perceived health
The question used was: Would you say your health is…Response
options were: Excellent, Good, Fair, Poor.
Health complaints
Young people were given a checklist and asked: In the last 6 months
how often have you had the following: Headache, Stomach-ache,
Back-ache, Feeling low, Irritability or bad temper, Feeling nervous,
Difficulties in getting to sleep, Feeling dizzy. Response options were:
About every day/More than once a week/ About every week/About
every month/Rarely or never. Young people were described as having
multiple health complaints if they reported having two or more
health complaints at least twice a week.
Acknowledgements
We thank the Regional and Island Authorities for granting permission
for their schools to participate in the survey; and all the young people
who completed questionnaires; and the schools and teachers who
kindly agreed to administer the survey.
Acknowledgement is made to all members of the international
HBSC research network who prepared the HBSC protocol, collected
national data and the support of the WHO Regional Office for Europe.
We are grateful to Emma Hogg, Jane Parkinson, Wendy Hearty
and David Gordon for their comments on earlier drafts of this paper.
The HBSC study in Scotland is funded by NHS Health Scotland.
HBSC publications and HBSC Information
Further information on the international report from the 2005/06
survey can be obtained from the International Study website
www.hbsc.org. The International Coordinating Centre of the HBSC
Study is the Child and Adolescent Health Research Unit (CAHRU),
The University of Edinburgh.
HBSC Briefing Papers from earlier surveys include:
Briefing Paper 1: Introduction, background and dissemination of the 2002 HBSC survey in Scotland.
Briefing Paper 2: Mental well-being among schoolchildren in Scotland: age and gender patterns, trends and cross-national comparisons.
Briefing Paper 3: Gender Matters: Physical activity patterns of schoolchildren in Scotland.
Briefing Paper 4: Mental-health and well-being in the context of school: Young people in Scotland.
Briefing Paper 5: How are Scotland’s young people doing? A cross-national perspective on physical and emotional well-being.
Briefing Paper 6: How are Scotland’s young people doing? A cross-national perspective on health-related risk.
Briefing Paper 7: How are Scotland’s young people doing? A cross-national perspective on physical activity, TV viewing, eating habits, body image and oral hygiene.
Briefing Paper 8: Bullying and fighting among schoolchildren in Scotland: age and gender patterns, trends and cross-national comparisons.
Briefing Paper 9: Social Context of Bullying Behaviours.
Briefing Paper 10: Bullying: Health, Well-being and Risk Behaviours. Briefing Paper 11: Family affluence and health among schoolchildren. Briefing Paper 12: Family structure and relationships and health among schoolchildren.
Briefing Paper 13: Perceptions of school and health of schoolchildren.
References
Aalto-Setala T, Marttunen M, Tuulio-Henriksson A, Poikolainen K, Lonnqvist J (2002). Depressive symptoms in adolescence as predictors of early adulthood depressive disorders and maladjustment. American Journal of Psychiatry, 159; 1235-1237.
Beato-Fernandez L, Rodriguez-Cano T, Belmonte-Llario A, Martinez-Delgado C (2004). Risk factors for eating disorders in adolescents – a Spanish
community-based longitudinal study. European Child & Adolescent Psychiatry, 13; 287-294.
Bergman MM and Scott J (2001). Young adolescents’ well-being and health risk behaviours: gender and socioeconomic differences. Journal of Adolescence, 24; 183-197.
Carstairs, V. and Morris R (1991) Deprivation and Health in Scotland, Aberdeen University Press.
Cavallo F, Zambon A, Borraccino A, Ravens-Sieberer U, Torsheim T, Lemma P (2006). Girls growing through adolescence have a higher risk of poor health. Quality of Life Research, 15; 1577-1585.
Craig W and Harel Y. Bullying, physical fighting and victimization. In: Currie et al Young People’s Health in Context; Health Behaviour in School-Aged Children: WHO Cross-National Study (HBSC), International Report from the 2001/02 survey, WHO, Copenhagen.
Dierker LC, Vesel F, Sledjeski EM, Costello D, Perinne N (2007). Testing the dual pathway hypothesis to substance use in adolescence and young adulthood. Drug and Alcohol Dependence, 87; 83-93.
Garber J. Walker LS, Zeman J (1991). Somatization symptoms in a community sample of children and adolescents: further validation of the children’s somatization inventory. Psychological Assessment, 3; 588-595. Petersen AC, Leffert N, Graham B, Alwin J and Ding S (1997). Promoting mental health during the transition into adolescence. In: Schulenberg J, Maggs JL, Hurrelmann K. Health Risks and Developmental Transitions During Adolescence. New York: Cambridge University Press.
Roza SJ, Hofstra MB, van der Ende J, Verhulst FC (2003). Stable prediction of mood and anxiety disorders based on behavioural and emotional problems in childhood: a 14-year follow-up during childhood, adolescence and young adulthood. American Journal of Psychiatry, 160; 2116-2121.
Settertobulte W and Gaspar de Matos M. Peers. In: Currie et al Young People’s Health in Context; Health Behaviour in School-Aged Children: WHO Cross-National Study (HBSC), International Report from the 2001/02 survey, WHO, Copenhagen.
Scottish Executive (2003). National programme for improving mental health and well-being: Action Plan 2003-2006.
Townsend, P. (1987) Deprivation. Journal of Social Policy, 16; 125-46. van Lang NDJ, Ferdinand RF, Verhulst FC (2007). Predictors of future depression in early and late adolescence. Journal of Affective Disorders, 97; 137-144.
Vazquez FL and Blanco V (2006). Symptoms of depression and related factors among Spanish university students. Psychological Reports, 99; 583-590. Verdurmen J, Monshouwer K, van Dorsselaer S, Ter Bogt T, Vollebergh W (2005). Alcohol use and mental health in adolescents: interactions with age and gender- findings from the Dutch 2001 Health Behaviour in School-Aged Children survey. Journal of Studies on Alcohol, 66; 605-609.
D
es
ig
n
ed
a
n
d
p
ro
d
u
ce
d
fo
r
C
A
H
R
U
b
y
S
u
sa
n
H
a
lc
ro
,
C
o
m
m
u
n
ic
a
ti
o
n
s
a
n
d
M
a
rk
et
in
g
,
Th
e
U
n
iv
er
si
ty
o
f
E
d
in
b
u
rg
h
.
Contact for information
Kate Levin
Child & Adolescent Health Research Unit (CAHRU) The Moray House School of Education
The University of Edinburgh St Leonard’s Land, Holyrood Road Edinburgh EH8 8AQ
Joanna Todd Tel: 0131 651 6547 Email: kate.levin@ed.ac.uk