Small Sample Deep Learning for Newborn Gestational Age Estimation
Mercedes Torres Torres
1, Michel F. Valstar
1, Caroline Henry
2Carole Ward
2and Don
Sharkey
21 School of Computer Science, University of Nottingham
2 School of Medicine, Univeristy of Nottingham
Abstract— A baby’s gestational age determines whether or not they are preterm, which helps clinicians decide on suitable post-natal treatment. The most accurate dating methods use Ultrasound Scan (USS) machines, but these machines are expensive, require trained personnel and cannot always be deployed to remote areas. In the absence of USS, the Ballard Score can be used, which is a manual postnatal dating method. However, this method is highly subjective and results can vary widely depending on the experience of the rater. In this paper, we present an automatic system for postnatal gestational age estimation aimed to be deployed on mobile phones, using small sets of images of a newborn’s face, foot and ear. We present a novel two-stage approach that makes the most out of Convolutional Neural Networks trained on small sets of images to predict broad classes of gestational age, and then fuse the outputs of these discrete classes with a baby’s weight to make fine-grained predictions of gestational age. On a purpose-collected dataset of 88 babies, experiments show that our approach attains an expected error of 6 days and is three times more accurate than the manual postnatal method (Ballard). Making use of images improves predictions by 30% compared to using weight only. This indicates that even with a very small set of data, our method is a viable candidate for postnatal gestational age estimation in areas were USS is not available.
I. INTRODUCTION
According to the World Health Organisation (WHO), 10% of babies are born prematurely each year, amounting to over 15 million preterm babies annually [1]. Complications related to preterm birth remain the leading cause of death for children under 5 years [2], with over 1 million deaths just in 2013 [3]. Estimates suggest that over 75% of these deaths could be prevented with the right treatment [5].
Gestational age helps clinicians determine whether or not a newborn is preterm and their degree of prematurity [4]. This estimation influences the treatment that the babies receive and can, consequently, harm the newborns if estimated incor-rectly. In high-income countries, the gestational age of a baby is calculated prenatally with extreme accuracy thanks to early dating scans performed using USS and trained personnel [6]. However, in regions where USS cannot be deployed due to the remoteness of the area or lack of funding, the estimation of gestational age is a challenge. In these countries, in which the rate of preterm births can reach up to 18% [2], the most widely used method is the Ballard Score, a manual scoring system that looks at neuromuscular and physical attributes of newborns. This method requires significant training and, even then, it is subjective and prone to errors, specially in low-income countries [7], [8]. The Ballard score is primarly based
(a) Face (b) Foot (c) Ear
[image:1.595.326.546.181.306.2](d) Face (e) Foot (f) Ear
Fig. 1: Example of images from our database.
on visual analysis of a baby’s features. Thus, the opportunity for a computer-vision based analysis is tantalising.
In this paper, we present an alternative method for postna-tal gestational age estimation that eliminates the subjectivity issues present in the Ballard Score. The main contribution of this paper is an end-to-end system for automatic gestational age estimation using a small set of images from a baby’s face, foot, and ear.
Our Small Sample Deep Learning approach features a novel method that combines Convolutional Neural Networks (CNNs) and linear regression, and is particularly suited for small and skewed datasets, such as our own. Whilst the task is essentially a regression problem, we reduce the output space of the Deep Learning component to five major cate-gories (extremely preterm, very preterm, moderately preterm, term, and late term), each of which is predicted with a certain probability. These probabilities are then combined with the weight of the babies using a simple but effective linear regressor. This allows us to maintain the fine-grained prediction required by the original regression task while still being able to benefit from deep learning’s ability to automatically learn features from the images.
Results show that, even with data of only 88 babies (see Fig. 1), we are able to improve the current manual state-of-the-art, the Ballard score by a factor of 3.10, resulting in gestational age estimations accurate to 8 days RMSE, or 6 days expected error (standard deviation).
This paper is structured as follows: Section II gives an overview of the relevant literature in the fields of gestational age estimation, pre and postnatal, general age estimation, and segmentation. Section III describes the data that we have collected of 88 babies as part of this project and discusses
the major challenges that we have faced in doing so. Section IV describes in detail the characteristics of the two-step method developed in this paper, while Section V presents and discusses the results obtained using this method. Finally, Section VI summarises this paper and discusses future work.
II. LITERATURE REVIEW
In this section, we briefly review relevant literature on three main topics: Gestational Age Estimation, Age Estimation and Image-based Segmentation.
A. Gestational Age Estimation
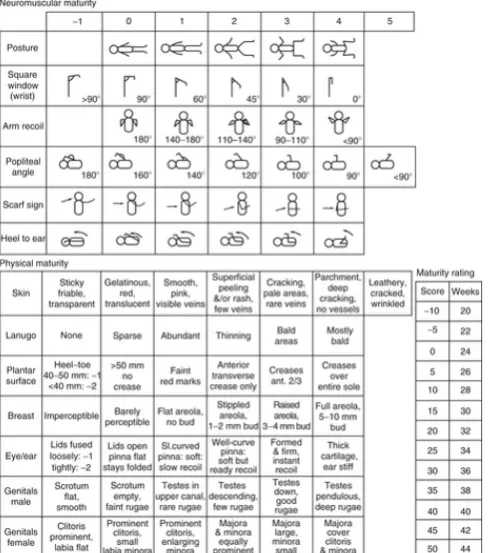
There are three major methods currently used for gestational age estimation: Ultrasound Scans (USS), Last Menstrual Period (LMP), and clinical assessment such as the Ballard Score [9]. USS are prenatal and accurate to within a day if performed early in pregnancy [6]. However, USS machines can be inaccurate if used outside the first trimester and are expensive and not deployable to many rural areas [9]. Additionally, they require trained personnel to use them, and report biased estimations for very large or small fetuses [9]. The LMP and Ballard methods, in comparison, are postna-tal, low-cost and easy to deploy [10], [11]. The LMP method calculates the gestational age of a baby from the mother’s last menstruation until the birth of the baby [9]. On the other had, the Ballard score (shown in Fig. 2) looks at two different sets of measurements regarding the newborn: Neuromuscular and Physical criteria. Neuromuscular criteria include posture, square window, arm recoil, popliteal angle, scarf sign, and heel to ear measurements, while Physical criteria include skin, ear/eye, lanugo hair, plantar surface, breast bud and genital measurements. Using the LMP entails estimation problems due to uncertainty, very often due to bleeding not related to periods or delayed ovulation, and using the Ballard Score is reported to be subjective, dependent on the clinicians’ experience and, overall, inaccurate [9].
Few researchers have attempted to develop methods of automatic gestational age estimation. Most research is in Anthropology and focuses on using simple techniques, like linear regression, and measurements of skeletal remains or brain weight [12], which are nearly impossible to obtain in rural settings.
This paper presents an alternative to these methods. It is automatic and combines the objectivity and accuracy of the USS scans, and the ease of use and accessibility of the LMP and the Ballard score.
B. Automatic Age Estimation
Automatic Gestational Age Estimation is in many ways related to Automatic Age Estimation. Here we provide a general overview of popular methods for age classification. The problem of Age Estimation has recently gained pop-ularity within the Computer Vision community, with many databases released and challenges organised [15], [14].
[image:2.595.315.560.55.332.2]Being essentially a Computer Vision task, the current state-of-the-art methods use Deep Learning in one form or another [14], [15], [16], [17]. However, one thing that
Fig. 2: The Ballard test. Neuromuscular and Physical infor-mation is measured to give an estimate of the gestational age of the newborn postnatally.
separates our problem from traditional age estimation, and consequently makes these methods unsuitable, is the ease with which data can be made available. In [14], participants were given thousands of images from different people, while [17] needed tens of thousands of images to apply Convolu-tional Neural Networks (cNNs) to classify images according to age. In stark contrast, our dataset consists of only 88 babies. For this reason, we decided to apply the techniques of deep learning, but had to overcome the challenge to create a new method that would work for the type of real data that we were collecting (small and skewed samples).
C. Image-based Segmentation
A vast amount of research has been done in the area of segmentation, particularly in the area of biomedical imagery [18], [19]. Again, and unsurprisingly, the current state-of-the-art uses Deep Learning. One of the most popular contemporary approaches are Fully Convolutional Neural Networks (FCNs, [20]). FCNs approach segmentation as a per-pixel classification problem and modify traditional CNNs by substituting the final fully-connected layers for 1x1 convolutions. Due to their robust and accurate results in problems such as object recognition [20], we have decided to apply FCNs in the first stage of our system.
III. DATA COLLECTION
to obtain ground truth data to learn our algorithms we needed to recruit participants for whom the gestational age was determined by USS, our gold standard. Participants were sorted into five different classes according to their degree of prematurity using a standard World Health Organisation categorisation scheme. These classes are shown in Table I.
Participants were recruited by medical staff at the Queen’s Medical Centre (Nottingham), who approached parents of newborn babies on the maternity ward and the neonatal intensive care unit. Ethics approval for this study was ob-tained from the National Health Service in the UK (NHS ethics committee approval, ref. 15/EM/0173), and from the School of Computer Science at the University of Nottingham. After informed consent had been taken, data collected from participants resulted in two sets of data:
Images of the participant’s face, foot and ear. In some cases, particularly in the case of newborns aged 28 weeks of gestation or less (extremely preterm), who are connected to machines, some of these images were difficult or impossible to obtain. Of the 88 participants recruited to date, 88 supplied foot images, 81 supplied ear images and 80 supplied face images. Additionally, each participant had between 2 to 10 images taken from each different body part, depending on the risk involved in taking them. More information about the number of babies and photographs from each class can be found in Table I.
[image:3.595.350.522.53.167.2]Case Report Forms (CRF) with relevant information such as the gestational age of the baby, days of life at the time of the visit, current weight, Ballard Score as performed by the medical team in charge of recruiting participants (blinded to the gestational age of the baby), the medical history of the mother, and information about the delivery. The information on this document was used to collect the ground truth for the age estimation. All data was anonymised to guarantee that information could not be used to trace participants.
TABLE I: Data Distribution in terms of Babies and Images. w stands for Weeks gestation
Babies Images Face Foot Ear Extremely (≤28w) 8 26 46 13
Very (28 to 32w) 22 73 161 49 Moderate (33 to 36w) 22 86 119 53 Term (37 to 40w) 18 68 140 50 Late (≥40w) 18 50 166 17
Total 88 303 632 207
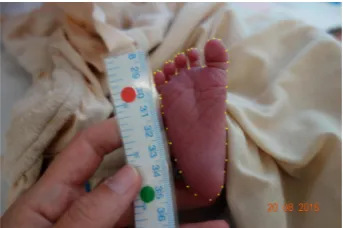
Since part of our system first needs to automatically locate the different body parts within the image, landmarks were annotated in the images, which were then used to train and test our segmentation step. This required the effort of 3 annotators who employed over 300 hours of work in the span of four months.
Foot images required 43 points, while face images needed 68 points and ear images needed 44 points. An example of an annotated foot is shown in Fig. 3
[image:3.595.73.279.516.593.2]The sensitive nature of this project and the characteristics of the participants needed resulted in a number of challenges
Fig. 3: An example of an annotated foot image with 43 points.
that affected both the data collection stage and computation stage. The team behind the project encountered two main challenges:
1. Recruiting babies: Recruiting moderately preterm, term, and late babies was straightforward and successful, since the babies were not undergoing any invasive treatment and taking photos did not incur in any additional stress for them. However, understandably, parents of extremely and very preterm babies were too worried about their child and about potentially interrupting their serious treatment to take photographs. As a result, despite our best effort our database is somewhat skewed towards moderately preterm, term and late babies.
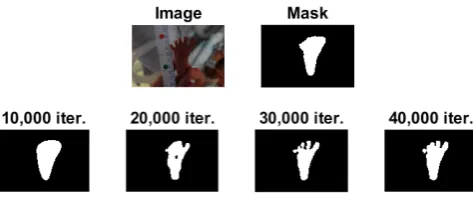
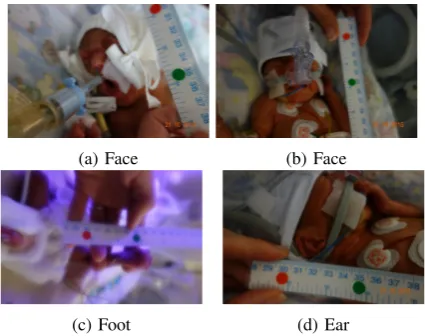
2. Taking high-quality photos:Not only were extremely and very preterm babies difficult to recruit, they were also hard to photograph, due to the babies being inside incubators and connected to machines. This resulted in members of our team not being able to collect images from babies belonging to these categories or in the images being blurry or heavily occluded by clothes, patches or machines. A visual example of the effects of this challenge is shown in Fig. 4. These photographs were too blurry or had too much occlusion to be suitable to be used in our dataset. In particular, Fig. 4a exemplifies the type of occlusion that many photographs of extremely and very preterm babies had.
The effects of these challenges are shown in Table I, where the differences between extremely preterm babies (8 participants, adding up to a total of 75 images) and moderately preterm babies (with 22 participants and 283 images) are seen. The babies recruited to date were collected from October 2015 to September 2016.
IV. SMALL SAMPLE DEEP LEARNING
Our Small Sample Deep Learning method presented in this paper, and shown in Fig. 5, can be divided into two stages:
(a) Face (b) Face
[image:4.595.70.283.52.220.2](c) Foot (d) Ear
Fig. 4: Examples of challenging images. Major challenges include blurry images due to incubator conditions or heavy occlusion due to babies receiving treatment.
A. Segmentation
The first stage of the system is carried out using Fully Convolutional Neural Networks (FCNs), developed in [20]. We have used FCNs to segment the images taken by our team and localise where the foot, ear and face are within each image. FCNs are the current state-of-the-art method for segmentation [20]. They use the same architecture as a VGG network [21] with one major difference: the traditional fully-connected layers are replaced by 1x1 convolutions. This allows them to provide a per-pixel classification and, consequently, segment the original image.
As shown in Fig. 5, the input of this stage are the pre-processed images from our dataset. The output of the FCNs are binary masks in which pixels that were predicted as part of the body parts that were being classified are activated. The ground-truth used in this stage are binary masks created using the polygons that resulted from manual annotations. In these masks, pixels equal to 1 belong to feet, faces or ears and pixels with a value of 0 are part of the background.
Once the predicted segmentation masks were obtained, a simple post-processing stage was carried out to isolate the activated regions that belonged to either the ear, face and foot of the babies. Since some of the images showed the clinician’s hands or other parts of the baby, such as their legs, we found that some patches of flesh from these regions were sometimes predicted as ear, face and foot. In a post-processing step the region with the largest area of activated pixels was retained while discarding any other spurious regions of activation. This successfully removed many incorrectly predicted pixels.
B. Gestational Age Estimation
The second stage of our framework, and the main con-tribution of this paper, is the Gestational Age Estimation stage. For this stage, we created a new architecture of CNNs, called CVL17, specifically designed for small and imbalanced datasets. We have also created a novel method of combining this architecture with linear regression to obtain
an estimation of the ages in days. The advantages of this process are three-fold. It allows us to:
• Take advantage of current state-of-the-art methods, CNNs, even when our input data does not fit the criteria that CNNs usually require (large amounts and balanced classes).
• Combine visual information and anthropometric mea-sures, such as the weight of the babies in the decision-making process.
• Provide an estimate of the gestational age in weeks, instead of classes. These results are, by definition, more finer-grained.
Training of our Small Sample Deep Learning structure consists of two phases:
1. Convolutional Neural Networks:CNNs were used to classify images according to five coarse classes (presented in Section III). Since our dataset was relatively small and there was a high imbalance between babies who were born before 28 weeks and babies that were 35 weeks or older, we decided against grouping participants according to their gestational age in weeks. This would have resulted in 14 classes (from 26 weeks-old to 40 weeks-old) with extremely small sample sizes. In fact, some classes would even have had no examples at all. Grouping participants into five classes guaranteed heavily populated classes with a balanced distribution of images between them.
For the purpose of training small sets of data, we created our own network: CVL17. CVL17 is a 17-layer CNN, which was designed to work with a limited and skewed set of data: it is “deep” enough that features can be learned and, at the same time, it is “shallow” enough that it can classify images confidently. CVL17 was implemented using Caffe. It uses 128x128p RGB images as the input and it is composed of four distinct blocks of layers. The first three blocks follow the same pattern: Convolution, ReLu, Convolution, ReLu, Pooling. Each block reduces the dimension of the input feature vector by half. The last block of layers is composed of two fully-connected layers. The first one has 100 outputs and the second one has 5, according to the 5 classes we want to recognise. We use a SoftMaxLoss layer to measure error. Since we are using images from three different regions, we train separate cNNs for the feet, face and ear.
Fig. 5: Overview of the whole process when feet and ear photographs are combined. The first step, FCNs, were developed by [20]. w stands for the baby’s weight at birth.peis the probability of the test image belonging to the extremely preterm class, pv is the probability of the test image belonging to the very preterm class, pm is the probability of the test image belonging to the moderately preterm class,ptis the probability of the test image belonging to the extremely term class, and plis the probability of the test image belonging to the late term class. Newborn’s stock photo from [22]
The 5-dimensional image-based probability vectors are combined with the weight of the participants and used as the input of a simple linear regressor, which outputs an estimate of the gestational age of the babies in weeks.
V. EXPERIMENTS
To test our system, we carried out a series of experiments using 5-fold subject-independent cross-validation. This guar-antees no overlap between photos from babies used during training and photos from babies used during testing. We use two-stage cross-validation. In the first stage, we do subject-independent cross-validation to generate predictions made by the CNN. We then treat these predictions as the features of our second stage, where we evaluate the linear regressors again using subject-independent cross-validation.
The purpose of these experiments was to prove three different hypotheses, all of which were supported through testing:
1) FCNs can be used to accurately locate faces, feet and ears within the images of our database.
2) Increasing the number of images directly results in an overall improvement across all metrics studied. 3) Combining the weight of a baby and visual information
can improve the current state-of-the-art in terms of postnatal methods.
Due to the small number of images in our dataset, we needed the characteristics of our images in terms of size, orientation and perspective to be as similar as possible. Assuring that all images had the same properties would diminish and even eliminate any negative effect that vari-ations on size and layout could bring into the segmentation and estimation process. However, circumstances not always
allowed photographs to be taken under the exact same conditions. Consequently, the raw photographs taken by our team were pre-processed according to:
1) Size: With a size of 4MB, raw images were too large to be used as the input of FCNs. To solve this, images were resized to 10KB.
2) Orientation: Images had inconsistent orientations. To solve this, we rotated all images until they were landscape images with the captured body part in an upright position.
3) Perspective: We originally intended to capture the right foot and right ear from all babies. However, due to some babies undergoing treatment, this was not always possible and photographs of their left foot or ear were taken. To solve this, images with left ears or feet were horizontally flipped.
After this pre-processing step, all images had the same characteristics and they were ready to be segmented.
Using the masks obtained from the segmentation step, bounding boxes were created around the largest region of activated pixels within the masks. Bounding boxes were centred around these blobs and resized to 128x128 pixels.
four rotations added and moderately, term, and late preterm babies had two rotations added. This way, the final number of images that were used for training were more balanced.
A. Metrics
Segmentation is measured using the Jaccard Index, while Age Estimation uses RMSE.
1) Jaccard Index: The Jaccard Index is widely used in segmentation problems, particularly in Biology [23]. It measures the intersection over the union of two sets of points [24]. It is calculated with:
J(P, GT) = ||PP∩∪GTGT||
WhereP is the prediction (pixel set returned by FCNs as belonging to body parts), andGT is the ground-truth.
2) RMSE: The Root Mean Square Error was used because it allows us to measure the error of our predictions in the same units as the groundtruth, weeks.
RM SE=qn1Pn
i=1(yi−yˆi)2
Whereyiis the gestational age of theithbaby andyˆiis the prediction for the gestational age of the ith baby according to our linear regressor.
B. Setup
Experiments were carried out on a machine using an NVIDIA’s Titan X GPU. For the Segmentation step, we ran each stage of the FCNs for 30,000 iterations (93 minutes) with a learning rate of 10−4 and a step of 0.9. For the Gestational Age Estimation step, we trained each CNN for 20,000 iterations (5 hours and 11 minutes).
C. Results
Results from all of our experiments are shown in Table II, Fig. 6, and Table III.
TABLE II: Results for Segmentation of Face, Foot and Ear.
No Post Proc Post Proc. Mean Median Mean Median Face 0.73 0.78 0.73 0.78 Foot 0.79 0.85 0.79 0.86 Ear 0.67 0.77 0.69 0.78
Results from the Segmentation step show that FCNs are highly accurate, achieving a Jaccard Index of over 0.7. This implies that the predictions have over 70% of common foreground pixels with the input masks. Additionally, the similarity between the median and mean of the Jaccard Index indicates that the results are consistent across all images in the different image datasets.
[image:6.595.322.538.61.237.2]FCN results were particularly interesting when dealing with regions that were not convex, like the foot. In some cases, the predictions were more accurate than the simple masks that we used, as shown in Fig. 7. More importantly, these results were sufficiently accurate to localise the body parts of interest, and to obtain their largest dimension (height or width), which is the most important information to gen-erate bounding boxes for CNN training.
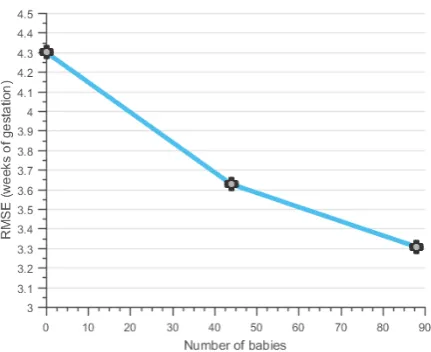
[image:6.595.325.544.320.501.2]Fig. 6: Results from training with 0% (Ballard), 50% and %100 of the training data on the same test set.
TABLE III: Gest. Age Estimation. Baselines are shown in bold and italics. Our best result (in bold) improves both. Ft is Foot, F is Face, E is Ear and W is Weight.
Method RMSE Min E Max E Std E Weight 1.50 0.027 4.72 1.00 Ballard 3.57 0.036 7.36 2.27 Ballard Separated 3.72 0.004 8.79 2.27
Posture 4.14 0.065 8.17 2.09
Face 3.91 0.384 9.98 2.23
Foot 2.66 0.031 11.73 2.22
Ear 3.35 0.147 8.23 1.97
Weight + Face 1.63 0.013 6.84 1.32
Weight + Foot 1.40 0.005 5.86 1.25
Weight + Ear 1.46 0.023 5.91 1.33
Face +Foot 2.81 0.058 9.68 2.67
Face + Ear 3.24 0.045 12.79 2.83
Foot + E 3.67 0.214 12.18 2.78
F + Ft + E 3.17 0.126 12.49 2.88
F +Ft + W 1.32 0.042 4.67 1.01
F + E + W 1.15 0.016 4.34 0.89 Ft + E + W 1.23 0.001 5.52 1.06
F + Ft + E + W 1.29 0.023 4.97 0.99
Looking at the results obtained in the Gestational Age Estimation stage, two main points can be inferred. First, as shown in Fig. 6, the increase in training data directly affects the performance of the system. To test the importance of the size of the training set, we carried out three different experiments. First, we trained with the Ballard score to obtain a baseline result. Secondly, we trained our system using 5-fold subject-independent crossvalidation but only with 50% of our training data, chosen randomly across folds. Thirdly, we trained our system with 5-fold subject-independent crossvalidation again, using 100% of the data available. We maintained the same testing set across folds, which made the comparison between methods fairer.
Fig. 7: FCN learns location of foot better than original manually-annotated mask, outperforming groundtruth.
respectively. This implies that a larger dataset will generate more accurate and robust results in the future.
Secondly, as shown in Table III, our method of combining the probability output from CNNs and weight is the most accurate technique. It consistently outperforms the current manual state-of-the-art, the Ballard Score, the use of other alternative anthropometric measures, such as the weight alone, and it also greatly outperforms the use of CNNs alone. Furthermore, using 100% of the training data, combining regions and including weight during linear regression consis-tently results in a decreased RMSE error and a lower standard deviation in the prediction error. By combining Weight, Ear and Faces, we obtain results that on average have a RMSE of 1.15 weeks. That is 8 days difference between a newborn’s gestational age estimated by an early USS and the age we predict with our system. Fig. 9 shows the ground-truth from the Ultrasound machines versus the predictions made by our system when using in this case. By comparison, using the Ballard score will results in 25 days of difference and using only the weight will result in 10.5 days of difference.
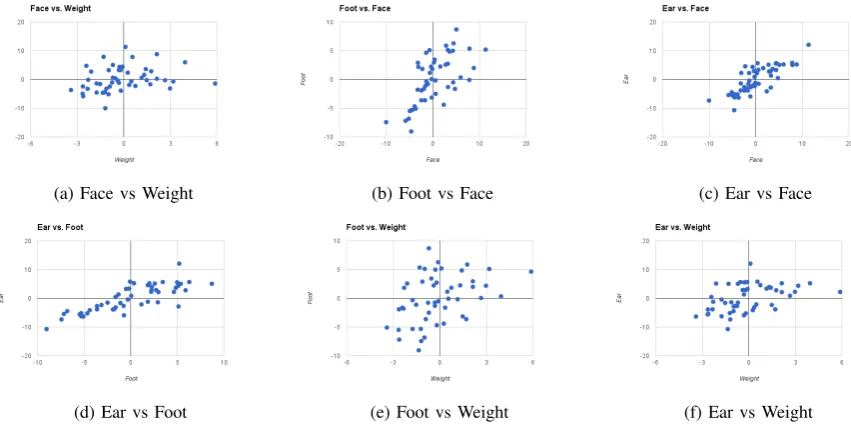
Looking at the correlation between the errors of using Face, Ear, Foot and Weight separately, as shown in Fig. 8, we can see how in particular the errors made based on information of the images are largely independent of the errors made based on the weight. On the other hand, it is interesting to see a strong correlation between the ear and the face as well as the ear and the foot.
Combined with the expectation that collection of more data will further improve image-based predictions (see Fig. 6), these results indicate that our system is a viable alternative to the current manual methods used in remote or underde-veloped areas where USS is not commonly available.
VI. CONCLUSIONS AND FUTURE WORK
The gestational age of a baby is vital when determining the best treatment for a newborn, especially when born prematurely. In this paper we have presented a system that estimates the gestational age of babies postnatally using photographs of their face, foot and ear. Our system has two steps: first, images are segmented using Fully Convolutional Neural Networks to find where the relevant body parts appear in the image. Second, a 13-layer Convolutional Neural Network aimed to classify the photographs according to five classes (extremely preterm, very preterm, moderately
preterm, term, and late) is trained using bounding boxes around these body parts. The probability vectors that result from these CNNs are then combined with the weight of the newborn and used as the input of a linear regressor. This allows us to output an estimation of the gestational age in weeks, instead of classes.
Results show that when our method uses a combination of images and weight, we are able to outperform the current manual state of the art, the Ballard Score, and other methods that use anthropometric measures, such as weight or posture. This suggests that our system is a potential alternative to these manual methods, often used in remote and underfunded locations where USS are not available and healthcare workers may not be trained in clinical assessment of the premature newborn.
Future work will focus on increasing the size of our database and balancing it. We aim to create a database with equal amounts of images for the three regions (face, foot and ear) and all five classes of babies (extremely premature, very premature, moderately premature, term and late). For this, we are in the process of recruiting more babies, focusing on the more challenging categories (i.e. extremely and very preterm babies). We are estimating that we will reach 100 babies by the time the camera-ready version of this paper is submitted and plans are underway to recruit thousands of babies in India to test the method in a setting most likely to benefit from this approach. This will allow us to train even more robust regression and to test on a more varied dataset. This approach could result in improved outcomes for the millions of vulnerable babies in low-middle income countries where clinical management is compromised due to incorrect or unknown gestational age at birth. Furthermore, by uploading this information to a cloud database we could obtain a more detailed picture of the populations where preterm birth is more prevalent.
ACKNOWLEDGMENTS
This research was funded by a Grand Challenges Explo-ration grant from the Bill and Melinda Gates Foundation (OPP1119369).
REFERENCES
[1] World Health Organization,Born too soon, 2012.
[2] Oza, S., Lawn, J.E., Hogan, D.R., et al.. Neonatal cause-of-death estimates for the early and late neonatal periods for 194 countries: 20002013. InBulletin of the WHO, 93(1),19-28; 2015.
[3] Black, R.E., Morris, S.S. and Bryce, J.. Where and why are 10 million children dying every year?. InThe lancet, 361(9376),2226-2234; 2003. [4] Dubowitz, L.M., Dubowitz, V. and Goldberg, C.. Clinical assessment of gestational age in the newborn infant. InThe Journal of Pediatrics, 77(1),1-10; 1970.
[5] Jones, G., Steketee, R.W., Black, R.E., et al.. How many child deaths can we prevent this year?. InThe Lancet, 362(9377),65-71; 2003. [6] Campbell, S., Warsof, S.L., Little, D., Cooper, D.J.. Routine ultrasound
screening for the prediction of gestational age. In Obstetrics & Gynecology, 65(5),613-620; 1985.
(a) Face vs Weight (b) Foot vs Face (c) Ear vs Face
[image:8.595.86.512.61.273.2](d) Ear vs Foot (e) Foot vs Weight (f) Ear vs Weight
Fig. 8: Correlation between the errors of the four main attributes: Face, Feet, Ear and Weight.
Fig. 9: Ground-truth vs Predictions from our most accurate combination of features (face, ear and weight).
[8] Lee, A.C., Mullany, L.C., Ladhani, K., et al.. Validity of newborn clinical assessment to determine gestational age in Bangladesh. In
Pediatrics, 138(1); 2015.
[9] Lynch, C.D. and Zhang, J.. Research implications of the selection of a gestational age estimation method. In Paediatric and perinatal epidemiology,21(2),86-96;2007.
[10] Kramer, M.S., McLean, F.H., Boyd, M.E., et al.. The Validity of Gestational Age Estimation by Menstrual Dating in Term, Preterm, and Postterm Gestations. InJAMA, 260(22),3306-3308; 1988. [11] Ballard, J.L., Khoury, J.C., Wedig, K.L., et al.. New Ballard Score,
expanded to include extremely premature infants. The Journal of Pediatrics, 119(3),417-423;1991.
[12] Scheuer, J.L., Musgrave, J.H. and Evans, S.P.. The estimation of late fetal and perinatal age from limb bone length by linear and logarithmic regression. InAnnals of Human Biology, 7(3),257-265;1980. [13] Ricanek, K. and Tesafaye, T.. Morph: A longitudinal image database
of normal adult age-progression. In7th Int. Conf. on Automatic Face and Gesture Recognition,341-345; 2006.
[14] Escalera, S., Torres Torres, M., Martinez, B., et al.. Chalearn LaP: Face analysis Challenge. InProceedings of CVPR Workshops; 2016. [15] Wang, X., Guo, R. and Kambhamettu, C.. Deeply-learned feature for
age estimation. In 2015 IEEE Winter Conf. on Applications of CV,
534-541; 2015.
[16] Rothe, R., Timofte, R. and Van Gool, L.. DEX: Deep EXpectation of apparent age from a single image. InProc. of CVPR,10-15; 2015. [17] Eidinger, E., Enbar, R. and Hassner, T.. Age and gender estimation of
unfiltered faces.Transactions on Information Forensics and Security, 9(12),2170-2179; 2014.
[18] Ronneberger, O., Fischer, P. and Brox, T.. U-net: Conv. networks for biomedical image segmentation. InIntl. Conf. on Medical Image Computing and Computer-Assisted Intervention,234-241; 2015. [19] Smistad, E., Falch, T.L., Bozorgi, M., et al.. Medical image
segmen-tation on GPUsA comprehensive review. InMedical Image Analysis, 20(1),1-18; 2015.
[20] Long, J., Shelhamer, E. and Darrell, T.. Fully convolutional networks for semantic segmentation. InIEE CVPR,3431-3440; 2015
[21] Krizhevsky, A., Sutskever, I. and Hinton, G.E., 2012. Imagenet clas-sification with deep convolutional neural networks. In Advances in Neural Inf. Proc. Sys.,1097-1105; 2012.
[22] Svenska C.A.. A newborn baby from the Danderyd Hospital in Stockholm. [ONLINE]. Available at: http://www.flickr.com/photos/hygienematters/5424769617/in/set-72157625996948230/ [Accessed 30 September 2016]; 2011 [23] Zou, K. H., Warfield, S. K., Bharatha, A., et al.. Statistical validation
of image segmentation quality based on a spatial overlap index 1,
Academic radiology, 11(2), 178-189; 2004
[image:8.595.54.305.313.480.2]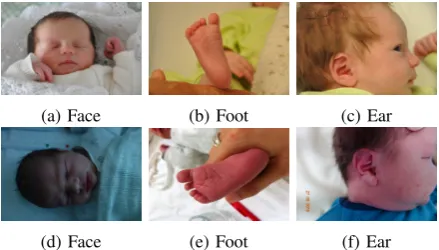
![Fig. 5: Overview of the whole process when feet and ear photographs are combined. The first step, FCNs, were developedby [20]](https://thumb-us.123doks.com/thumbv2/123dok_us/8588653.370698/5.595.136.474.53.257/fig-overview-process-photographs-combined-rst-fcns-developedby.webp)