Identifying species from the air: UAVs and the
very high resolution challenge for plant
conservation
Susana Baena1,2*, Justin Moat1,2, Oliver Whaley1, Doreen S. Boyd2
1 Royal Botanic Gardens, Kew, Richmond, Surrey, United Kingdom, 2 School of Geography, University of
Nottingham, Nottingham, United Kingdom *s.baena@kew.org
Abstract
The Pacific Equatorial dry forest of Northern Peru is recognised for its unique endemic biodi-versity. Although highly threatened the forest provides livelihoods and ecosystem services to local communities. As agro-industrial expansion and climatic variation transform the region, close ecosystem monitoring is essential for viable adaptation strategies. UAVs offer an affordable alternative to satellites in obtaining both colour and near infrared imagery to meet the specific requirements of spatial and temporal resolution of a monitoring system. Combining this with their capacity to produce three dimensional models of the environment provides an invaluable tool for species level monitoring. Here we demonstrate that object-based image analysis of very high resolution UAV images can identify and quantify keystone tree species and their health across wide heterogeneous landscapes. The analysis exposes the state of the vegetation and serves as a baseline for monitoring and adaptive implemen-tation of community based conservation and restoration in the area.
1. Introduction
The Pacific Equatorial dry forest of Northern Peru (and South Western Ecuador) is recognised as a unique dry forest ecosystem, rich in endemic flora and biodiversity [1]. The region is a vital and unique ecosystem within the Latin American biome of seasonally dry tropical forest and that is one of the most threatened, and yet understudied and very poorly surveyed, tropical forests worldwide with less than 10% of the original extent remaining regionally [2]. The Equa-torial dry forest of Peru also provides a wide range of livelihoods and ecosystem services to local communities [3]. However, agro-industrial expansion, over-exploitation of natural resources (for firewood and agriculture land) and climatic extremes (e.g., ENSO events) has left forest relicts and a mosaic of associated arid land vegetation which are now highly threat-ened and vulnerable [4]. Furthermore, over the last ten years the forest has been experiencing die-back of its keystone species: the Algarrobo (Prosopis pallida) upon which communities and livelihoods have historically depended [5]. This is likely due to the combined impact of drought, associated climate change and defoliating plagues, especiallyEnallodiplosis discordis
(Diptera:Cecidomyiidae). The Algarrobo has been the lynch-pin of rural livelihoods as a
a1111111111 a1111111111 a1111111111 a1111111111 a1111111111 OPEN ACCESS
Citation: Baena S, Moat J, Whaley O, Boyd DS (2017) Identifying species from the air: UAVs and the very high resolution challenge for plant conservation. PLoS ONE 12(11): e0188714. https://doi.org/10.1371/journal.pone.0188714
Editor: Duccio Rocchini, Universita degli Studi di Trento, ITALY
Received: March 22, 2017
Accepted: November 11, 2017
Published: November 27, 2017
Copyright:©2017 Baena et al. This is an open access article distributed under the terms of the Creative Commons Attribution License, which permits unrestricted use, distribution, and reproduction in any medium, provided the original author and source are credited.
Data Availability Statement: The study data is available from figshare at:https://figshare.com/ articles/FullExtent_flight_63_mosaic_nir_tfw/ 5236096;https://figshare.com/articles/FullExtent_ flight_63_mosaic_nir_tif/5236093;https://figshare. com/articles/FullEtent_flight63high_dsm_tfw/ 5236009;https://figshare.com/articles/FullEtent_ flight63high_dsm_tif/5235997.
multipurpose tree [6] providing an annual rich harvest of nutritious pods that are used for food and especially for animal forage, as well as a foodstuff for human consumption. Of partic-ular note is that the Algarrobo pods are an essential forage component that allows the ranching of animals on the very poor soils with limited water that prevails in this area. Conversely, other species such as Sapote (Colicodendron scabridum) and Overo (Cordia lutea) appear to be thriv-ing, possibly due to atmospheric CO2enrichment and increasing temperatures [7], especially
during summer rains with the free nitrogen released fromAlgarrobodie-back [7]. A highly complex and dynamic ecosystem now exists that requires close monitoring to quantify change and respond effectively with adaptation strategies in order to manage the decline in Algarrobo-dependent biodiversity and sustain community livelihoods. In this con-text a monitoring system needs to be capable of the following: (i) identifying individual tree species across the landscape; (ii) mapping species association and plant community whilst assessing plant health and (iii) quantifying population dynamics in response to ongoing land management and climate change. Such monitoring is essential from a scientific perspective (e.g.to target and design restoration and reforestation efforts to preserve and restore the native forest relict), but must also be able to communicate to stakeholders the best actions (such as changes in seed banking, reforesting options, irrigation and livestock management) to main-tain resilience of ecosystem services. Specifically, the monitoring system must provide spatial data on the principal keystone species,Algarrobo(including on their current mortality rates), as well as onSapoteother dominant species and do so in a timely fashion.
This detailed ecosystem assessment has traditionally been carried out through field survey, but collection of field data is costly in time, labour and resources [8] and so remote sensing has been much advocated as an approach, as it can characterise an ecosystem in an efficient, sys-tematic, repeatable and spatially exhaustive manner [9]. Remote sensing based ecosystem assessments can be conducted at a range of spatial scales, from global [10–13] to more localised studies [14–19]. However, discriminating between species and quantifying individual plants using remote sensing requires specific acquisition parameters (e.g., data at a sufficient resolu-tion) and processing approaches. Very high spectral resolution (hyperspectral) data have been successful in the identification of canopy tree species [20–23]. Alternatively, very high spatial resolution data is perhaps more accessible and has the potential to be a viable tool for species determination [24–26]. Further, since species identification can be greatly improved by employing the three dimensional information of the vegetation, technologies affording three dimensional measurements (e.g., light detection and ranging (LiDAR) technology) have been widely used [27–30]. However, in all these cases, the costs and availability of the technology would be financially and structurally prohibitive for most conservation efforts [31], yet the potential of remote sensing to support conservation effort has been recognised [32] (Rose et al., 2014). In this paper, we investigate the effectiveness of remote sensing from unmanned aerial vehicles (UAVs) which have the potential to provide accurate and fast analysis and mon-itoring of ecological features at a cost [33] that can be accessible to most conservation applica-tions and researchers in developing countries [34].
The use of UAVs as a remote sensing approach is now gaining traction. These type of sys-tems are especially well suited to and most commonly used for precision agriculture where the technology is developing fast [35,36] but they have also been employed in different ecological [33], environmental [37] and conservation [34] applications where UAV systems have been identified to have the potential to revolutionize these fields [33]. Low altitude flights can easily provide the sub-meter spatial resolution that allows individual plants to be identified [38]. Also, different sensing payloads can deliver multispectral images, ranging from the visible (RBG) band, to the near infrared (NIR) through to the thermal infrared and microwave [39] although often, because of the low-cost requirements and limited weight capabilities of these Affairs (DEFRA), the Bentham-Moxon trust and the
Geography Department at University of Nottingham.
systems, modified consumer digital cameras are used [40], with enhancement to their spectral resolution by using or removing filters to provide RBG and NIR bands [41]. Three dimen-sional information can be derived from overlapping images taken with uncalibrated con-sumer-grade cameras using newly developed algorithms [42], in particular structure from motion [43,44], providing extra valuable information on vegetation structure and condition. Moreover, the system can be deployed on demand, providing temporal flexibility to respond to specific needs such as seasonal or climatic circumstances (e.g., an El Niño event) or to moni-tor interventions (e.g. tree planting or cattle exclusion) [45].
Despite the promise offered by using UAVs, obtaining meaningful ecological information from the captured data remains challenging and so far has predominantly relied on visual interpretation of the imagery acquired, particularly when it comes to quantifying number of individuals [33]. This can be very time consuming and become unfeasible in larger areas with large number of individuals. Further, traditional pixel-based image analysis techniques have limitations when processing such high resolution datasets [46,47] where image targets (such as individual trees) are larger than the pixel size. Combining pixels into groups to form objects could be a way forward to analysing this type of data. Additional spectral information con-tained in an object (e.g. mean spectral values, variance, mean ratios. . .) can be taken into account along with added spatial and contextual information for the objects (distance, shapes, size, texture, etc.). The inclusion of this extra information is critical when uncalibrated con-sumer-grade digital cameras are used as these imaging sensors acquire images that have high spatial resolution but lack radiometric quality [48]. Thus object-based image analysis (OBIA) techniques have demonstrated great potential to automatically extract information from very high resolution images [49,50], including those captured by UAVs [51,52].
In this paper we present an efficient and affordable approach to identify and quantify indi-vidual trees across the dry forest, as well as mortality rates of its keystone species. We seek to add weight to the growing evidence on the real potential of UAV’s for plant conservation, with the view that this could form the foundation of a monitoring system across this particular landscape.
2. Materials and methods
2.1. Study area
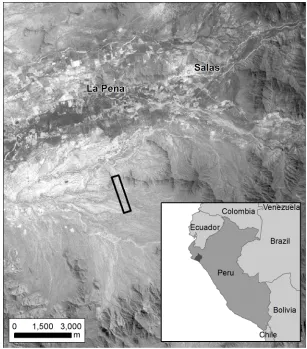
The community forest (comunidad campesina) of San Francisco de Asis (CCSFA) in the Lam-bayeque region in Northern Peru was the focus of investigation (Fig 1). Full permission to carry out UAV flights and botanical collections in the area as part of this study was granted by the president of San Francisco de Asis Community forest. The CCFA is delimited by a low mountain range and it is one of a series of arid slopes and a dry lower watershed basin on the western side of the Andes. Rainfall is very low and rarely exceeds 400 mm (except during some El Niño events), generally falling between December to April. UAV data were captured for an 80 ha area (centred on 79˚ 38’W, 6˚ 20’ S, datum WGS84) within the proposed CCSFA com-munity reserve.
(Palo santo), and relict large columnar cactusArmatocereusaff.cartwrightianusand Neorai-mondia arequipensis).
In this study and for the purpose of identification from UAV images the focus will be on the dominant species. Each of these plant species have a morphology that could help in any identification using remotely sensed data, such as that captured by an UAV. As such, there are several important plant features that can be used for identification of each of the species of interest (Fig 3):
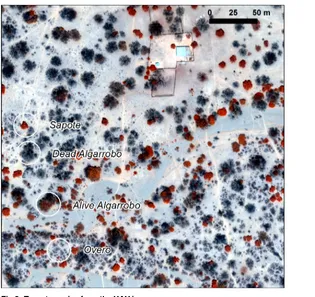
Algarrobo(Prosopis pallida).: This is a non-deciduous tree of up to 15 meters high with a very distinctive star shaped crown when viewed from above. This distinctive shape is modified as a result of the dieback affecting this keystone species.
Overo(Cordia lutea) that could get misclassified asProsopis pallidawhen observed from above but can easily be distinguished as it is deciduous and only up to 2 meter high. It grows along runnels forming a distinctive reticulated pattern
[image:4.612.197.504.76.425.2]Sapote(Capparis scrabrida): This evergreen tree is very distinctive with compact and round or sub oval shaped crown with large sclerophyllous leaves. It tends to grow partitioned and iso-lated, this feature is exaggerated in this site through the use of the dense shade for cattle shel-tering the extreme midday heats.
Fig 1. Study site and country map: Country map shows the Peruvian region of Lambeyeque. Main map
Fig 2. Target species: (a) Alive Algarrobo (b) Dead Algarrobo (c) Sapote (d) Overo.
https://doi.org/10.1371/journal.pone.0188714.g002
Fig 3. Target species from the UAV image.
[image:5.612.199.514.395.692.2]2.2. Datasets: Remote sensing with UAV and supporting ground data
The UAV deployed was the fixed-wing eBee system (https://www.sensefly.com/). This autono-mous system is operated by a propeller activated by an internal electric motor. It requires hand launch for take-off and landing is either linear or circular in a relatively clear area (i.e. bare ground or grass). Its efficient aerodynamics allows for long flight durations and high speeds. It can cover up to 12 Km2in a single flight and by altering the flying altitude can be used to acquire very high resolution images (i.e. up to 1.5 cm). The imaging sensor used on board was a Canon S110 RE, a customised very light automatic consumer-grade digital camera providing blue, green and red-edge band data. The red-edge band data is obtained by adding an optical red-light-blocking filter in front of the sensor, resulting in red-edge, green and blue images [41]. It has a resolution of 12 MP with a ground resolution at 100m of 3.5 cm/px. The sensor size is 7.44 x 5.58 mm with a pixel pitch of 1.86 um. The UAV was deployed during the dry sea-son (November) to ensure maximum discrimination between deciduous and evergreen vege-tation. The flight mission was planned using eMotions software over images imported from Google Earth (Google Earth, 2011) and SRTM DEM [53]. Flight altitude was set up to 260m to provide a ground resolution of approximately 8 cm over the study area and images acquired at 75% forward overlap and 80% side overlap. The ground resolution of 8 cm was chosen to pro-vide ultra-high resolution (both in the resultant point cloud and mosaics), but also to cover a large enough area to include established control plots and demonstrate the benefits of UAV monitoring. The high level of overlap allows 3D reconstruction of point clouds to a higher accuracy, allowing objects in each image to be observed in at least 5 other images and thus affording structure from motion analysis.
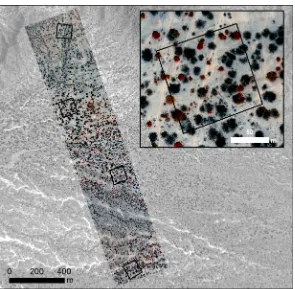
Temporally coincident to the UAV flights, four experimental plots were measured. These 1 Ha (100m x 100m) plots were evenly distributed spatially across the study site (Fig 4) recording the presence and species of every mature tree with (>25 cm girth at 50 cm high) along with the average crown spread. For everyAlgarrobotree the “degree of health” was also recorded on a 1 to 3 scale (1: healthy tree, 2: infected tree, 3: dead tree). For the shrub layer, presence of
Overowas recorded where it covered an area of more than 4 square meters (2 x 2 m). In addi-tion, a discontinuous transect throughout the length of the flight (2 Km length by 0.4 Km wide) was surveyed, recording the species of every tree found.
2.3. Pre-processing of remotely sensed data
The raw UAV- derived remotely sensed data were processed using eMotion’s Flight Data Man-ager and Postflight terra (Pix4D) software to produce a geo-referenced orthorectified 3 wave-band image mosaic at 8.3 cm spatial resolution (UTM 17S WGS84) and two 3D-derived elevation layers: a digital elevation model (DEM), a representation of the elevation of the ground surface or bare-earth, and digital surface model (DSM) which includes the elevation of both natural and built features. Both layers are delivered as grids with a resolution matching that of the orthorectified mosaic. Both were then used to derive a canopy height model (CHM) of the study area.
2.4. Species mapping from UAV data
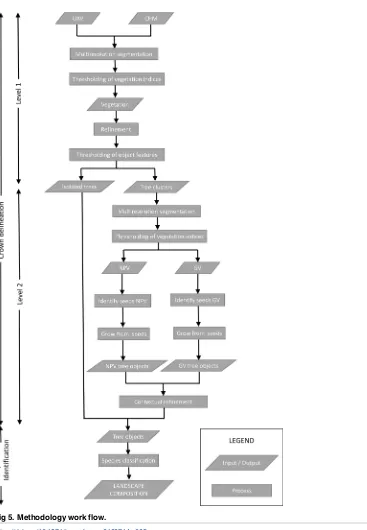
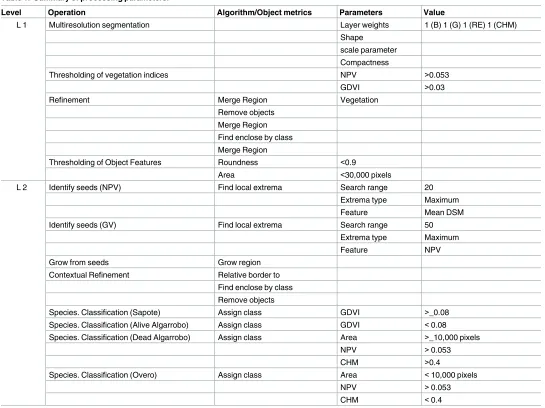
segmentation process, crown delineation here is achieved by the iteration of segmentation and classification of subsequent segments working at two different levels. A first level aims to iso-late individual trees from tree clusters across the landscape using contextual information. At a more detailed second level, individual crowns are identified within these tree clusters using two different approaches according to vegetation types. This allowed for a more efficient meth-odology focusing processing efforts only where it is most needed, as well as using the best suited methodology for each specific vegetation type.Fig 5andTable 1include the methodol-ogy workflow and main processing parameters.
Crown delineation. Level 1 (vegetation or contextual level): Firstly a multiresolution seg-mentation algorithm (using eCognition software) was used to create the basic image objects at a scale that allows for objects to be relatively homogeneous whilst capturing the full scene vari-ability. These “object candidates” [55] will be transformed by further processing into meaning-ful objects (individual tree crowns). Vegetation is then discriminated from the background by thresholding available band ratios (from Blue, Green and Red Edge bands). Green vegetation is best discriminated using a band ratio, deviation from the normalised vegetation index (1) whiles the non-photosynthetic vegetation (deciduous and dead vegetation) using a combina-tion of the blue and green bands (2).
1. GV (Green Vegetation) = (RE–Green) / (RE + Green)
2. NPV (Non-Photosynthetic vegetation) = (Blue–Green) / (Blue + Green)
[image:7.612.201.496.73.362.2]Objects classified as vegetation were then combined and reclassified as either isolated trees (individual tree crowns) or tree clusters according to contextual object features (extent and
Fig 4. UAV flight (red edge) over the study area and plot distribution (from top to bottom: Plots 1, 3, 4, 2). Background image: panchromatic World View image.
shape). Vegetation objects smaller than the minimum mapping unit (4m2) are not considered for further analysis. Tree clusters were then need to be further analysed (level 2, see below) to extract individual trees within them.
[image:8.612.206.573.66.596.2]Level 2 (de-clustering): Most tree crown delineation studies are built around the identifica-tion of treetops, assuming that they are at a maxima (most often using CHMs) and that they correspond to the geometric centre of the tree crown [56]. This is normally the case in conifer-ous trees and can be extended to evergreen vegetation but deciduconifer-ous tree crowns (and this is
Fig 5. Methodology work flow.
also the case for defoliated evergreen vegetation) are relatively flat and with multiple branches that can be identified as individual trees [54]. This, added to the challenges presented by drone derived elevation data in deciduous trees prevents the use of CHM local maxima to identify hardwood tree tops. In this case, tree centres are identified using NPV local maxima. Green vegetation was very clearly identified in the elevation model therefore a more traditional CHM local maxima was used to identify tree tops.
Once tree tops have been identified, a region growing algorithm was used to delineate the respective tree crowns [57]. A further step using contextual information was then needed to refine certain tree crowns, such as infested Algarrobo which were in certain cases identified as two different trees (dead branches adjacent to branches with different levels of defoliation). The feature “relative border to” (measuring the relative border length that an object shares with neighbour objects) was particularly useful for this purpose.
[image:9.612.35.580.83.491.2]Species identification. Once the crowns have been delineated, individual trees have addi-tional spectral information as opposed to single pixels (eg. mean values, maximum and mini-mum, variance. . .) along with contextual information and specific object features that were to
Table 1. Summary of processing parameters.
Level Operation Algorithm/Object metrics Parameters Value
L 1 Multiresolution segmentation Layer weights 1 (B) 1 (G) 1 (RE) 1 (CHM)
Shape
scale parameter Compactness
Thresholding of vegetation indices NPV >0.053
GDVI >0.03
Refinement Merge Region Vegetation
Remove objects Merge Region Find enclose by class Merge Region
Thresholding of Object Features Roundness <0.9
Area <30,000 pixels
L 2 Identify seeds (NPV) Find local extrema Search range 20
Extrema type Maximum
Feature Mean DSM
Identify seeds (GV) Find local extrema Search range 50
Extrema type Maximum
Feature NPV
Grow from seeds Grow region
Contextual Refinement Relative border to Find enclose by class Remove objects
Species. Classification (Sapote) Assign class GDVI >_0.08
Species. Classification (Alive Algarrobo) Assign class GDVI <0.08 Species. Classification (Dead Algarrobo) Assign class Area >_10,000 pixels
NPV >0.053
CHM >0.4
Species. Classification (Overo) Assign class Area <10,000 pixels
NPV >0.053
CHM <0.4
be used for species discrimination. In our case the most useful features for species discrimina-tion was; mean values of band ratios, mean, maximum and standard deviadiscrimina-tion of CHM, shape and size, as well as contextual information such as “relative border to”. Training information for classification used data collected in a transect along the flight (based on visual interpreta-tion), whilst further plot data was used for validation. The final classification scheme aimed to discriminate amongst four classes: Sapote, Overo, Alive Algarrobo and Dead Algarrobo.
In terms of accuracy assessment of the final species map there were two main objectives. The first was to determine the accuracy in the estimates of number of trees mapped (tree detec-tion) and the second was to determine the level of confidence for the identification of individ-ual species (species classification). The assessment was implemented at a plot level, as a non-site specific measurement, avoiding the need to match individual tree location [58]. Data recorded in the four plots taken at the time of the flight were used as reference. Only trees with an average crown spread greater than 4m2were considered (matching the minimum mapping unit). Algarrobo with “degrees of health” 1 and 2 were considered Alive Algarrobo whereas “degrees of health” of 3 were considered Dead Algarrobo With regard to quantification, only trees were taken into consideration, Overo, as a bush, was identified but not quantified. Error matrix derived measurements along with detection rates were employed to assess the accuracy of the classification and the tree location respectively. Further assessments such as determining the quality of tree crown delineation (i.e. the boundary of the tree crowns) could be imple-mented but while the actual delimitation of the crown boundaries has a direct influence in the accuracy of both tree detection and species classification it is not a focus of this study.
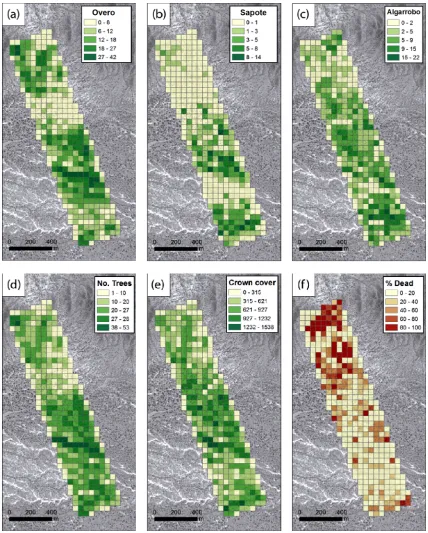
To examine the species composition in the study area we summarised the numbers of trees per species, numbers of trees, crown cover and mortality rates of Algarrobo, across the study area, using 50 x 50m cell sizes (area of 2500 m2). This was processed in ArcGIS 10.4 (ESRI 2016), deriving the cells using fishnet and summary statistics using spatial overlay (centroids of the crowns queried against the cells) and zonal statistics.
3. Results
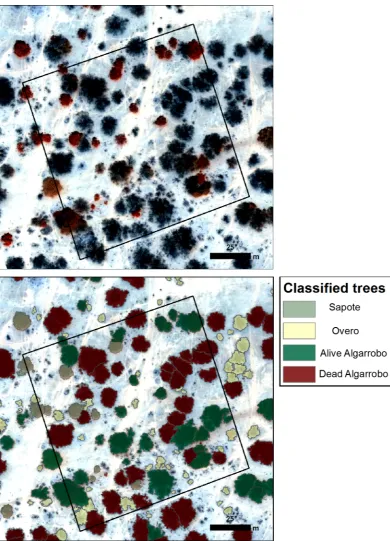
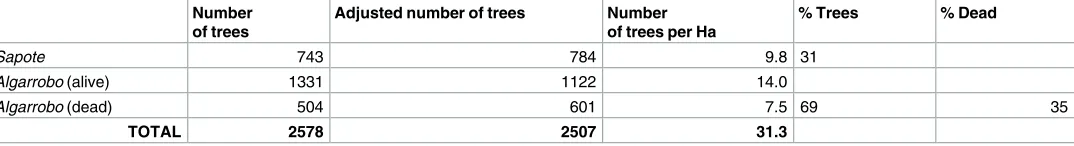
The distribution of species composition across the landscape (Fig 6) reveals the predominance ofAlgarroboat 69% of delineated tree canopies (i.e., at 21.5 trees per Ha) as opposed to Sapote at 31% of the delineated trees (Overo was mapped but not quantified) (Table 2). At the time of the UAV deployment it is evident that 35% of the mappedAlgarrobotrees were already dead (Table 2). When reviewing the spatial distribution of species (Fig 7), it is evident thatOvero, is densest along runnels, whilst Sapote, dominates in the south of our study area.Algarrobo
shows little trend, but what is evident is the clustering of the dead trees in the north of the area. There could be multiple reasons for this, such as the disease advancing from north to south but also the area to the north is the most disturbed (in terms of cattle and human disturbance) which may help propagate the plague.
classified as Sapote. This is very much related to crown delineation errors; if the crown is delimited in such way that includes non-vegetation pixels (such as background) the average GDVI values of the tree object would be lower and therefore the tree assigned to a different
Fig 6. Distribution of species composition in and around Plot 1: A. red edge derive image from UAV mosaic. B
class. The deadAlgarroboclass presents a similar accuracy statistic behaviour (i.e., a high user’s accuracy and lower producer’s accuracy) and this is caused mainly by DeadAlgarrobotrees being classified asOvero. This can be explained by inaccuracies in the elevation data; if not enough elevation points are found in the point cloud for the object tree, it will not be recog-nised as a tree but as a bush and therefore assigned toCordea luteaclass (Fig 8). In addition, some of the deadAlgarrobowere identified as aliveAlgarrobogenerally caused byVallesia sp. plants growing under theAlgarrobocanopy increasing GDVI values and resulting in the tree being classified as alive. This situation causes different accuracy statistics in the two remaining classes, AliveAlgarroboandOvero, where high producer’s accuracy than user’s accuracy was obtained. Most of the reference AliveAlgarrobowere identified correctly whereas trees classi-fied asAlgarrobowere indeed Sapote.
4. Discussion and conclusions
The high degree of accuracy with which the target species were mapped across this landscape as well as mortality rates of the keystone speciesAlgarrobo, demonstrates how useful a moni-toring approach using a UAV would be for conservationists working in this area. Although much up front work is need to deploy the UAV, the actual flying time and image acquisition was very fast; covering the area in less than 20 mins.
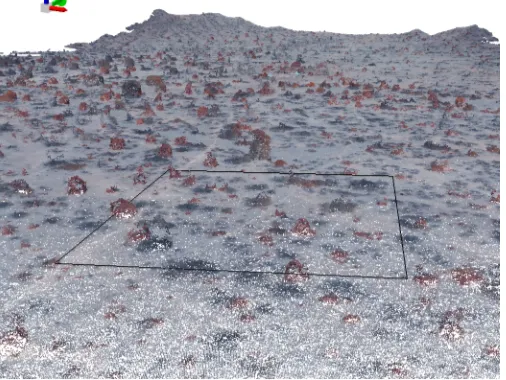
[image:12.612.39.576.89.162.2]Of particular note, is that although there are currently many studies reporting advances in the use of UAVs [37,59,60], this study has demonstrated that the simple and cheap consumer grade sensor carried by the system (Canon S110 RE), with its limited spectral resolution, still afforded accurate mapping of the parameters required here. However, when using modified consumer digital cameras as multispectral sensors we need to be aware of certain limitations of these systems to monitor vegetation. Spectral sensitivity and radiometric distortions of the camera optics have an influence in the radiometric and spectral quality of the images acquired [61]. Even if the camera is calibrated, attempting to remove radiometric distortions, theses cameras are sensitive to fairly broad wavelength ranges which also overlap considerably in det-riment of traditional multispectral analysis. Furthermore the Red Edge is acquired with the loss of the red band which also limits the range of band indices that can be applied. Still, data derived from this modified cameras provide extremely valuable information for monitoring vegetation if the appropriate image analysis techniques are used. In addition to the ultra-high resolution data, the ability of the system to provide three dimensional information (derived using structure from motion) was useful for vegetation characterization but the contribution was highly dependent on the quality of the point clouds produced. Different studies report on accuracies comparable to those derived by LiDAR systems [62,63]. However, as others have found, there were challenges when generating digital canopy height models of deciduous trees [64]. It was evident that point clouds were dense for evergreen trees with compact canopies but less so for deciduous or defoliated tress where fewer tie points were found in standing branches which could be confused with background points (Fig 8). As a result 3D data was useful when delineating and discriminating evergreen species but not so conclusive for
Table 2. Number and density of trees in the study area.
Number of trees
Adjusted number of trees Number
of trees per Ha
% Trees % Dead
Sapote 743 784 9.8 31
Algarrobo (alive) 1331 1122 14.0
Algarrobo (dead) 504 601 7.5 69 35
TOTAL 2578 2507 31.3
deciduous trees. However, the methodology approach used in this study allowed for the com-bined use of 3D and spectral information depending on the nature of the vegetation where spectral information was found more useful in dealing with deciduous trees. Nevertheless the
Fig 7. Landscape metrics for targeted species with 50 x 50 m cells (2500 m2). (a) Number of Overo per cell. (b) Number
of Sapote per cell. (c) Number of c per cell. (d) Number of trees per cell. (e) Crown coverage in m2per cell. (f) Percentage of
dead Algarrobo per cell.
use of 3D information is essential when trying to discriminate DeadAlgarrobotress from
Overobushes.
[image:14.612.37.578.89.153.2]Fundamental to this study was the capture of ultra-high spatial resolution data, the ability to derive 3D data, as a result of structure from motion, and extending the spectral resolution of the camera sensor by way of a filter. Although UAVs are relatively easy to deploy, there is the caveat that understanding how they should be deployed with respect to flight planning to cap-ture the optimal data for pre-processing and then subsequently the methods for processing and analysing the data captured for an application are key to successful mapping and monitor-ing. General pixel based quantitative analysis (relation between pixel values and target radi-ance, time series analysis, quantification of surface parameters, data comparison across time and scale) is less suitable than object based approaches where spatial and contextual informa-tion is also taken into account. The high resoluinforma-tion of the 3 band orthorectified data, such that the features to be mapped are larger than the pixel [65], and derived CHM were well suited to the employment of OBIA for mapping the species of individual trees. Previous studies delin-eating crowns have used a range of different methodologies, predominantly by applying edge detection [66], watershed segmentation [67] or region growing [68] algorithms, but these have been on remote sensing data captured by other platforms. These include multispectral very high resolution (VHR) satellite imagery [54], airborne LiDAR data [66] or a combination of both [69]. Such studies have normally focused on either temperate forests [54,70] or monospe-cific tropical environments [71] with relatively simple tree crown structures. Comparatively lit-tle research has tried to tackle the complexity of tropical forests with intrinsic interspecific low spectral separability and variable physical parameters [69]. Just a handful focus on these drier environments such as savannah woodlands [67], but so far these methodologies have not yet been applied to dry forests with the added complexity of trees presenting different levels of infestation by a fungal disease. Thus, this study is one of the first studies to demonstrate how OBIA can be successful in analysing data captured by UAVs, particularly the derived 3D mod-els and multispectral imagery from uncalibrated consumer grade digital cameras. This study has also illustrated that the subsequent species classification process post-crown delineation has also benefited from the use of OBIA where information on the trees as objects including contextual information, statistical parameters based on spectral information (such as mean values, standard deviations. . .) provides an advantage over the use of traditional pixel based approaches when identifying individual species [72,73].
Table 3. Accuracy assessment: Detection rates.
Classified Reference Difference %
Sapote 72 76 -4 94.73684
Algarrobo (alive) 59 51 8 115.6863
Algarrobo (dead) 73 87 -14 83.90805
Total 204 214 -10 95.3271
[image:14.612.39.576.619.712.2]https://doi.org/10.1371/journal.pone.0188714.t003
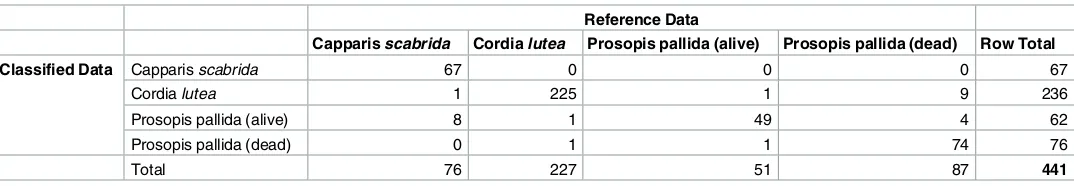
Table 4. Accuracy assessment: Error matrix.
Reference Data
Capparis scabrida Cordia lutea Prosopis pallida (alive) Prosopis pallida (dead) Row Total
Classified Data Capparis scabrida 67 0 0 0 67
Cordia lutea 1 225 1 9 236
Prosopis pallida (alive) 8 1 49 4 62
Prosopis pallida (dead) 0 1 1 74 76
Total 76 227 51 87 441
The results obtained here are extremely encouraging. They demonstrate that object-based image analysis is an effective image processing technique to analyse very high resolution data allowing for the identification of individual tree species and composition across a heteroge-neous landscapes. It is also apparent that from an operational perspective, the relative ease of deploying the SenseFly eBee system across this landscape, in combination with the relative accessibility of using this type of UAV (i.e., costs, training, etc) means that repeat data capture (temporal resolution) should be achievable. Indeed, the need for rapid deployment and repeat data capture is particularly acute across this landscape as Algarrobo has throughout Peru been suffering dieback with the loss of foliage through the combined condition of drought, climate change and defoliating plagues. As a result theAlgarroboof our study area, are in a state of rapid decline and mortality, reaching alarming figures of a 35% mortality rate. There is an urgent need of action to reverse this trend putting in place community based conservation activities and restoration initiatives to ensure the survival of Algarrobo forests. Furthermore, extreme events (such as ENSO) are occurring more frequently [74] and their impact on the forest requires monitoring. However, to truly develop a UAV-based monitoring system that is flexible and allows for automation of workflow where possible spectral data derived from the UAV sensors should be calibrated ensuring long term data quality [75] as well as data compa-rability through time and space [76]. Additionally to fully exploit the multispectral capability of the system using consumer grade digital cameras, post-flight combination of data from
Table 5. Accuracy assessment.
Reference Totals Classified Totals Number Correct Producers Accuracy Users Accuracy
Capparis scabrida 76 67 67 88.16% 100.00%
Cordia lutea 227 236 225 99.12% 95.34%
Prosopis pallida (alive) 51 62 49 96.08% 79.03%
Prosopis pallida (dead) 87 76 74 85.06% 97.37%
Totals 441 441 415
Overall Classification Accuracy 94.10%
https://doi.org/10.1371/journal.pone.0188714.t005
Fig 8. Point cloud showing higher density for evergreen trees as opposed to deciduous or defoliated tress.
[image:15.612.202.455.484.674.2]different sensors should be considered allowing for a wider range of multispectral bands enhancing the analytical capability (such as vegetation indices) of the system and therefore being able to capture subtle differences in infestation levels. This would in turn raise the need of accurate ground control points and minimal time delay between flights [33].
The aforementioned improvements in the system are feasible however the present analysis has exposed the state of the vegetation and served as a baseline for future monitoring allowing to further focus on the health (i.e. levels of infestation) ofAlgarrobo. Moreover, once estab-lished such a UAV-based monitoring system it could be extended to compute extra individual tree information of great value for many ecological studies [77]. Measures of canopy extent (crown width, crown cover, foliage projected cover. . .) and tree heights values can be easily computed once the right crown delineation algorithm is in place [78], furthermore, tree height and crown width are known to correlate with other tree based metrics such as DBH [69,79]. These tree structural attributes are fundamental for assessing above grown biomass, carbon stocks and for the understanding of ecosystem functions which are essential in support of many conservation activities and the provision of ecosystem services [78]. To be able to do this, as well as identify further species would represent an exciting development for the fields of remote sensing, ecology and conservation [80]. With respect to this landscape in particular, it is clear that what is required of a monitoring system, i.e., provision of spatial data on the principal keystone species, including on their health, in a timely fashion on demand, should indeed be possible. The data generated via this study allows for the isolation of areas needing conservation management and planning, for example targeting areas of healthy trees for seed collecting, and conversely those areas needing assistance in restoration and intervention.
As for the generality of the methodology used, the forest of the study area is at the dry end of the spectrum for tropical dry forest where rainfall is very low resulting in a vegetation type with low number of species. Disturbances in the area have also caused an open structural vegetation formation where tree crowns are in many cases isolated and have developed freely to their mature form but also in tree clusters where crowns from individual trees are interconnected. The methodology used in this study, working at different levels (isolated trees and tree clusters) allows for this approach to be used in different structural vegetation types, either in closer for-mations such as forests receiving more rainfall where tree canopies are completely interconnec-ted, or in very open formation such as savannahs (e.g. Brazilian cerrado). In more species rich vegetation types such as cerrado, the approach here would still be valid but would benefit from higher spectral resolution, either from an upgrade of UAV sensors or post-flight combination of data in order to fully exploit the multispectral capability for species identification.
Acknowledgments
Working with UAV’s in Peru was very rewarding, but also can be very complex to organise without help from others. We have been privileged in working with many partners, organisa-tions, teams and experts to achieve this. We are extremely grateful for their help and expertise, specifically, we would like to thank Mary Carmen Arteaga, Ana Marı´a Juarez, Amanda Coo-per, Tim Wilkinson and Steve Bachman. Also we would like to thank the village of La Peña for their help, expertise, enthusiasm and hospitably. Finally we are indebted to the sponsoring and granting organisations that have supported and contributed to our work, specifically to the UK Department of Environment, Farming and Rural Affairs (DEFRA) and the Bentham-Moxon trust.
Author Contributions
Data curation: Susana Baena.
Formal analysis: Susana Baena, Justin Moat, Doreen S. Boyd.
Funding acquisition: Susana Baena, Justin Moat, Oliver Whaley.
Investigation: Susana Baena, Doreen S. Boyd.
Methodology: Susana Baena, Justin Moat, Doreen S. Boyd.
Project administration: Susana Baena.
Resources: Susana Baena.
Software: Susana Baena, Justin Moat.
Supervision: Susana Baena, Doreen S. Boyd.
Validation: Susana Baena, Justin Moat, Oliver Whaley.
Visualization: Susana Baena, Justin Moat.
Writing – original draft: Susana Baena, Justin Moat, Doreen S. Boyd.
Writing – review & editing: Susana Baena, Justin Moat, Oliver Whaley, Doreen S. Boyd.
References
1. Linares-Palomino R, Kvist LP, Aguirre-Mendoza Z, Gonzales-Inca C. Diversity and endemism of woody plant species in the Equatorial Pacific seasonally dry forests. Biodivers Conserv. 2009; 19: 169–185.
https://doi.org/10.1007/s10531-009-9713-4
2. Banda K, Delgado-Salinas A, Dexter KG, Linares-Palomino R, Oliveira-Filho A, Prado D, et al. Plant diversity patterns in neotropical dry forests and their conservation implications. Science (80-). American Association for the Advancement of Science; 2016; 353: 1383–1387.
3. Lerner Martı´nez T, Ceroni Stuva A, Gonza´lez Romo CE. Etnobota´nica de la comunidad campesina”-Santa Catalina de Chongoyape” en el Bosque seco del a´rea de conservacio´n privada Chaparrı´-Lam-bayeque. Ecol Apl. Universidad Nacional Agraria La Molina; 2003; 2: 14–20.
4. Holmgren M, Stapp P, Dickman CR, Gracia C, Graham S, Gutierrez JR, et al. Extreme climatic events shape arid and semiarid ecosystems. Front Ecol Environ. 2006; 4: 87–95. https://doi.org/10.1890/1540-9295(2006)004[0087:ECESAA]2.0.CO;2
5. Palacios RA, Burghardt AD, Frı´as-Herna´ndez JT, Olalde-Portugal V, Grados N, Alban L, et al. Compar-ative study (AFLP and morphology) of three species of Prosopis of the Section Algarobia: P. juliflora, P. pallida, and P. limensis. Evidence for resolution of the “P. pallida-P. juliflora complex.” Plant Syst Evol. 2012; 298: 165–171.https://doi.org/10.1007/s00606-011-0535-y
6. Dı´az Celis A. Los algarrobos. CONCYTEC Lima, Peru´. 1995;
7. Reich PB, Hobbie SE, Lee TD. Plant growth enhancement by elevated CO2 eliminated by joint water and nitrogen limitation. Nat Geosci. Nature Research; 2014; 7: 920–924.
8. Rhodes CJ, Henrys P, Siriwardena GM, Whittingham MJ, Norton LR. The relative value of field survey and remote sensing for biodiversity assessment. Methods Ecol Evol. 2015; 6: 772–781.https://doi.org/ 10.1111/2041-210X.12385
9. Duro DC, Coops NC, Wulder M a., Han T. Development of a large area biodiversity monitoring system driven by remote sensing. Prog Phys Geogr. 2007; 31: 235–260.https://doi.org/10.1177/
0309133307079054
10. Friedl MA, McIver DK, Hodges JCF, Zhang XY, Muchoney D, Strahler AH, et al. Global land cover map-ping from MODIS: algorithms and early results. Remote Sens Environ. Elsevier; 2002; 83: 287–302.
https://doi.org/10.1016/S0034-4257(02)00078-0
11. Hansen MC, Potapov P V, Moore R, Hancher M, Turubanova S a, Tyukavina A, et al. High-resolution global maps of 21st-century forest cover change. Science. 2013; 342: 850–3.https://doi.org/10.1126/ science.1244693PMID:24233722
13. Loveland TR, Reed BC, Brown JF, Ohlen DO, Zhu Z, Yang L, et al. Development of a global land cover characteristics database and IGBP DISCover from 1 km AVHRR data. Int J Remote Sens. 2000; 21: 1303–1330.https://doi.org/10.1080/014311600210191
14. Sawaya KE, Olmanson LG, Heinert NJ, Brezonik PL, Bauer ME. Extending satellite remote sensing to local scales: Land and water resource monitoring using high-resolution imagery. Remote Sens Environ. 2003; 88: 144–156.https://doi.org/10.1016/j.rse.2003.04.006
15. Asner GP, Elmore AJ, Hughes RF, Warner AS, Vitousek PM. Ecosystem structure along bioclimatic gradients in Hawai’i from imaging spectroscopy. Remote Sens Environ. 2005; 96: 497–508.https://doi. org/10.1016/j.rse.2005.04.008
16. Baena S, Boyd DS, Smith P, Moat J, Foody GM, Gardens RB, et al. Earth observation archives for plant conservation: 50 years monitoring of Itigi-Sumbu thicket. Remote Sens Ecol Conserv. 2016; 2: 95–106.
https://doi.org/10.1002/rse2.18
17. Held A, Ticehurst C, Lymburner L, Williams N. High resolution mapping of tropical mangrove ecosys-tems using hyperspectral and radar remote sensing. Int J Remote Sens. Taylor & Francis; 2003; 24: 2739–2759.
18. Roy DP, Wulder M a., Loveland TR, C.E. W, Allen RG, Anderson MC, et al. Landsat-8: Science and product vision for terrestrial global change research. Remote Sens Environ. Elsevier B.V.; 2014; 145: 154–172.https://doi.org/10.1016/j.rse.2014.02.001
19. Wulder MA, Hall RJ, Coops NC, Franklin SE. High Spatial Resolution Remotely Sensed Data for Eco-system Characterization. 2004; 54: 511–521.https://doi.org/10.1641/0006-3568(2004)054
20. Gong P. Conifer species recognition: An exploratory analysis of in situ hyperspectral data. Remote Sens Environ. 1997; 62: 189–200.https://doi.org/10.1016/S0034-4257(97)00094-1
21. Clark ML, Roberts DA, Clark DB. Hyperspectral discrimination of tropical rain forest tree species at leaf to crown scales. Remote Sens Environ. 2005; 96: 375–398.https://doi.org/10.1016/j.rse.2005.03.009 22. Pu R. Broadleaf species recognition with in situ hyperspectral data. Int J Remote Sens. 2009; 30: 2759–
2779.https://doi.org/10.1080/01431160802555820
23. Dalponte M,Ørka H, Gobakken T. Tree species classification in boreal forests with hyperspectral data. IEEE Trans Geosci Remote Sens. 2013; 51: 2632–2645. Available:http://ieeexplore.ieee.org/xpls/abs_ all.jsp?arnumber=6331005
24. Pu R, Landry S. A comparative analysis of high spatial resolution IKONOS and WorldView-2 imagery for mapping urban tree species. Remote Sens Environ. 2012; 124: 516–533.https://doi.org/10.1016/j. rse.2012.06.011
25. Leckie DG, Gougeon FA, Tinis S, Nelson T, Burnett CN, Paradine D. Automated tree recognition in old growth conifer stands with high resolution digital imagery. Remote Sens Environ. 2005; 94: 311–326.
https://doi.org/10.1016/j.rse.2004.10.011
26. Sugumaran R, Pavuluri MK, Zerr D. The use of high-resolution imagery for identification of urban climax forest species using traditional and rule-based classification approach. IEEE Trans Geosci Remote Sens. 2003; 41: 1933–1939.https://doi.org/10.1109/TGRS.2003.815384
27. Dinuls R, Erins G, Lorencs A, Mednieks I, Sinica-Sinavskis J. Tree Species Identification in Mixed Baltic Forest Using LiDAR and Multispectral Data. IEEE J Sel Top Appl Earth Obs Remote Sens. 2012; 5: 594–603.https://doi.org/10.1109/JSTARS.2012.2196978
28. Hill R a., Thomson a. G. Mapping woodland species composition and structure using airborne spectral and LiDAR data. Int J Remote Sens. 2005; 26: 3763–3779.https://doi.org/10.1080/
01431160500114706
29. Holmgren J, PerssonÅ, So¨derman U. Species identification of individual trees by combining high reso-lution LiDAR data with multi-spectral images. Int J Remote Sens. 2008; 29: 1537–1552.https://doi.org/ 10.1080/01431160701736471
30. Dalponte M, Bruzzone L, Gianelle D. Tree species classification in the Southern Alps based on the fusion of very high geometrical resolution multispectral/hyperspectral images and LiDAR data. Remote Sens Environ. Elsevier Inc.; 2012; 123: 258–270.https://doi.org/10.1016/j.rse.2012.03.013
31. Turner W, Spector S, Gardiner N, Fladeland M, Sterling E, Steininger M. Remote sensing for biodiver-sity science and conservation. Trends Ecol Evol. Elsevier; 2003; 18: 306–314.https://doi.org/10.1016/ S0169-5347(03)00070-3
32. Palumbo I, Rose RA, Headley RMK, Nackoney J, Vodacek A, Wegmann M. Building capacity in remote sensing for conservation: present and future challenges. Remote Sens Ecol Conserv. Wiley Online Library; 2017; 3: 21–29.https://doi.org/10.1002/rse2.31
34. Koh LP, Wich SA. Dawn of drone ecology: low-cost autonomous aerial vehicles for conservation. Trop Conserv Sci. 2012; 5: 121–132. WOS:000310846600002
35. Zhang C, Kovacs JM. The application of small unmanned aerial systems for precision agriculture: A review. Precis Agric. 2012; 13: 693–712.https://doi.org/10.1007/s11119-012-9274-5
36. Honkavaara E, Saari H, Kaivosoja J, Po¨lo¨nen I, Hakala T, Litkey P, et al. Processing and assessment of spectrometric, stereoscopic imagery collected using a lightweight UAV spectral camera for precision agriculture. Remote Sens. 2013; 5: 5006–5039.https://doi.org/10.3390/rs5105006
37. Salamı´ E, Barrado C, Pastor E. UAV flight experiments applied to the remote sensing of vegetated areas. Remote Sens. 2014; 6: 11051–11081.https://doi.org/10.3390/rs61111051
38. Getzin S, Wiegand K, Scho¨ning I. Assessing biodiversity in forests using very high-resolution images and unmanned aerial vehicles. Methods Ecol Evol. 2012; 3: 397–404. https://doi.org/10.1111/j.2041-210X.2011.00158.x
39. Colomina I, Molina P. Unmanned aerial systems for photogrammetry and remote sensing: A review. ISPRS J Photogramm Remote Sens. International Society for Photogrammetry and Remote Sensing, Inc. (ISPRS); 2014; 92: 79–97.https://doi.org/10.1016/j.isprsjprs.2014.02.013
40. Hoffmann H, Jensen R, Thomsen A, Nieto H, Rasmussen J, Friborg T. Crop water stress maps for entire growing seasons from visible and thermal UAV imagery. Biogeosciences Discuss. 2016; 1–30.
https://doi.org/10.5194/bg-2016-316
41. Hunt ER, Dean Hively W, Fujikawa SJ, Linden DS, Daughtry CST, McCarty GW. Acquisition of NIR-green-blue digital photographs from unmanned aircraft for crop monitoring. Remote Sens. 2010; 2: 290–305.https://doi.org/10.3390/rs2010290
42. Dandois JP, Ellis EC. Remote sensing of vegetation structure using computer vision. Remote Sens. 2010; 2: 1157–1176.https://doi.org/10.3390/rs2041157
43. Fonstad MA, Dietrich JT, Courville BC, Jensen JL, Carbonneau PE. Topographic structure from motion: A new development in photogrammetric measurement. Earth Surf Process Landforms. 2013; 38: 421– 430.https://doi.org/10.1002/esp.3366
44. Baofeng S, Jinru X, Chunyu X, Yulin F, Yuyang S, Fuentes S. Digital surface model applied to unmanned aerial vehicle based photogrammetry to assess potential biotic or abiotic effects on grape-vine canopies. Int J Agric Biol Eng. International Journal of Agricultural and Biological Engineering (IJABE); 2016; 9: 119.
45. Habib A, Xiong W, He F, Yang HL, Crawford M. Improving Orthorectification of UAV-Based Push-Broom Scanner Imagery Using Derived Orthophotos From Frame Cameras. IEEE J Sel Top Appl Earth Obs Remote Sens. IEEE; 2017; 10: 262–276.
46. Cracknell a P. Synergy in remote sensing—what’ s in a pixel ? Int J Remote Sens. 1998; 19: 2025– 2047.https://doi.org/10.1080/014311698214848
47. Blaschke T. Object based image analysis for remote sensing. ISPRS J Photogramm Remote Sens. Elsevier B.V.; 2010; 65: 2–16.https://doi.org/10.1016/j.isprsjprs.2009.06.004
48. Laliberte AS, Rango A. Texture and scale in object-based analysis of subdecimeter resolution unmanned aerial vehicle (UAV) imagery. IEEE Trans Geosci Remote Sens. 2009; 47: 1–10.https://doi. org/10.1109/TGRS.2008.2009355
49. Laliberte AS, Herrick JE, Rango A, Winters C. Acquisition, Orthorectification, and Object-based Classifi-cation of Unmanned Aerial Vehicle (UAV) Imagery for Rangeland Monitoring. Photogramm Eng Remote Sens. 2010; 76: 661–672.https://doi.org/10.14358/PERS.76.6.661
50. Yu Q, Gong P, Clinton N, Biging G, Kelly M, Schirokauer D. Object-based detailed vegetation classifica-tion with airborne high spatial resoluclassifica-tion remote sensing imagery. Photogramm Eng Remote Sensing. 2006; 72: 799–811.https://doi.org/10.14358/PERS.72.7.799
51. Lo´pez-Granados F, Torres-Sa´nchez J, Serrano-Pe´rez A, de Castro AI, Mesas-Carrascosa F-J, Peña J-M. Early season weed mapping in sunflower using UAV technology: variability of herbicide treatment maps against weed thresholds. Precis Agric. Springer; 2016; 17: 183–199.
52. Chre´tien L, The´au J, Me´nard P. Visible and thermal infrared remote sensing for the detection of white-tailed deer using an unmanned aerial system. Wildl Soc Bull. Wiley Online Library; 2016;
53. Jarvis A, Reuter HI, Nelson A, Guevara E. Hole-filled SRTM for the globe Version 4. available from CGIAR-CSI SRTM 90m Database (http://srtm csi cgiar org). 2008;
54. Jing L, Hu B, Noland T, Li J. An individual tree crown delineation method based on multi-scale segmen-tation of imagery. ISPRS J Photogramm Remote Sens. International Society for Photogrammetry and Remote Sensing, Inc. (ISPRS); 2012; 70: 88–98.https://doi.org/10.1016/j.isprsjprs.2012.04.003 55. Burnett C, Blaschke T. A multi-scale segmentation/object relationship modelling methodology for
56. Pouliot DA, King DJ, Pitt DG. Development and evaluation of an automated tree detection delineation algorithm for monitoring regenerating coniferous forests. Can J For Res. NRC Research Press; 2005; 35: 2332–2345.
57. Tiede D, Hochleitner G, Blaschke T. A full GIS-based workflow for tree identification and tree crown delineation using laser scanning. ISPRS Work C. 2005; 5: 9–14.
58. Zhen Z, Quackenbush LJ, Zhang L. Trends in automatic individual tree crown detection and delinea-tion-evolution of LiDAR data. Remote Sens. 2016; 8: 1–26.https://doi.org/10.3390/rs8040333 59. Torresan C, Berton A, Carotenuto F, Di SF, Gioli B, Matese A, et al. Forestry applications of UAVs in
Europe : a review Forestry applications of UAVs in Europe : a review. Int J Remote Sens. Taylor & Fran-cis; 2016; 0: 1–21.https://doi.org/10.1080/01431161.2016.1252477
60. Guo Q, Su Y, Hu T, Zhao X, Wu F, Li Y, et al. An integrated UAV-borne lidar system for 3D habitat map-ping in three forest ecosystems across China. Int J Remote Sens. Taylor & Francis; 2017; 1–19.https:// doi.org/10.1080/01431161.2017.1285083
61. Lebourgeois V, Be´gue´ A, Labbe´ S, Mallavan B, Pre´vot L, Roux B. Can commercial digital cameras be used as multispectral sensors? A crop monitoring test. Sensors. 2008; 8: 7300–7322.https://doi.org/10. 3390/s8117300PMID:27873930
62. Fritz a., Kattenborn T, Koch B. UAV-Based Photogrammetric Point Clouds–Tree Stem Mapping in Open Stands in Comparison to Terrestrial Laser Scanner Point Clouds. ISPRS—Int Arch Photogramm Remote Sens Spat Inf Sci. 2013; XL-1/W2: 141–146. https://doi.org/10.5194/isprsarchives-XL-1-W2-141-2013
63. Zarco-Tejada PJ, Diaz-Varela R, Angileri V, Loudjani P. Tree height quantification using very high reso-lution imagery acquired from an unmanned aerial vehicle (UAV) and automatic 3D photo-reconstruction methods. Eur J Agron. Elsevier B.V.; 2014; 55: 89–99.https://doi.org/10.1016/j.eja.2014.01.004 64. Lisein J, Pierrot-Deseilligny M, Bonnet S, Lejeune P. A photogrammetric workflow for the creation of a
forest canopy height model from small unmanned aerial system imagery. Forests. 2013; 4: 922–944.
https://doi.org/10.3390/f4040922
65. Strahler AH, Woodcock CE, Smith JA. On the nature of models in remote sensing. Remote Sens Envi-ron. Elsevier; 1986; 20: 121–139.
66. Koch B, Heyder U, Weinacker H. Detection of Individual Tree Crowns in Airborne LIDAR Data.”. Photo-gramm Eng Remote Sensing. 2006; 72: 357–363.https://doi.org/10.1007/s10584-004-3566-3 67. Chen Q, Baldocchi D, Gong P, Kelly M. Isolating individual trees in a savanna woodland using small
footprint lidar data. Photogramm Eng Remote Sens. 2006; 72: 923–932.https://doi.org/10.14358/ PERS.72.8.923
68. Erikson M. Segmentation of individual tree crowns in colour aerial photographs using region growing supported by fuzzy rules. Can J For Res. NRC Research Press; 2003; 33: 1557–1563.
69. Singh M, Evans D, Tan BS, Nin CS. Mapping and characterizing selected canopy tree species at the Angkor world heritage site in Cambodia using aerial data. PLoS One. 2015; 10: 1–26.https://doi.org/10. 1371/journal.pone.0121558PMID:25902148
70. Ke Y, Quackenbush LJ, Im J. Synergistic use of QuickBird multispectral imagery and LIDAR data for object-based forest species classification. Remote Sens Environ. Elsevier Inc.; 2010; 114: 1141–1154.
https://doi.org/10.1016/j.rse.2010.01.002
71. Suwanprasit C, Strobl J, Adamczyk J. Extraction of Complex Plantations from VHR Imagery using OBIA Techniques. Int J Geoinformatics. 2015; 11.
72. Zhang Z. Object-Based Tree Species Classification in Urban Ecosystems using Lidar and Hyperspec-tral Data. Remote Sens. 2016; 7: 1–16.https://doi.org/10.3390/rs70x000x
73. Immitzer M, Vuolo F, Atzberger C. First experience with Sentinel-2 data for crop and tree species classi-fications in central Europe. Remote Sens. 2016; 8.https://doi.org/10.3390/rs8030166
74. Cai W, Borlace S, Lengaigne M, Van Rensch P, Collins M, Vecchi G, et al. Increasing frequency of extreme El Niño events due to greenhouse warming. Nat Clim Chang. Nature Research; 2014; 4: 111– 116.
75. Smith GM, Milton EJ. The use of the empirical line method to calibrate remotely sensed data to reflec-tance. Int J Remote Sens. Taylor & Francis; 1999; 20: 2653–2662.
76. Aasen H, Burkart A, Bolten A, Bareth G. Generating 3D hyperspectral information with lightweight UAV snapshot cameras for vegetation monitoring: From camera calibration to quality assurance. ISPRS J Photogramm Remote Sens. International Society for Photogrammetry and Remote Sensing, Inc. (ISPRS); 2015; 108: 245–259.https://doi.org/10.1016/j.isprsjprs.2015.08.002
estimation. Remote Sens Environ. Elsevier Inc.; 2015; 168: 102–112.https://doi.org/10.1016/j.rse. 2015.06.021
78. Lee AC, Lucas RM. A LiDAR-derived canopy density model for tree stem and crown mapping in Austra-lian forests. Remote Sens Environ. 2007; 111: 493–518.https://doi.org/10.1016/j.rse.2007.04.018 79. Duncanson LI, Cook BD, Hurtt GC, Dubayah RO. An efficient, multi-layered crown delineation algorithm
for mapping individual tree structure across multiple ecosystems. Remote Sens Environ. Elsevier Inc.; 2014; 154: 378–386.https://doi.org/10.1016/j.rse.2013.07.044