1
Fate of soil organic carbon and polycyclic aromatic hydrocarbons in a vineyard soil treated 2
with biochar 3
4
Alessandro G. Rombolàa, Will Meredithb, Colin E. Snapeb, Silvia Barontic, Lorenzo Genesioc, 5
Francesco Primo Vaccaric, Franco Migliettac, Daniele Fabbria* 6
7
a
Department of Chemistry “Giacomo Ciamician”, C.I.R.I. Energia Ambiente and C.I.R.S.A.,
8
Università di Bologna, Ravenna Campus, Via S. Alberto 163, 48132, Ravenna, Italy.
9 10
b
Department of Chemical and Environmental Engineering, University of Nottingham, Nottingham
11
NG7 2RD, UK
12 13
c
Institute of Biometeorology (IBIMET), National Research Council (CNR), Via G. Caproni 8,
14
50145, Florence, Italy
15
Abstract 16
The effect of biochar addition on the levels of black carbon (BC) and polcyclic aromatic 17
hydrocarbons (PAHs) in a vineyard soil in central Italy was investigated within a two year period. 18
Hydropyrolysis (HyPy) was used to determine the contents of BC (BCHyPy) in the amended and 19
control soils while the hydrocarbon composition of the semi-labile (non-BCHyPy) fraction released 20
by HyPy was determined by gas chromatography-mass spectrometry, together with the solvent-21
extractable PAHs. The concentrations of these three polycyclic aromatic carbon reservoirs, changed 22
and impacted differently on the soil organic carbon over the period of the trial. The addition of 23
biochar (33 ton dry biochar ha-1) gave rise to a sharp increase in soil organic carbon which could be 24
accounted for by an increase of BCHyPy. Over time, the concentration of BCHyPy decreased 25
significantly from 36 to 23 mg g-1, and as a carbon percentage from 79% to 61%. No clear time 26
trends were observed for the non-BCHyPy PAHs varying from 39 to 34 µg g-1 in treated soils, not 27
significantly different from control soils. However, the concentrations of extractable PAHs 28
increased markedly in the amended soils, and decreased with time from 153 to 78 ng g-1 remaining 29
always higher than those in untreated soil. The extent of the BCHyPy loss was more compatible with 30
Introduction 32
Biochar is the carbonaceous residue from biomass pyrolysis that has been proposed as an 33
amendment in agricultural practices to increase soil organic carbon (SOC) and to restrain the 34
growth of atmospheric CO2 through soil carbon sequestration.1-4 The real or possible benefits and 35
drawbacks of using biochar in agro-environmental management are being debated as experimental 36
data emerge from field studies.5-7 The knowledge of recalcitrance of carbon that can be sequestered 37
in soil and the potential contamination from polycyclic aromatic hydrocarbons (PAHs) are crucial 38
issues for evaluating the environmental impact of biochar and its role on SOC dynamics. For 39
characterising SOC, the refractory fraction of biochar can be described as black carbon (BC), the 40
pyrogenic carbon produced from the partial combustion of organic materials, including biomass and 41
fossil fuels. In analogy to BC, the biochar matrix comprises complex assemblage of polyaromatic 42
structures along with heteroaromatic components and alkyl moieties from thermally degraded 43
biomacromolecules.8-10 Although the inherent complexity of biochar makes comprehensive 44
characterization extremely challenging, the degree of aromaticity and ring condensation have been 45
considered to be key structural factors affecting thermal resistance and environmental 46
recalcitrance.11-12 It is often assumed that environmental recalcitrance is intimately connected with 47
thermal stability associated with these structural factors (aromaticity and ring condensation)13-15, 48
thus thermo/chemical parameters have been proposed to classify the carbon sequestering potential 49
of different biochars by a number of techniques, including thermogravimetry,11,16 flash 50
pyrolysis,17,18 and hydropyrolysis (HyPy).19-21 51
Amongst these techniques, the characterization of biochar by HyPy is of interest because as well as 52
quantifying BC in soils accurately,22 it defines BC in terms of the smallest polyaromatic structures 53
present. In HyPy, the sample mixed with a suitable catalyst is pyrolysed in the presence of 54
hydrogen at high pressure to promote the reductive removal of thermally labile organic matter 55
leaving a refractory carbonaceous residue. This residue, named as BCHyPy 22 or stable polycyclic 56
H/C ratio below 0.5.22 The organic fraction that is evolved by thermal reductive cleavage, denoted 58
as non-BCHyPy, revealed the presence of PAHs comprising 7 rings.21 These non-BCHyPy PAHs are 59
supposed to be less permanent (“semi-labile”)compared to larger PAH structures that constitute the 60
BCHyPy macromolecular network.19 It is hypothesized that the semi-labile fraction comprises PAHs 61
occurring in a variety of different interactions with the amorphous organic matter (e.g. biopolymers 62
and humic substances) and the carbonaceous materials (e.g. BC) occurring in soil. The level of 63
individual PAHs in biochar and soil of interest in environmental quality guidelines can be 64
determined by extraction with appropriate solvents and analysis by gas chromatography-mass 65
spectrometry (GC-MS). However, due to the strong interaction of PAHs with the carbonaceous 66
matrix23,only a minor fraction of extractable PAHs in biochar was found to be bioavailable.24 67
Clearly, the incorporation of biochar into soil systems represents an input of PAHs.25 Besides of 68
being a source, biochar may also act as sink for PAHs via adsorption.26 Therefore, biochar could 69
affect the persistence of PAHs in soils probably by reducing their bioavailability.27 70
Several laboratory incubation experiments have demonstrated the degradability of biochar and 71
BC in soils or model systems and provided valuable information on the extent of mineralization in 72
relation to char types13,14,18,28 and load,29 environmental conditions30-32 and soil characteristics.33-35 73
The few studies in the literature reporting on the fate of biochar in field experiments have shed 74
light on its role on SOC dynamics and highlighted the importance of the changes to soil properties 75
that occur after biochar incorporation as well as the chemical and physical changes that biochar 76
undergoes after soil incubation36-39. However, more investigations in field and with different 77
techniques are needed to increase our knowledge on the impact of biochar on organic carbon pools 78
in treated agricultural soils. 79
This study reports for the first time the combined application of HyPy and solvent extraction to 80
soil samples deriving from a multiannual time-scale biochar incubation experiment of a cultivated 81
PAHs) fractions in the amended and control plots to understand the effect of biochar addition on 83
SOC. 84
Experimental
85
Field experiment 86
The field experiment performed in a vineyard at the “Marchesi Antinori - La Braccesca Estate”, 87
Montepulciano, Tuscany, Italy (43°10′15″ N, 11°57′43″ E) was previously described.40,41
Overall, 88
the experiment consisted of 15 plots, each 7.5 m in width and 30 m in length, including 4 vineyard 89
rows and 3 inter-rows. Specifically, 10 plots were investigated as depicted in Figure 1. We have 90
analysed two treatments (five replicates plots each): with biochar (amended; two applications, in 91
2009 and 2010 at the same rate, with a total application corresponding to 33 t ha-1 of dry biochar 92
(considering an incorporation depth of 0.3 m and a soil density of 1.2, the application used in the 93
experiment corresponded to 0.91% in weight)) and without biochar as a control. The agricultural 94
soil was classified as sandy-clay-loam42 textured with 70% sand, 15% silt and 15% clay. The soil 95
characteristics were as follows: pH 5.37, total C 0.77%, total N 0.24%, total H 0.43%, and a cation 96
exchange capacity of 12.1 meq 100 g-1.40, 41 97
Soil was sampled four times from 2011 to 2013 (August 2011, December 2011, May 2012 and 98
May 2013). For the 10 replicates (5 replicates X 2 treatments) soil was sampled in 5 randomly 99
chosen points in the inter-row space of each replicate by means of a soil core sampler at 0-30 cm; 100
from these sub-samples an average sample for each replicate was obtained (5 replicates x 2 101
treatments x 4 sampling dates = 40 samples). Each sample was air-dried, sieved (mesh size: 2 mm) 102
in order to obtain homogeneous samples free of stones, larger roots and other coarse fragments, and 103
stored at - 20 °C before analysis. 104
The biochar used in the experiment was a commercial charcoal provided by “Romagna Carbone 105
s.n.c.” (Italy) obtained from dried (10% humidity) orchard pruning biomass (Pirus communis,
106
Malus domestica, Persica vulgaris, Vitis vinifera) through a slow pyrolysis process with a 107
of 500 ◦C was hold for 2.5 hours, the average heating rate before reaching the peak temperature was 109
15-18 °C/min.40 110
Analysis 111
Biochar analyses were performed on a sub-sample obtained by mixing three individual specimens 112
(about 5 g each) withdrawn in different places from the original biochar sample (1 Kg), then 113
thoroughly homogenized by grinding with an agate mortar and pestle, sieved (mesh size: 2 mm), 114
oven dried at 40 °C for 72 h, and stored at - 20 °C prior to analysis. 115
The carbon, nitrogen, hydrogen and sulfur (C,H,N,S) contents of the biochar and carbon content in 116
soil samples were determined by combustion using a Thermo Scientific FLASH 2000 Series 117
CHNS/O Elemental Analyzer (Thermo Fisher Scientific, Waltham, US). About 2-4 mg of biochar 118
or soil test samples were analysed and compared by calibration with the Reference Material 2,5-119
bis(5-tert-butyl-2-benzo-oxazol-2-yl)thiophene. 120
The content of carbonate in soils and the possible contribution of inorganic carbon from biochar ash 121
was negligible (< 0.1%) as confirmed by comparing total organic carbon measured after 122
hydrochloric acid (HCl) treatment and total carbon on a set of treated and amended soil samples. 123
Therefore, the total carbon determined in soil corresponded to the total organic carbon and was 124
termed SOC for uniformity. 125
The ash content of the biochar was measured by heating samples in a muffle at 550 °C for 6 hours. 126
The oxygen content of biochar was calculated by difference from the mass balance. 127
Analyses of extractable PAHs in biochar and soils were conducted using the method described 128
in more detail elsewhere.43 Briefly, 5 g of sample spiked with perdeuterated PAHs (acenapthtene- 129
d10, phenanthrene-d10, chrysene-d12) were extracted with 160 ml acetone/cyclohexane (1:1 v/v) 130
mixture for 36 hours. After addition of 1 ml of n-nonane, the solvent was evaporated, the mixture 131
cleaned-up by silica gel solid phase extraction and analysed by GC–MS. Occasionally, the 132
procedure was tested analyzing the soil certified reference material ERM–CC013a (manufactured 133
differences were observed between measured and certified values (relative errors in the -5% +11% 135
range, details in Table S1). Calibrations were performed in the 0.005-2.5 mg/L concentration range 136
for each PAH (serial dilutions of the PAH-Calibration Mix Supelco). Results from calibration and 137
blank analyses (limit of detection and quantitation, R2) are reported in Table S2. Recoveries of 138
surrogate PAHs (mean values ± s.d. n=40) were 75%±22%, 82%±21 and 83%±23 for acenapthtene-139
d10, phenanthrene-d10, chrysene-d12, respectively. 140
Hydropyrolysis 141
Hydropyrolysis (HyPy) was performed using the procedure described in detail by Meredith et
142
al.21,22 Briefly, 50-100 mg of biochar sample and 3-4 g of biochar amended soil were loaded with a 143
sulphided molybdenum (Mo) catalyst using an aqueous/methanol 0.2 M solution of ammonium 144
dioxydithiomolybdate [(NH4)2MoO2S2]. Catalyst weight was ~ 5% of the sample weight for soils, ~ 145
10% for biochar. Analyses were performed under H2 at 15 MPa from 50 to 250°C at 300°C min-1, 146
then from 250°C to 550°C for 2 min at 8 °C min -1. The evolved products (non-BCHyPy) were 147
quickly removed from the reactor vessel by a hydrogen sweep flow and trapped in a silica gel-filled 148
trap cooled by dry ice; the silica gel was eluted with n-hexane and dichloromethane, the organic 149
solutions concentrated, added with 100 µl internal standard solutions (n-hexatriacontane and tri-150
tert-butylbenzene, 100 mg l−1 each) and analysed by GC-MS (see below). 151
The weight of the solid residue in the reaction vessel (BCHyPy) was calculated by difference, 152
after weighing the catalyst loaded samples prior to and after each HyPy analysis. 153
Elemental compositions (C,H,N,S) of the samples before and after HyPy were determined by 154
combustion as described above. The presence of catalyst in the samples (5 %) did not affect 155
significantly the calculation of % BCHyPy. From elemental analysis and weight determinations, the 156
soil concentrations of BCHyPy (mgC gsoil-1) and its content relative to SOC (%BCHyPy), on a carbon 157
base, were calculated: 158
%BCHyPy ( mgC
100mgSOC) =
weight of residue (mg) ∗ C (%)
BCHyPy (mgC gsoil) =
%BCHyPy ∗ SOC 10
GC–MS analyses of the non-BCHyPy fractions were performed on a 6850 Agilent HP gas 159
chromatograph connected to a 5975 Agilent HP quadrupole mass spectrometer (Agilent 160
technologies Inc. Santa Clara, CA, USA) operating by electron ionization at 70 eV, and full scan 161
mode in the 35–650 m/z range. Analytes were separated with a HP-5MS fused silica capillary 162
column (stationary phase poly[5% diphenyl/95%dimethyl]siloxane, 30 m × 0.25 mm i.d., 0.25 µm 163
film thickness), using helium as the carrier gas. Individual n-alkanes were quantified from the m/z
164
57 mass chromatograms and by comparison with the added internal standard n-hexatriacontane 165
assuming equal response factors for each compound. PAHs were quantified from the mass 166
chromatograms of the molecular ion for each compound and by comparison with added 1,3,5-tri-167
tert-butylbenzene using the relative response factors determined by single calibration point (PAH-168
Calibration Mix Supelco at 10 mg L-1 for each PAH). Procedural blank analyses showed absence of 169
contamination. 170
Quantitative data are presented as mean values ± standard deviation (s.d., five replicates). An 171
analysis of variance (ANOVA) test was conducted with The “R Foundation for Statistical 172
Computing” R software version 3.1.2 (2014-10-31; http://www.r-project.org) to was to evaluate 173
significant difference between control and biochar amended soils, and between sampling periods. A 174
difference was considered statistically significant at level of p < 0.05. 175
Results 176
Stable fraction (BCHyPy)
177
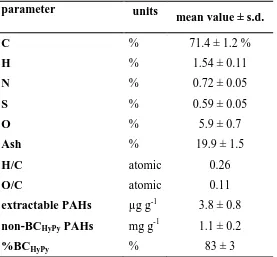
The utilised biochar obtained by slow pyrolysis was highly carbonized with 71% C content, and 178
atomic H/C and O/C ratios of 0.26 and 0.11, respectively (Table 1), consistent with a high degree of 179
aromaticity.12 However, the ash content was rather high (about 20%, Table 1), thus the evaluation 180
of the aromaticity from the O content measured by difference could be inadequate.12 The impact of 181
%) in comparison to control soil (0.7-0.9%, Table 2). Considering that the content of inorganic 183
carbon was negligible in these acidic soils, the total content of carbon corresponded to that of SOC 184
(see experimental). The addition of biochar increased significantly the total pool of SOC by over six 185
times (Table 2). An apparent reduction (statistically significant only in the last sampling, Table S3) 186
of SOC in biochar treated soils was measured with time and three years after the biochar application 187
in the vineyard, the SOC in amended soil was 3.8 times higher than that of control soil. 188
Recalcitrant black carbon (BC) accounted for the bulk of the additional SOC. This finding can 189
be observed in Figure 2 showing the percentage of the SOC occurring in a stable form as %BCHyPy. 190
The %BCHyPy in the untreated soil was on average 6 ± 1% (n=20) of the SOC, a value within the 191
range reported in the literature (BC/SOC 2-13% quartile range),23 and did not exhibit any trend with 192
time. Hence, the majority of SOC in the control soil occurred in a semi-labile form, probably 193
derived from a combination of lignocellulosic debris, humic acids, microbial biomass including 194
thermally labile charcoal. Amending the soil with biochar created the opposite situation, with the 195
majority of the SOC pool in the form of recalcitrant carbon, with BCHyPy levels of 70 % of SOC on 196
average. Specifically, the soil was amended with biochar two times during two years, then 15 197
months after the end of the second treatment, the %BCHyPy was 79% ± 4% (first soil sampling, 198
Figure 2). This value was very similar to that of original biochar (83%, Table 1). Obviously, the 199
effect of biochar addition in soils on the level of BC depended on the level of stable polycyclic 200
aromatic carbon (SPAC) in the original biochar which in turn is governed by the nature of the 201
feedstock and pyrolysis conditions as described by McBeath et al..19 The high percentage of BCHyPy 202
characterizing the biochar (Table 1) is consistent with the SPAC values reported for aromatized 203
biochars produced at high temperatures,19 indicative of resistance to degradation in soil. 204
Nevertheless, a gradual decrease of the %BCHyPy was observed with time down to 61% ± 2% after 205
36 months following the end of the biochar application (Figure 2), a difference statistically 206
time as depicted in figure 3A from 36 ± 5 mgC gsoil-1 at the first sampling to 23 ± 5 mgC gsoil-1 after 208
21 months, representing a loss of 36% (statistical results in Table S3). 209
The total loss of BCHyPy could be assigned to a variety of factors, including microbial degradation,30 210
chemical weathering13,32 and physical disturbance37,38 as discussed in the final section. 211
Semi-labile fraction (non-BCHyPy)
212
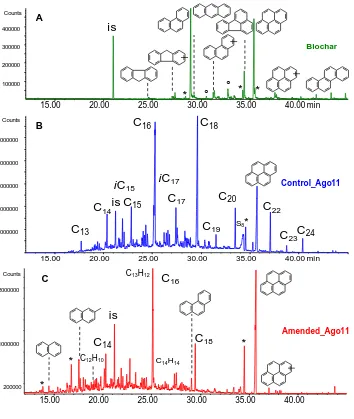
Exemplar mass chromatograms of the hydropyrolysates for the non-BCHyPy fraction in control and 213
amended soils are shown in Figures 4B and 4C and these are characterized by the presence of 214
aliphatic hydrocarbons, alkylbenzenes, diphenyls and PAHs. The composition of hydropyrolysates 215
of the treated and untreated soils was similar in terms of tentatively identified compounds, 216
suggesting that the incorporation of biochar did not markedly change the chemical nature of the 217
main hydrocarbons, but rather their relative amount. 218
Aliphatic hydrocarbons are characterised by n-alkanes in the range C13 to C27 with a distribution 219
centred at C16 and C18, and an even carbon number predominance (Tables S4-S5 in supporting 220
information). Iso- and anteiso C15 and C17 were also identified. Fatty acids are a more probable 221
source of these alkanes as they exhibited an even over odd preference, and typically include a high 222
abundance of C16 hexadecanoic (palmitic) acid and C18 octadecanoic (stearic) acid.44 It is known 223
that under HyPy conditions saturated fatty acids are converted into the corresponding alkanes 224
preserving the number of carbon atoms, while cracking into smaller hydrocarbons could occur with 225
unsaturated fatty acids.45 The skeleton backbone is also preserved so therefore the iso and anteiso 226
hydrocarbons can be assigned to the presence of the corresponding C15 and C17 acids of bacterial 227
origin.46 Fatty acids were probably covalently bond as acyl to lipids or macromolecular matrix and 228
make up the aliphatic polymethylene network of the semi-labile BC. These aliphatic compounds 229
were not evident in the non-BCHyPy fraction from the original biochar (Figure 4A). 230
The non-BCHyPy aromatic fraction of soils comprised monoaromatic rings represented by 231
alkylated benzenes and diphenyls and a PAH pattern dominated by pyrene (Figures 4B and 4C). 232
remaining after dichromate oxidation which was dominated by pyrene and minor levels of fluorene, 234
phenanthrene, chrysene, and benzo[ghi]perylene among those identified in our study.21 A similar 235
pattern was observed in the original biochar (Figure 4A) providing evidence of a common 236
polyaromatic backbone featured by specific alternant PAHs (phenanthrene, pyrene, chrysene; 237
benzo[ghi]perylene was not detected). Methylated naphthalenes, phenanthrenes and pyrenes were 238
detected as well. It is worth noting that partially hydrogenated PAHs were tentatively identified in 239
the MS-hydropyrolysates suggesting that a degree extent of hydrogenation does occur with signal a 240
peak assigned to dihydropyrene (m/z 204) being observed close to that for fluoranthene. 241
Distinctive differences between the amended and control soils were observed in the mean 242
concentrations of aliphatic and aromatic hydrocarbon constituents (Tables S4-S7 in supporting 243
information). The total concentrations of n-alkanes were higher in the control (around 100 µg g-1, 244
Table S4) than in the amended soils (about 40 µg g-1, Table S5). The mean concentrations of non-245
BCHyPy PAHs were higher in the amended than in the control soil (about 40 µg g-1 compared to 20 246
µg g-1, Tables S6 and S7, see also Figure 3B). However, these differences could not be proved to be 247
statistically significant (with the exception of control vs. treated soils after 9 months from the initial 248
sampling) due to the high dispersion of values in the amended soils caused by the inhomogeneous 249
distribution of biochar particles in the samples withdrawn from the same parcel and possible 250
fluctuations due to seasonal changes in SOC source and decay. Besides, it was shown that PAHs 251
could be heterogeneously distributed in the biochar samples.47However, a systematic higher content 252
of non-BCHyPy PAHs in the amended soils was observed across the whole sampling period (figure 253
3B). Four years after the addition of biochar to soil, semi-labile PAHs apparently were not 254
degraded. 255
Extractable PAHs 256
The concentrations of solvent extractable PAHs in amended and control soils are presented in 257
Figure 3C. Almost one year after the last biochar application, the total PAH concentrations in the 258
1
, n = 5, Figure 3C and Tables S8-S9). The level of PAHs in the amended soils decreased 260
significantly after 35 months down to 78 ± 20 ng g-1, while that of control remained almost constant 261
at 23 ± 3 ng g-1 (average in the whole period, n=20). The diminution in concentration of PAHs in 262
the treated soils involved principally the two-four ring PAHs (> 40% loss), and less for the five-six 263
ring PAHs (loss < 40%, Tables S8-S9). 264
Discussion 265
The pool of polycyclic aromatic carbon structures comprising the SOC have been operationally 266
differentiated into three fractions: distinctive (GC analyzable) PAH compounds released by solvent 267
extraction24,43 and HyPy (semi-labile fraction, non-BCHyPy),19,21 and the undefined large ring 268
polycyclic aromatic carbon matrix resistant to HyPy (stable fraction, BCHyPy or SPAC).19,21,22 The 269
fate of these fractions in a vineyard soil treated with biochar has been investigated over a time span 270
of about two years and compared to that of a control soil. In both soils, the concentrations of these 271
polyaromatic reservoirs spanned six orders of magnitude: ng g-1 (extractable, Figure 3C), µg g-1 272
(semi-labile, Figure 3B) and mgC g-1 (stable, Figure 3A). Their relative abundances were also 273
vastly different: on average the extractable PAH fraction accounted for 0.1 % (control)-0.3% 274
(treated) of the total semi-labile PAH pool, which in turn represented 4% (control)-0.1% (treated) of 275
the stable fraction. 276
The solvent extractable fraction is of importance for the assessment of environmental quality in 277
regulatory procedures. However, exhaustive solvent extraction tends to over-estimate the fraction of 278
bioavailable and bioaccessible PAHs that may pose a threat to living organisms and other 279
methodologies should be used to determine this fraction.24,48-50 Solvent extractable PAHs increased 280
remarkably (five times on average) after biochar treatment and remained significantly higher than 281
that in the control soil after almost two years (Figure 3C). Similar results were obtained by Quilliam 282
et al.27 who observed a significant increase of PAHs following biochar addition in two different 283
agricultural soils. Although the application of biochar occurred with an inevitable addition of 284
background soils (<1 to 7,840 ng g-1).51 Obviously, the level of soil contamination will be 286
determined by the degree of contamination of biochar which is dependent on feedstock materials 287
and process conditions.24,43,52-54 These data supported the view that when the PAH concentrations in 288
the biochar fulfill the threshold levels proposed by the IBI55 and EBC,56 as for the biochar utilised in 289
this study (Table 1, Table S10), the impact to soil is expected to be minimal. However, the large 290
pool of BCHyPy may influence the persistence of mobile PAHs by lowering the microbial 291
activity.15,27 Alternatively, it may act as a reservoir for PAHs15 or favoring the sorption of 292
endogenous and environmental PAHs26 given the relatively high biochar-water partitioning 293
coefficients.24 294
The non-BCHyPy PAH fractions in treated and control soils were not significantly different 295
(Figure 3B) and did not change significantly (statistical results in Table S3 for treated soil) with 296
time suggesting that naturally occurring non-BCHyPy PAHs are dominating this pool turnover. The 297
content of non-BCHyPy PAHs in the original biochar was around 1 mg g-1 (Table 1, individual PAHs 298
in Table S10), probably not sufficient to impact markedly the SOC. These PAHs were probably 299
covalently linked21 or strongly sorbed onto aromatic surfaces, nanopores or occluded sites of the 300
BCHyPy matrix, and therefore not prone to decomposition. On the contrary, biochar amendment 301
increased massively the stable BCHyPy reservoir in comparison to the untreated soil (sixty times, 302
Figure 3A) and ten times on average its proportion to SOC (% BCHyPy, Figure 2). Noteworthy is that 303
its absolute concentration decreased with time with a 36% carbon loss in 21 months (Figure 3A). It 304
is known that biochar can be mineralized by both abiotic (oxidation) and biotic processes in 305
laboratory incubation, however, the reported losses were much lower than those observed in this 306
study (e.g. < 3%,30,35 < 5%,18 <12%28 in days/months, 0.5%-8.9% in five years,14 6% after eight 307
years33). Small losses (3%) due to respiration were reported in field studies,38 while significant 308
decomposition of BC (up to 70%) was reported to occur in topsoil in the first 30 years due to 309
physical processes (vertical and lateral export) in addition to chemical mineralisation.36 Therefore, 310
biochar particles rather than mineralization, even though the latter can be important in the first 312
period due to priming effects.57 313
The depletion of the relative contribution of BCHyPy (Figure 2) confirmed that the aromatic 314
recalcitrant fraction was lost preferentially in comparison to other SOC components. This finding is 315
in accordance with the studies by Rumpel et al. 2009 with rain simulators.37 These authors found 316
that the lateral and vertical (infiltration) removal of SOC in agricultural soils by water erosion can 317
be significant (up to 55%) and more pronounced for the carbon-rich (less dense) recalcitrant 318
(chemically resistant) BC fraction. The vertical infiltration of pyrogenic carbon was found in soil 319
microcosms.34 The type of prevailing physical distribution could be governed by the different water 320
regime in tropical and temperate zones, with low-intensity rainfall favoring vertical transport and 321
splash erosion horizontal transport.37 In our study, erosion could be favored by the gentle slope of 322
the vineyard which may induce a preferential loss of BC as observed for steep slopes with high 323
erosion rates.58 Based on the results from carbon isotope analysis, Major et al.38 supposed that water 324
runoff was the principal process capable to explain the loss of biochar in a treated soil after two 325
years, being the loss by respiration and vertical transport minimal. 326
The absolute and relative concentration of BCHyPy did not change significantly in the last two 327
sampling campaigns (April 2012 and May 2013) while the cumulated rainfall increased,41 328
indicating that a substantial part of carbon from biochar is resistant to migration processes. In fact, 329
the grape productivity increased (up to 66%) in all the harvests following biochar amendment in the 330
2010-2014 period, even though the fruit quality remained unaffected. The increased yields were 331
likely to be due to the enhanced soil water content and plant available water in the treated soils in 332
comparison to the control soil.40,41 Other field studies on vineyards with a slope gradient reported 333
subtle effects on productivity and quality, but the fate of biochar was not investigated.59 The 334
persistence of BC demonstrated by HyPy analysis supports the role played by biochar in regulating 335
water availability, but potential losses due to SOC dynamics should be carefully evaluated 336
stability rather than the inherent biochar recalcitrance.60 This study demonstrated the usefulness of 338
HyPy to shed light on the characteristics of BC put into the environment when biochar is applied in 339
soil systems. 340
Associated content
341
Supporting Information Available 342
Supporting information contains the results from the analysis of PAHs in CRM soil (Table S1), 343
PAH calibration (Table S2), statistical analysis of treated soils (Table S3), analysis of individual 344
non-BCHyPy alkanes (Tables S4 and S5), analysis of individual non-BCHyPy PAHs (Tables S6 and 345
S7), analysis of individual solvent extractable PAHs (Tables S8 and S9), analysis of individual 346
extractable and non-BCHyPy PAHs in biochar (Table S10). This information is available free of 347
charge via the Internet at http://pubs.acs.org. 348
Author information
349
Corresponding author:* E-mail: dani.fabbri@unibo.it; phone: 0544-937344; fax: ++39-350
0544-937411. 351
Notes: The authors declare no competing financial interest. 352
Acknowledgements
353
AGR wish to thank the Department of Chemistry “Giacomo Ciamician” Università di Bologna for 354
the grant Marco Polo to the National Environmental Research Council (NERC standard grant 355
number, NE/F017456/1) for developing hydropyrolysis to quantify black carbon at the University 356
of Nottingham. We owe our special thanks to Marchesi Antinori - La Braccesca Estate” where we 357
have done our experimental trial. This study was partly supported by: the Italian Biochar 358
Association (ICHAR http://www.ichar.org) and it contributes to EuroCHAR project (FP7-ENV-359
2010 ID-265179). DF thanks the Italian Ministero dell’Istruzione, dell’Università e della Ricerca 360
362
[image:15.595.217.382.96.281.2]363
Figure 1. Experimental layout in the vineyard indicating the location of the five plots amended 364
with biochar (A) under the same conditions and the nearby control (C) plots. Photo from 365
GoogleEarth. 366
367
368 369 370
Figure 2. Black carbon from HyPy (%BCHyPy) as percentage of soil organic carbon in the biochar 371
amended (red circles) and control (blue squares) soils vs. sampling time (months from the first 372
sampling). Mean values ± 2*s.d. (n=5). 373
%
B
CH
y
P
y
(B
C
/S
O
C
%)
months 0
20 40 60 80 100
0 5 10 15 20
amended
[image:15.595.172.416.412.591.2]374
Figure 3. Concentration vs. sampling time (months from the first sampling) of biochar amended 375
(red circles) and control soils (blue squares) of different polycyclic aromatic fractions. (A) stable 376
BCHyPy, (B) non-BCHyPy PAHs, and (C) solvent extractable PAHs. Mean values ± s.d. (n=5, error 377
bars not visible when smaller than square size). 378
0 10 20 30 40 50
0 5 10 15 20
0 50 100 150 200
0 5 10 15 20
0 10 20 30 40 50 60 70
0 5 10 15 20
months months months amended
control
BCHyPy
m
g
C
g
-1
µ
g
g
-1
n
g
g
-1
A
B
C
non-BCHyPy
PAHs
379 380
Figure 4. Examples of total ion chromatograms for the hydropyrolysates (non-BCHyPy fraction). 381
From top to bottom: (A) biochar, (B) control soil and (C) soil amended with biochar sampled in 382
August 2011. Cx: n-alkanes with x carbon atoms, i: iso/anteiso, CxHy: biphenyls, °: 383
phenylnaphthalenes (tentative), *: probably hydrogenated PAHs. 384
385
is
is
is
* * *
C17
C16 C18
C19 C20
C22
C24 C23 C14 C15
iC15 iC17
S8
*
C13H12
C18 C16 C13
C14
*
C12H10 C14H14
15.00 20.00 25.00 30.00 35.00 40.00
200000 1000000 2000000 Counts
Amended_Ago11
15.00 20.00 25.00 30.00 35.00 40.00 min
1000000 2000000 3000000 4000000 5000000 Counts
Control_Ago11
15.00 20.00 25.00 30.00 35.00 40.00 min
100000 200000 300000 400000 Counts
Biochar
* *
A
B
Table 1. Elemental analysis (oxygen by difference), atomic H/C and O/C ratios, ash content, 386
solvent extractable PAHs, non-BCHyPy PAHs and %BCHyPy (%BCHyPy/SOC) of the biochar applied 387
in the field experiment (mean values ± standard deviation s.d., n=3 on a dry basis). 388
389
parameter units
mean value ± s.d.
C % 71.4 ± 1.2 %
H % 1.54 ± 0.11
N % 0.72 ± 0.05
S % 0.59 ± 0.05
O % 5.9 ± 0.7
Ash % 19.9 ± 1.5
H/C atomic 0.26
O/C atomic 0.11
extractable PAHs µg g-1 3.8 ± 0.8 non-BCHyPy PAHs mg g-1 1.1 ± 0.2
%BCHyPy % 83 ± 3
390
Table 2. Soil organic carbon (SOC) of the soil treated with biochar and untreated soil (control) in 391
different sampling periods (months elapsed after the last biochar application). Values are mean 392
values ± s.d., n=5, % on a dry basis. 393
Aug 2011 Dec 2011 May 2012 May 2013
SOC% months 0 4 9 21
Control soil 0.76±0.21 0.76±0.21 0.83±0.21 0.91±0.12
Biochar amended soil 4.79±0.58 4.30±0.83 3.97±0.75 3.49±0.29
[image:18.595.43.555.493.605.2]References 397
398
1. Lehmann, J. Bio-energy in the black. Front. Ecol. Environ. 2007,5, 381–387. 399
400
2. Sohi, S.P.; Krull, E.; Lopez-Capel, E.; Bol, R. A review of biochar and its use and function 401
in soil. Adv. Agronom.2010, 105, 47–82. 402
403
3. Spokas, K.A.; Cantrell, KB.; Novak, J.M; Archer, D.A.; Ippolito, J.A.; Collins, H.P.; 404
Boateng, A.A.; Lima, I.M.; Lamb, M.C.; McAloon, A.J. et al. Biochar: A synthesis of its 405
agronomic impact beyond carbon sequestration. J. Environ. Qual. 2012, 41, 973–989. 406
407
4. Meyer, S.; Glaser, B.; Quicker, P. Technical, Economical, and Climate-Related Aspects of 408
Biochar Production Technologies: A Literature Review. Environ. Sci. Technol. 2011, 45, 409
9473–9483. 410
411
5. Jeffery, S.; Bezemer, T.M.; Cornelissen, G.; Kuyper. T.W.; Lehmann. J.; Mommer. L.; 412
Sohi, S.P.; Van De Voorde, T.F.J .; Wardle, D.A.; Van Groenigen J.W. The way forward in 413
biochar research: targeting trade-offs between the potential wins. GCB Bioenergy. 2015, 7, 414
1–13. 415
416
6. Mukherjee, A; Lal, R. The biochar dilemma. Soil Res.2014, 52, 217–230. 417
418
7. van Laer, T.; de Smedt, P.; Ronsse, F.; Ruysschaert, G.; Boeckx, P.; Verstraete, W.; Buysse, 419
J.; Lavrysen, L.J. Legal constraints and opportunities for biochar: a case analysis of EU law. 420
GCB Bioenergy2015, 7, 14–24. 421
422
8. Preston, C.M.; Schmidt, M.W.I. Black (pyrogenic) carbon: a synthesis of current knowledge 423
and uncertainties with special consideration of boreal regions. Biogeosciences2006, 3, 397– 424
420. 425
426
9. Knicker, H; Hilscher, A; González-Vila, F.J; Almendros, G. A new conceptual model for 427
the structural properties of char produced during vegetation fires. Org. Geochem. 2008, 39, 428
935–939. 429
430
10.Keiluweit, M.; Nico, P.S.; Johnson, M.G.; Kleber, M. Dynamic Molecular Structure of Plant 431
Biomass-Derived Black Carbon (Biochar). Environ. Sci. Technol. 2010, 44, 1247–1253. 432
433
11.Harvey, O.R.; Kuo , L-J.; Zimmerman, A.R.; Louchouarn, P.; Amonette, J.E.; Herbert B.E. 434
An index-based approach to assessing recalcitrance and soil carbon sequestration potential 435
of engineered black carbons (biochars). Environ. Sci. Technol.2012, 46, 1415–1421. 436
437
12.Wiedemeier, D. B.; Abiven, S.; Hockaday, W.C.; Keiluweit, M.; Kleber, M.; Masiello, 438
C.A.; McBeath, A.V.; Nico, P.S.; Pyle, L.A.; Schneider, M.P.W. et al. Aromaticity and 439
degree of aromatic condensation of char. Org.Geochem. 2015, 78, 135–143. 440
441
13.Nguyen, B.T.; Lehmann, J.; Hockaday, W.C.; Joseph, S.; Masiello, C.A.; Temperature 442
Sensitivity of Black Carbon Decomposition and Oxidation. Environ. Sci. Technol. 2010, 44, 443
445
14.Singh, B.P.; Cowie, A.L.; Smernik, R.J. Biochar Carbon Stability in a Clayey Soil As a 446
Function of Feedstock and Pyrolysis Temperature. Environ. Sci. Technol. 2012, 46, 447
11770−11778. 448
449
15.Ameloot , N.; Graber, E. R.; Verheijen, F. G. A.; De Neve, S. Interactions between biochar 450
stability and soil organisms: review and research needs. European J.Soil Sci.2013, 64, 379– 451
390. 452
453
16.Mašek, O.; Brownsort, P.; Cross, A.; Sohi, S. Influence of production conditions on the 454
yield and environmental stability of biochar. Fuel2013, 103, 151–155. 455
456
17.Kaal, J.; Cortizas, A.M.; Reyes, O.; Solino, M. Molecular characterization of Ulex
457
europaeus biochar obtained from laboratory heat treatment experiments—a pyrolysis– 458
GC/MS study. J. Anal. Appl. Pyrol.2012, 95, 205–212. 459
460
18.Conti, R.; Rombolà, A.G.; Modelli, A.; Torri, C.; Fabbri. D. Evaluation of the thermal and 461
environmental stability of switchgrass biochars by Py-GC-MS. J. Anal. Appl. Pyrol. 2014, 462
110, 239–247. 463
464
19.McBeath, A.V.; Wurster, C.M.; Bird, M.I. Influence of feedstock properties and pyrolysis 465
conditions on biochar carbon stability as determined by hydrogen pyrolysis. Biomass.
466
Bioener. 2015, 73, 155-173. 467
468
20.Wurster, C.M.; Saiz, G.; Schneider, M.P.W.; Schmidt, M.W.I.; Bird, M.I. Quantifying 469
pyrogenic carbon from thermosequences of wood and grass using hydrogen pyrolysis. Org.
470
Geochem. 2013, 62, 28-32. 471
472
21.Meredith, W.; Ascough, P.L.; Bird, M.I. ; Large, D.J.; Snape, C.E. ; Song, J. ; Sun, Y. ; 473
Tilston, E.L. Direct evidence from hydropyrolysis for the retention of long alkyl moieties in 474
black carbon fractions isolated by acidified dichromate oxidation J. Anal. Appl. Pyrol.. 475
2013, 103, 232–239. 476
477
22.Meredith, W.; Ascough, P.L.; Bird, M.I. ; Large, D.J.; Snape, C.E.; Sun, Y. ; Tilston, E.L. 478
Assessment of hydropyrolysis as a method for the quantification of black carbon using 479
standard reference materials. Geochim. Cosmochim. AC2012, 97(15), 131-147. 480
481
23.Cornelissen, G.; Gustafsson, O.; Bucheli, T.D.; Jonker, M.T.O.; Koelmans, A.A.;Van Noort, 482
P.C.M. Extensive Sorption of Organic Compounds to Black Carbon, Coal, and Kerogen in 483
Sediments and Soils: Mechanisms and Consequences for Distribution, Bioaccumulation, and 484
Biodegradation. Environ.Sci.Technol. 2005, 39, 6881-6895. 485
486
24.Hale, S.E.; Lehmann, J.; Rutherford, D.; Zimmerman, A.R.; Bachmann, R.T.; 487
Shitumbanuma, V.; O’Toole, A.; Sundqvist, K.L.; Arp, H.P.H.; Cornelissen, G. Quantifying 488
the total and bioavailable polycyclic aromatic hydrocarbons and dioxins in biochars. 489
Environ. Sci. Technol.2012, 46, 2830-2838. 490
25.Knicker, H. How does fire affect the nature and stability of soil organic nitrogen and 492
carbon? A review. Biogeochemistry2007, 85, 91–118. 493
494
26.Chen, B.; Yuan, M.; Enhanced sorption of polycyclic aromatic hydrocarbons by soil 495
amended with biochar. J. Soils Sediments2011, 11, 62–71. 496
497
27.Quilliam, R.S.; Rangecroft, S.; Emmett, B.A.; Deluca, T.H.; Jones, D.L. Is biochar a source 498
or sink for polycyclic aromatic hydrocarbon (PAH) compounds in agricultural soils? GCB
499
Bioenergy2013, 5, 96-103. 500
501
28.Bruun, E.W; Hauggaard-Nielsen, H.; Ibrahim, N.; Egsgaard, H.; Ambus, P.; Jensen, P.A.; 502
Dam-Johansen, K. Influence of fast pyrolysis temperature on biochar labile fraction and 503
short-term carbon loss in a loamy soil. Biomass Bioenerg. 2011, 35, 1182–1189. 504
505
29.Smith, J.L.; Collins, H.P.; Bailey, V.L. The effect of young biochar on soil respiration. Soil
506
Biol. Biochem. 2010, 42, 2345-2347. 507
508
30.Zimmerman, A.R. Abiotic and Microbial Oxidation of Laboratory-Produced Black Carbon 509
(Biochar). Environ. Sci. Technol.2010, 44, 1295–1301. 510
511
31.Fang , Y; Singh, B.; Singh, B.P. Effect of temperature on biochar priming effects and its 512
stability in soils. Soil Biol. Biochem. 2015, 80, 136-145. 513
514
32.Naisse, C.; Girardin, C.; Lefevre, R.; Pozzi, A.; Maas, R.; Stark, A.; Rumpel, C. Effect of 515
physical weathering on the carbon sequestration potential of biochars and hydrochars in soil. 516
GCB Bioenergy2015, 7, 488–496. 517
518
33.Kuzyakov, Y.; Bogomolova, I.; Glaser B. Biochar stability in soil: decomposition during 519
eight years and transformation as assessed by compound-specific 14C analysis. Soil Biol.
520
Biochem. 2014, 70, 229–236. 521
522
34.Hilscher, A., Knicker, H. Degradation of grass-derived pyrogenic organic material, transport 523
of the residues within a soil column and distribution in soil organic matter fractions during a 524
28 month microcosm experiment. Org. Geochem.2011, 42, 42-54. 525
526
35.Li, F.; Cao, X.D.; Zhao, L.; Wang, J.F; Ding, Z.L. Effects of Mineral Additives on Biochar 527
Formation: Carbon Retention, Stability, and Properties. Environ. Sci. Technol. 2014, 48, 528
11211−11217. 529
530
36.Nguyen, B.T.; Lehmann, J.; Kinyangi, J.; Smernik, R.; Riha, S.J.; Engelhard, M.H.. Long-531
term black carbon dynamics in cultivated soil. Biogeochem. 2009, 92:163–176. 532
533
37.Rumpel C.; Ba, A.; Darboux, F.; Chaplot, V.; Planchon, O. Erosion budget and process 534
selectivity of black carbon at meter scale. Geoderma 2009, 154, 131–137. 535
38.Major, J.; Lehmann, J.; Rondon, M.; Goodale, C. Fate of soil-applied black carbon: 537
downward migration, leaching and soil respiration. Global Change Biology 2010, 16(4), 538
1366-1379. 539
540
39.Malghani, S.; Jüschke, E.; Baumert, J.; Thuille, A.; Antonietti, M.; Trumbore, S.; Gleixner, 541
G. Carbon sequestration potential of hydrothermal carbonization char (hydrochar) in two 542
contrasting soils; results of a 1-year field study. Biol. Fert. Soils2015, 51,123–134. 543
544
40.Baronti, S.; Vaccari, F.P.; Miglietta, F.; Calzolari, C.; Lugato, E.; Orlandini, S.; Pini, R.; 545
Zulian, C.; Genesio, L. Impact of biochar application on plant water relations in Vitis
546
vinifera (L.). Europ. J. Agron.2014, 53, 38-44. 547
548
41.Genesio, L.; Miglietta, F.; Baronti, S.; Vaccari, F.P. Biochar increases vineyard productivity 549
without affecting grape quality: Results from a four years field experiment in Tuscany. Agr.
550
Ecosyst. Environ.2015, 201, 20-25. 551
552
42.U.S.D.A. (United States Department of Agriculture). Natural Resources Conservation 553
Service. National Soil Survey Handbook, 2005. 554
555
43.Fabbri, D.; Rombolà, A.G.; Torri, C.; Spokas, K.A. Determination of polycyclic aromatic 556
hydrocarbons in biochar and biochar amended soil. J. Anal. Appl. Pyrol.2013, 103, 60-67. 557
558
44.Zelles, L. Fatty acid patterns of phospholipids and lipopolysaccharides in the 559
characterisation of microbial communities in soil: a review. Biol. Fertil. Soils 1999, 29, 560
111–129. 561
562
45.Meredith, W.; Sun, C.-G.; Snape, C.E.; Sephton, M.A.; Love, G.D. The use of model 563
compounds to investigate the release of covalently bound biomarkers via hydropyrolysis. 564
Org. Geochem.2006, 37, 1705–1714. 565
566
46.Spring, S.; Schulze, R.; Overmann, J.; Schleifer, K.-H. Identification and characterization of 567
ecologically significant prokaryotes in the sediment of freshwater lakes: molecular and 568
cultivation studies. FEMS Microbiol. Rev.2000, 24, 573-590. 569
570
47.Bucheli, T.D.; Bachmann, H.J.; Blum, F.; Bürge, D.; Giger, R.; Hilber, I.; Keita, J.; 571
Leifeld, J.; Schmidt, H.-P. On the heterogeneity of biochar and consequences for 572
itsrepresentative sampling. J.Anal.Appl.Pyrol. 2014, 107, 25-30. 573
574
48. Riding, M.J.; Doick, K.J.; Martin, F.L.; Jones, K.C.; Semple, K.T. Chemical measures of 575
bioavailability/bioaccessibility of PAHs in soil: Fundamentals to application. 576
J.Hazard.Mater.2013, 261, 687– 700. 577
578
49.Cachada, A.; Pereira, R.; Ferreira da Silva, E.; Duarte, A.C. The prediction of PAHs 579
bioavailability in soils using chemical methods: State of the art and future challenges. Sci.
580
Total Environ. 2014, 472, 463–480. 581
50. Arp, H.P.H; Hale, S.E.; Kruså, M.E.; Cornelissen,G.; Grabanski, C.B.; Miller, D.J; 583
Hawthorne, S.B. Review of Polyoxymethylene Passive Sampling Methods For Quantifying 584
Freely Dissolved Porewater Concentrations of Hydrophobic Organic Contaminants. 585
Environ. Toxicol. Chem. 2015, 34, 710-720. 586
587
51.Nam, J.J.; Sweetman, A.J.; Jones, K.C. Polynuclear aromatic hydrocarbons (PAHs) in 588
global background soils. J.Environ.Monitor.2009, 11, 45–48. 589
590
52.Keiluweit, M.; Kleber, M.; Sparrow, M.A.; Simoneit, B.R.T.; Prahl, F.G. Solvent 591
extractable polycyclic aromatic hydrocarbons in biochar: influence of pyrolysis temperature 592
and feedstock. Environ. Sci. Technol. 2012, 46, 9333–9341. 593
594
53.Kloss, S.; Zehetner, F.; Dellantonio, A.; Hamid, R.; Ottner, F.; Liedtke, V.; Schwanninger, 595
M.; Gerzabek, M.H.; Soja, G. Characterization of slow pyrolysis biochars: effects of 596
feedstocks and pyrolysis temperature on biochar properties. J.Environ. Qual.2012, 41, 990– 597
1000. 598
599
54.Wiedemeier, D.B.; Brodowski, S.; Wiesenberg, G.L.B. Pyrogenic molecular markers: 600
Linking PAH with BPCA analysis. Chemosphere 2015, 119, 432–437. 601
602
55.International Biochar Initiative (IBI), Standardized product definition and product testing 603
guidelines for biochar that is used in soil, in: IBI-STD-01, 2012 May,_http://www.biochar-604
international.org/characterizationstandard_. Version 1.(accessed on 17th March, 2014). 605
606
56.EBC, European Biochar Certificate-Guidelines for a Sustainable Production of Biochar, 607
European Biochar Foundation (EBC), Arbaz, Switzerland, 2012, Version4.8 of 13th 608
December. 609
610
57.Zimmerman A.R.; Gao B.; Ahn, M.Y. Positive and negative carbon mineralization priming 611
effects among a variety of biochar-amended soils. Soil Biol. Biochem.2011, 43, 1169-1179. 612
613
58.Rumpel, C.; Chaplot, V.; Planchon, O.; Bernadou, J.; Valentin, C.; Mariotti, A. Preferential 614
erosion of black carbon on steep slopes with slash and burn agriculture. Catena 2006, 65, 615
30–40. 616
617
59.Schmidt, H.-P.; Kammann, C.; Niggli, C.; Evangelou, M.W.H.; Mackie, K.A.; Abiven, S. 618
Biochar and biochar-compost as soil amendments to a vineyard soil:Influences on plant 619
growth, nutrient uptake, plant health and grape quality. Agr. Ecosyst. Environ. 2014, 191, 620
117–123. 621
622
60.Schmidt, M.W.I.; Torn, M.S.; Abiven, S.; Dittmar, T.; Guggenberger, G.; Janssens, I.A.; 623
Kleber, M.; Kogel-Knabner, I.; Lehmann, J.; Manning, D.A.C. et al. Persistence of soil 624