White Paper
D
IGGING
I
NTO
D
ATA
W
HITE
P
APER
TRADING CONSEQUENCES
Ewan Klein School of Informatics, University of Edinburgh, UK
Beatrice Alex Claire Grover Richard Tobin
Colin Coates Multidisciplinary Studies Department, Glendon College, York University, Toronto, Canada Jim Clifford History Department, University of
Saskatchewan, Saskatoon, Canada
Aaron Quigley SACHI, School of Computer Science, University of St Andrews, UK
Uta Hinrichs
James Reid EDINA, University of Edinburgh, UK Nicola Osborne
Ian Fieldhouse
White Paper
1 Executive Summary: ... ... 4
2 Introduction ... ... 5
3 Research Results ... ... 7
3.1 Historical Research ... 7
3.2 Research related to Text Mining ... 9
3.2.1 Effects of OCR Errors on Text Mining ... 10
3.2.2 Lexicon Creation ... 11
3.2.2.1 Technical Description ... 11
3.2.2.2 Manual Curation from Archival Sources ... 13
3.2.2.3 Bootstrapping the Lexicon ... 16
3.2.3 Text Mining ... 18
3.3 Visualisation Research ... 26
3.3.1 General Challenges and Goals ... 26
3.3.1.1 Enabling Open-Ended Explorations ... 27
3.3.1.2 Providing Multiple Entry Points into the Data Collection ... 28
3.3.1.3 Enable High-Level Overviews while Providing Direct Access to Documents ... 29
3.3.2 Exploration 1: Interlinking Geospatial, Temporal, and Contextual Dimensions ... 29
3.3.3 Exploration 2: Showing Relations Between Different Commodities ... 34
3.3.4 Exploration 3: Mapping Location Mentions across Time ... 37
3.3.5 Exploration 4: Commodity Trading & Climate Change ... 42
3.3.6 Summary ... 44
White Paper
3.4 Prototype feedback ... 44
3.4.1 Challenges ... 45
4 Datasets, Software, Algorithms and Techniques ... ... 45
4.1 Lexicon Development ... 45
4.2 Text mining and Geo-referencing ... 46
4.3 Database ... 46
4.4 Visualisation ... 52
5 Dissemination ... ... 53
5.1 Publications and talks ... 53
5.2 Dissemination via Social Media ... 54
6 Project Management ... ... 59
7 Lessons Learned ... ... 60
7.1 The value of big data for historical research ... 60
7.2 Data Access ... 61
7.3 Cross-disciplinarity ... 62
7.4 Annotation ... 63
7.5 Visualisation ... 63
8 Conclusion ... ... 63
White Paper
1
Executive Summary
Scholars interested in nineteenth-century global economic history face a voluminous historical record. Conventional approaches to primary source research on the economic and environmental implications of globalised commodity flows typically restrict researchers to specific locations or a small handful of commodities. By taking advantage of cutting-edge computational tools, the project was able to address much larger data sets for historical research, and thereby provides historians with the means to develop new data-driven research questions. In particular, this project has demonstrated that text mining techniques applied to tens of thousands of documents about nineteenth-century commodity trading can yield a novel understanding of how economic forces connected distant places all over the globe and how efforts to generate wealth from natural resources impacted on local environments.
The large-scale findings that result from the application of these new methodologies would be barely feasible using conventional research methods. Moreover, the project vividly demonstrates how the digital humanities can benefit from trans-disciplinary collaboration between humanists, computational linguists and information visualisation experts.
Important facets of this project include:
· After considerable difficulty and lengthy negotiations, we acquired significantly more historical documents than we originally expected. The full corpus exceeds 7 billion word tokens, which is very big data by humanist standards.
· Lexicon creation proved to be one of the most challenging and interesting
aspects of the project, requiring interdisciplinary skills in archival research, linked data, text mining and knowledge of the historical context.
· The project has identified almost 2,000 commodities that were regularly traded in the nineteenth century, two orders of magnitude more than are standardly
studied by historians.
· Historical sources that have undergone Optical Character Recognition (OCR) are challenging to process and this, in combination with the particular questions asked by historians, required the text mining team to develop new approaches and new text processing tools for the project.
· The geospatial nature of the data lent itself well to an interactive visualisation that displays commodities in relation to locations on a world map. The same
commodities can also be visualised on a timeline to show how trading evolved over the nineteenth century.
White Paper
·
2
Introduction
“Globalisation” has become a catchphrase for current times, demonstrating that the increasing exchange of ideas and goods is held to be a hallmark of contemporary society. Yet historians have shown that large-scale global trade, migration and exchange of ideas began long before the late twentieth century. Industrial development, such as the processes in Britain, helped accelerate global exchanges during the long nineteenth century (normally dated from the French Revolution in 1789 to the beginning of the First World War in 1914). Historian John Darwin estimates that world trade increased ten-fold between 1850 and 1913 (Darwin, 2009: 114). In this period, trade focused primarily on commodities, usually raw materials, and it occurred within the formal and informal bonds of imperial influences. The global economy expanded as European and American nations colonised frontiers rich with natural resources. Given the magnitude of demand from urbanising and industrialising core economies, the extraction of these commodities led to noticeable, sometimes dire, environmental consequences in the resource hinterlands. As a result, even in the nineteenth century, economic decisions made in financial and economic centres such as London, Paris, Berlin and New York touched the most remote regions of the globe.
Europeans reshaped the global environment as they voyaged across the oceans, moving plants and animals between ecosystems, and transporting natural resources back home. As Alfred Crosby’s classic study showed, this process started long before the nineteenth century (Crosby, 2004). The novelty of the long nineteenth century lay in the scale of activity: increased demands for a wide range of natural resources inaugurated a huge growth in the scale of the global commodity trade. In particular, new transportation technologies such as railways and steamships and the concurrent expansion of European empires intensified the pace of global trade in the second half of the nineteenth century.
Research questions relating to the implications of commodity trades were long a mainstay of Canadian economic history. Economic geographer Harold Innis, to whom the “Staple Theory” approach to Canadian history is attributed, explored the consequences of distant, external demand for Canadian primary resources, especially in the fields of the cod fishery off Newfoundland and the fur trade in the interior of the continent (Innis, 1978, 1999). In a series of short articles, Innis also examined other resources such as cheese, wheat, and minerals (Innis, 1956). Innisian approaches to Canadian economy history attracted a great deal of academic attention from the 1960s through the 1980s, but in subsequent decades, historians have shifted their focus to other features of Canadian social and cultural history.
White Paper
earlier generation of Canadian economic historians and develop these as test cases for the new digital humanities methodology. This project aimed to go far beyond the geographical borders of Canada, in examining the scope and understanding of resource trade and movement through the nineteenth-century British “world.” This involves of course the study of the formal British Empire, as well as countries with which Britain traded but did not politically subjugate. We therefore made early contacts with a cognate research group: the Commodities of Empire1 network based in London. Our goal was to make a research tool available to a range of scholars interested in global trading patterns.
This collaborative project between environmental historians in Canada and computational linguists and computer scientists in the UK used text mining software to explore over eleven million pages of historical documents related to trade in the British world during the nineteenth century. We amassed a large corpus of digitised historical documents, including the House of Commons Parliamentary Papers (ProQuest), the Early Canada Online collection (Canadiana.org), the Confidential Print Collection (Adam Matthew Digital), a metadata collection from the Kew Gardens Directors’ Correspondence project, the Asia and the West Collection: Diplomacy and Cultural Exchange (Gale) and a sub-part of the Foreign and Commonwealth Office Collection (JSTOR). The corpus is significantly larger than we had originally intended.
We used text mining – more specifically information and relation extraction as well as entity grounding – to transform unstructured text into a relational database. This digital resource will allow historians to discover new patterns and to explore new hypotheses, both through structured query and through a variety of innovative visualisation tools. We developed the interface not merely to advance our specific research interests, but also to make this tool available to a broad range of scholars. The timing of this White Paper has meant that while we will release the database publicly at the end of the grant period, the historians have had limited time to explore its functionality. Hence, the hypotheses we explore remain fairly preliminary at this stage. However, we will continue to work with these data over the coming months to pursue our research (and indeed have submitted new funding applications to allow this work to proceed). Throughout the project, we have solicited advice from potential user groups, and this iterative process has improved the functionality of the database interface.
Alongside the project’s success in adapting text mining and visualisation methods to historical research, we also demonstrated the value of interdisciplinary research in the digital humanities. While there is a lot to be gained by humanists learning to code and use advanced digital methods, the collaborative research with computational linguists and computer scientists opens up new opportunities for everyone involved. Using the techniques honed in the project, historians will gain invaluable experience in how vast amounts of data can be used to answer significant economic and environmental questions related to the past. The Canadian test case will act as a well-developed prototype that will provide a model for historians interested in other regions.
White Paper
3
Research Results
3.1 Historical Research
One of the starting points for the project was the creation of a list of commodities imported into Britain during the nineteenth century. In 2012, Jim Clifford spent several weeks in London at the National Archives, Kew Gardens Library and Archive, and the London Metropolitan Archive researching a few specific commodities (e.g. palm oil and cinchona, the tree whose bark produced anti-malarial quinine) and developing an initial list of commodities that the text mining team could use. The annual imports ledgers in the Customs records at the National Archives proved to be the most comprehensive source for this research. Over several months this list was expanded to include over four hundred commodities imported into Britain during the nineteenth century.
Early in the project, we committed to comparing traditional archives-based historical research methods to the results generated by the text mining and visualisations. To this end Clifford completed archival research on the relationship between industrial development in London, economic botany and the commodification of nature in the British World. He used this research to write a paper on the globalising supply of tallow, palm oil, coconut oil and other fats required by the expansion of London’s soap and candle industries. We quickly found that the knowledge developed through historical research helped us troubleshoot the early prototypes and allowed us to provide useful feedback to the text mining and visualisation teams in Scotland.
Further to aid in these efforts of refining the database and to help with the goals of the project, the history team hired a research assistant to compile a bibliography of scholarly works that focused on the environmental and economic effects of the nineteenth-century commodity trade. This bibliography was consulted when the database produced surprising or confusing results. We also shared this bibliography with the Commodities Histories project and allowed them to use it as the foundation of the bibliography2 on their website. By augmenting the historical research component of the project, the historians helped the computational linguists refine the database and develop a more historically minded research tool.
Although the relational database cannot replace archival research, in some cases it served as a kind of substitute. Jim Clifford’s initial visit to the archives revealed that an important ledger listing the imports of cinchona bark to London during the mid-nineteenth century had been destroyed. This ledger would likely have provided important insights into the trade of cinchona bark around the world and sparked some interesting avenues for further research. Mined from millions of pages of digitised text, however, the project’s relational database provided a great deal of information related to this commodity. By demonstrating how cinchona turned up in different places at different times, the relational database and visualisation software reflected and confirmed previous research by other scholars demonstrating the transnational connections of the trade during the nineteenth century (Philip, 1995).
White Paper
The historians have also begun work on connecting the text-mined results with a historical geographic information system. This involved developing methods to extract subsets of data and import them into ArcGIS, while at the same time developing new HGIS data from other sources, including Ordinance Survey maps and trade ledgers. Over time we plan to build the different layers into maps showing the relationship between industrial development in London and global commodity frontiers spread throughout the world. The spatial and temporal database provides a powerful analytical tool for exploring and visualising our data.
The ability to connect commodities with a fairly specific and meaningful geographical context underpins our efforts to reach historically significant conclusions related to nineteenth-century commodity flows and their environmental and economic consequences. The database was accurate at parsing commodities, dates and place names from millions of pages of text. The Edinburgh Geoparser used an extensive list of place names contained in the Geonames Gazetteer. But in some cases, Geonames was unable to accurately identify place names that do not exist or are longer are in common use. To compensate for this weakness in the Geoparser, the history team hired a research assistant to review a test sample of place name errors, and annotate the list of place names used by the database. In many cases this involved finding places that were misread during the text mining phase due to OCR file errors. Most cases, however, involved finding places that were simply not included in the Gazetteer, no longer exist on contemporary maps, or were synonyms that are no longer used for current place names. Although this exercise was only used on a sample of 150 document extracts, the efforts succeeded in revealing that text mining requires constant feedback in order to refine and hone the data used to create insightful relationships between commodities and places over time. This work identified a future research project to develop a more complete gazetteer of nineteenth-century locations and a database of nineteenth-century geographies that would allow us to correctly associate a place name with the correct geography for any particular year. As was true about many parts of the globe, the political borders of Canada and the United States changed significantly over the course of the nineteenth century.
White Paper
topic. Moreover, the visualisation interface now allows historians to download the raw data behind the results and work with these more directly.
A very important part of the project involved exploring the methodological implications of the text-mined database and visualisation tools. Progress on this aspect of the project was delayed when Jim Clifford accepted a job as an Assistant Professor in the History Department at the University of Saskatchewan beginning July 2013. The SSHRC granted an extension to allow project work to continue beyond the initial end-date of the grant. The history team has now hired a replacement for Jim, Andrew Watson, who will explore how the database and visualisation may help historians with research. Specifically, the project wants to learn how historians may use the information contained in millions of pages of documents if they employ text mining methods to extract only the data related to a specific commodity. Somewhat related, we will explore to what extent text mining can help historians identify avenues of research and identify crucial primary sources that would otherwise have remained hidden in large data collections. Although the work on the database is complete, the history team at York University and the University of Saskatchewan will continue to work with the visualisation team at the University of St. Andrews to conduct research and explore the methodological contributions of this project to the study of history.
3.2 Research related to Text Mining
White Paper
3.2.1 Effects of OCR Errors on Text Mining
Early on in the project it became clear that the quality of some of the OCRed content analysed was very low. We therefore did some analysis of the OCR word error rate for a random subset of Canadiana (25 page records). We created a manually corrected gold standard for this sub-set and determined the word error rate of the original OCR compared to the gold standard to be 0.224 (see Alex et al. 2012). We also found some systematic errors throughout the OCRed collection such as the confusion of the long ‘s’ as ‘f’ and the soft-hyphens at the end of lines splitting words into separate tokens. We devised two dictionary-based methods for correcting these problems. This improved the word error rate by 12% and our evaluation showed that both methods deal successfully with 72% of cases.
Throughout Trading Consequences we looked at many documents in the OCRed collections and found that in some of them the text quality was so bad that they were beyond post-correction. This could be, for example, as a result of poor paper and printing quality or the use of old fonts which were not easily recognisable by the OCR engine. Other reasons include the layout of the page (for example pages containing tables, multiple columns, headers and footers or notes in margins) or carelessness when scanning a page (scans at an angle or up-side-down). Given the economic history focus of this research, a great deal of relevant data was unusable because so much statistical information was expressed in tabular form. Therefore, we were unable to extract information on quantities and volumes of commodity trade, and we relied instead on more traditional archival work for obtaining these figures. For more standard textual documents, we were curious to determine whether estimating the text quality and applying a quality threshold would help to filter out documents with such a low text quality that readers would find them difficult to read and understand. We also wanted to understand how well text quality can be rated manually and how automatic scoring compares to manual rating.
White Paper
being discarded. As a result of error analysis of the text mining output, we also found that OCR errors have a negative effect on recall. This is more the case for proper nouns than for common nouns, presumably because OCR engines rely on language models or dictionaries which do not contain many proper nouns. When processing big data, it is the case that OCR errors often disappear in the volume of data. However, in cases where OCR errors lead to real world errors, text mining results can be skewed significantly (for example, time is often misrecognised as lime). More detailed results and discussion of this work are included in a paper to appear at DATeCH 2014 (Alex and Burns, 2014).
3.2.2 Lexicon Creation
The list of commodities and places, which the text mining team used to create the relational database and the visualisation team used to create the maps and timelines, was one of the most critical but also challenging and time-consuming features of the project start-up and refinement. On its surface the task appeared simple enough: compile a list of commodities and the places they are associated with. The difficulty with doing this, however, is that absolutely every commodity and basically every place in the world has a variety of designations. In order for each entity to be recognised in its proper lexicon – in relation to other names for, or varying degrees of specificity of, the same commodity/place – all three teams had to work in close collaboration to structure the text mining and visualisation components of the project. This involved a significant amount of initial work to develop and working lexicon of commodities and place names, which was then modified and refined as each new iteration of the software was tested. Early tests revealed where text mining was failing to extract important data, which were corrected by making adjustments to how the software read associations between closely related terms within an improved lexicon. In some cases the difficulties related to poorly OCR-ed documents, which brought up inaccurate relationships within the data and misplaced data in the visualisations.
3.2.2.1 Technical Description
In recent years, the dominant paradigm for NER has been supervised machine learning. However, to be effective, this requires a considerable investment of effort in manually preparing suitable training data. Since we lacked the resources to create such data, we decided instead to provide the system with a look-up list of commodity terms. While there is substantial continuity over time in the materials that are globally traded as commodities, it is difficult to work with a modern list of commodity terms as they include many things that did not exist, or were not widely traded, in the nineteenth century. There are also a relatively large number of commodities traded in the nineteenth century that are no longer used, including a range of materials for dyes and some nineteenth-century drugs. As a result, we set out to develop a new lexicon of commodities traded in the nineteenth century.
caou-White Paper
chouc. Second, we wanted to include a limited amount of hierarchical structure in order to support querying, both in the database interface and also in the visualisation process. For example, it ought be possible to group together limes, apples and oranges within a common category (or hypernym) such as Fruit. Third, we wanted the freedom to add arbitrary attributes to terms, such as noting that both nuts and whales are a source of oil.
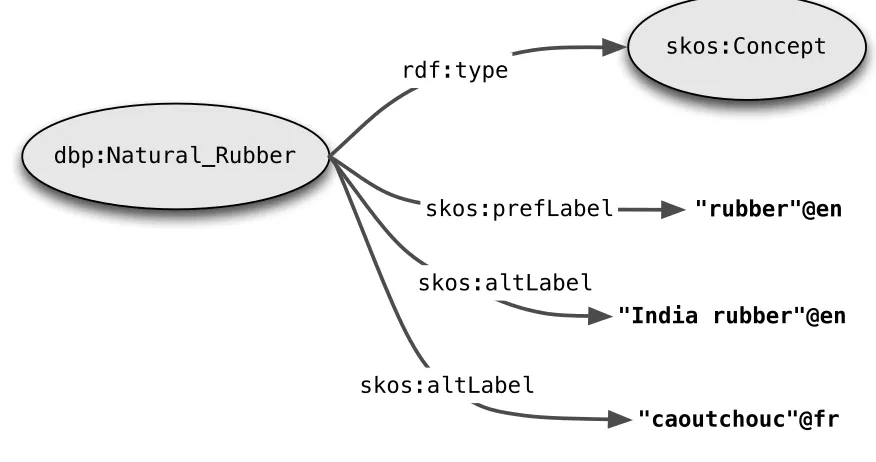
[image:12.612.84.522.424.655.2]These considerations argued in favour of a framework that had more structure than a simple list of terms, but was more like a thesaurus than a dictionary or linguistically-organised lexicon. Thus our priorities were distinct from those addressed by the lemon lexicon model (McCrae et al., 2010). This made SKOS (Simple Knowledge Organization System) an obvious choice for organising the thesaurus (Miles and Bechhofer, 2009). SKOS assumes that the ‘hierarchical backbone’ of the thesaurus is organised around concepts. These are semantic rather than linguistic entities, and serve as the hooks to which lexical labels are attached. SKOS employs the Resource Description Framework (RDF)3 as a representation language; in particular, SKOS concepts are identified by URIs. Every concept has a unique ‘preferred’ (or canonical) lexical label (expressed by the property skos:prefLabel), plus any number of alternative lexical labels (expressed by skos:altLabel). Both of these RDF properties take string literals (with an optional language tag) as values.
Figure 1 below illustrates how SKOS allows preferred and alternative lexical labels to be attached to a concept such as dbp:Natural_Rubber.
Figure 1: Preferred and Alternative Lexical Labels in SKOS.
3 http://www.w3.org/RDF/
dbp:Natural_Rubber
skos:Concept
"rubber"@en
"India rubber"@en rdf:type
skos:prefLabel
skos:altLabel
skos:altLabel
White Paper
The graph illustrates a standard shortening for URIs, where a prefix such as dbp: is an alias for the namespace http://dbpedia.org/resource/. Consequently dbp:Natural_Rubber is an abbreviation that expands to the full URI http://dbpedia.org/resource/Natural_Rubber. In an analogous way, skos: and rdf: are prefixes that represent namespaces for the SKOS and RDF vocabularies.
While a SKOS thesaurus provides a rich organisational structure for representing knowledge about our domain, it is not in itself directly usable by our toolset; a further step is required to place the prefLabel and altLabel values from the thesaurus into the XML-based lexicon structure required by LTXML tools during the named entity recognition. We will discuss this in more detail in the following section.
Next, we described how we created a seed set of commodity terms manually and used it to bootstrap a much larger commodity lexicon.
3.2.2.2 Manual Curation from Archival Sources
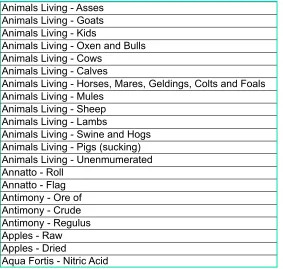
We took as our starting point the records of the Boards of Customs, Excise, and Cus- toms and Excise, and HM Revenue and Customs (CUST 5). They include a collation of annual ledger books listing all of the major goods, ranging from live animals to works of art, imported into Great Britain during any given year during the nineteenth century. These contain a wealth of material, including a list of the quantity and value of the commodities broken down by country. For the purpose of developing a list of commodities, we focused on the headings at the top of each page, drawing on the four books of the 1866 ledgers, which were the most detailed year available. All together, the 1866 ledgers listed 760 different import categories. This data was manually transferred to a spreadsheet in a manner which closely reflected the original, and a portion is illustrated in Figure 2. Since we restricted our analysis to raw materials or lightly processed commodities, we discarded all commodities which did not fit this definition. We used the selected commodities as a seed set for expanding our commodity lexicon automatically.
As can be observed, the bipartite structure of these entries conveyed by the hyphen is semantically quite heterogeneous. For example, in Animals Living - Asses, the ‘X - Y ’ pattern corresponds to ‘X is a superclass of Y ’, while in Apples - Raw, it corresponds to something like ‘X is in state Y ’. Finally, in Aqua Fortis - Nitric Acid, it seems to be indicating that the two terms are synonyms.
White Paper
much poorer coverage of relevant plants and botanical substances than DBpedia lacking for instance entries for alizarin, bergamot and Dammar gum, amongst many others.
Animals Living - Asses Animals Living - Goats Animals Living - Kids
Animals Living - Oxen and Bulls Animals Living - Cows
Animals Living - Calves
Animals Living - Horses, Mares, Geldings, Colts and Foals Animals Living - Mules
Animals Living - Sheep Animals Living - Lambs
Animals Living - Swine and Hogs Animals Living - Pigs (sucking) Animals Living - Unenmumerated Annatto - Roll
Annatto - Flag Antimony - Ore of Antimony - Crude Antimony - Regulus Apples - Raw Apples - Dried
[image:14.612.167.450.148.417.2]Aqua Fortis - Nitric Acid
Figure 2: Sample spreadsheet entries derived from 1866 Customs Ledger
White Paper
Concept prefLabel altLabel
dbp:Cork_(material) cork
dbp:Cornmeal cornmeal indian44corn4meal,4corn4meal
dbp:Cotton cotton cotton4fiber
dbp:Cotton_seed cotton4seed
dbp:Cowry cowry cowrie
dbp:Coypu coypu nutria,4river4rat
dbp:Cranberry cranberry
dbp:Croton_cascarilla croton4cascarilla cascarilla dbp:Croton_oil croton4oil
dbp:Cubeb cubeb cubib,4Java4pepper
dbp:Culm culm
dbp:Dammar_gum dammar4gum gum4dammar
dbp:Deer deer
dbp:Dipsacus dipsacus 4teasel
dbp:Domestic_sheep domestic4sheep
dbp:Donkey donkey ass
[image:15.612.91.525.96.370.2]dbp:Dracaena_cinnabari dracaena4cinnabari sanguis4draconis,4gum4dragon's4blood
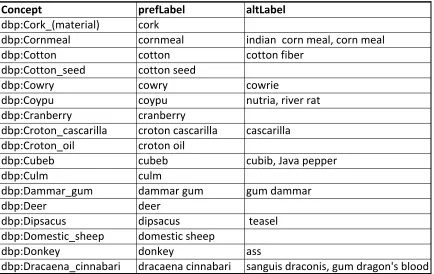
Figure 3: Customs Ledger data converted to SKOS data types.
Note that asses has been normalised to a singular form and that it occurs as an altLabel for the concept dbp:Donkey. This data (in the form of a CSV file) provides enough information to build a rudimentary SKOS thesaurus whose root concept is tc:Commodity. The following listing illustrates a portion of the thesaurus for donkey.
dbp:Donkey
a skos:Concept ;
skos:prefLabel "donkey"@en ; skos:altLabel "ass"@en ; skos:broader tc:Commodity ;
prov:hadPrimarySource"customs records 1866" .
In English: dbp:Donkey is a skos:Concept, its preferred label is "donkey", its alternative label is "ass", it has a broader concept tc:Commodity, and the primary source of this information (i.e., its provenance) are the customs records of 1866. Once we have an RDF serialisation of the thesaurus, it becomes straightforward to carry out most subsequent processing via query, construct and update operations in SPARQL (Seaborne and Harris, 2013).
3.2.2.3 Bootstrapping the Lexicon
White Paper
us poor recall in identifying commodity mentions. Many kinds of product in the Customs Ledgers included open ended subsections (i.e., Oil - Seed Unenumerated or Fruit - Unenumerated Dried). Similarly, while the ledgers provided a comprehensive list of various gums, they only specified anchovies, cod, eels, herring, salmon and turtles as types of “fish,” grouping all other species under the ‘unenumerated’ subcategory.
One approach to augmenting the thesaurus would be to integrate it with a more general purpose SKOS upper ontology. In principle, this should be feasible, since merging two RDF graphs is a standard operation. However, trying this approach with UMBEL4 threw
up several practical problems. First, UMBEL includes features that go beyond the standard framework of SKOS and which made graph merging harder to control. Second, this technique made it extremely difficult to avoid adding a large amount of information that was irrelevant to the domain of nineteenth century commodities.
Our second approach also involved graph merging, but tried to minimize manual intervention in determining which subparts of the general ontology to merge into. We have already mentioned that one of our original motivations for adopting SKOS was the presence of a concept hierarchy. In addition to a class hierarchy of the usual kind, DBpedia contains a level of category, derived from the categories that are used to tag Wikipedia pages. The screenshot below illustrates categories, such as Domesticated animal, that occur on the page for donkey.
We believe that such Wikipedia categories provide a useful and (for our purposes) sufficient level of abstraction for grouping together the ‘leaf’ concepts that correspond to lexical items in the SKOS thesaurus (e.g., a concept like dbp:Donkey). Within DBpedia, these categories are contained in the namespace
http://dbpedia.org/resource/Category: and are related to concepts via the property dcterms:subject. Given that the concepts in our base SKOS thesaurus are drawn from DBpedia, it is simple to augment the initial SKOS thesaurus G in the following way: for each leaf concept L in G, merge G with a new graph G′ containing edges of the form L dcterms:subject C whenever L belongs to category C in
DBpedia. We can retrieve all of the categories associated with each leaf concept by
White Paper
sending a federated query that accesses both the DBpedia SPARQL endpoint and a local instance of the Jena Fuseki server5 which hosts our SKOS thesaurus.
Since some of the categories recovered in this way were clearly too broad or out of scope, we manually filtered the list down to a set of 355 before merging the graph G′ into the base thesaurus. To illustrate, the addition of the category dbc:Domesticated_animal to our previous example of SKOS triples yields the following output.
dbp:Donkey
a skos:Concept ;
skos:prefLabel "donkey"@en ; skos:altLabel "ass"@en ; skos:broader tc:Commodity ,
dbc:Domesticated_animal ; prov:hadPrimarySource
"customs records 1866" .
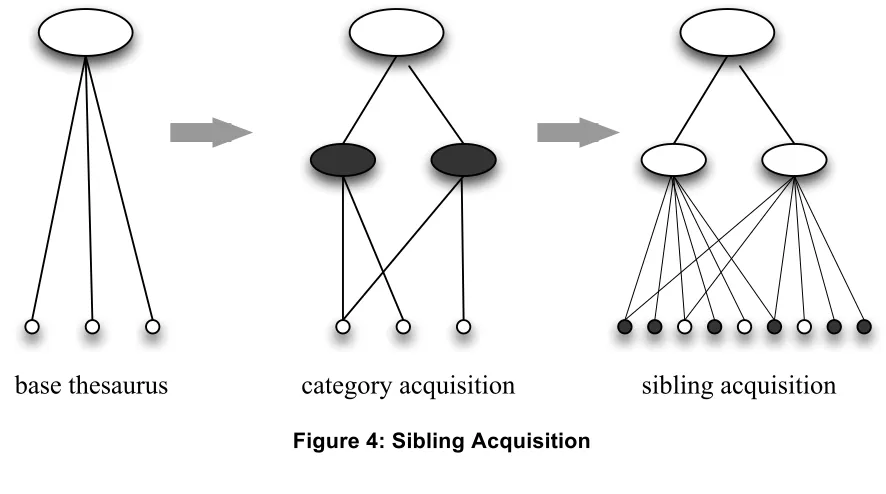
Our next step also involved querying DBpedia, this time to retrieve all new concepts C
which belonged to the categories recovered in the first step; we call this sibling acquisition, since it allows us to find siblings of leaf concepts that are already children of the Wikipedia categories already present in the thesaurus. The key steps in the procedure are illustrated in Figure 4 (where the top node is the root concept in the SKOS thesaurus, viz. tc:Commodity).
[image:17.612.85.528.435.682.2]base thesaurus category acquisition sibling acquisition
Figure 4: Sibling Acquisition
White Paper
Given a base thesaurus with 319 concepts, sibling acquisition expands the thesaurus to a size of 17,387 concepts. We accessed DBpedia via the SPARQL endpoint on 16 Dec 2013, which corresponds to DBpedia version 3.9.
We mentioned earlier that in order to identify commodity mentions in text, we had to convert our SKOS thesaurus into an XML-based lexicon structure. This is illustrated in the XML shown below.
<lex> ...
<lex category="Rubber|Nonwoven_fabrics" concept="Natural_rubber" word="caoutchouc"/> <lex category="Rubber|Nonwoven_fabrics" concept="Natural_rubber" word="indian rubber"/> <lex category="Rubber|Nonwoven_fabrics" concept="Natural_rubber" word="rubber"/> ...
</lex>
The preferred and alternative lexical labels are stored as separate entries in the lexicon, with their value contained in the word attribute for each entry. The concept and category information is stored in corresponding attribute values; the pipe symbol (|) is used to separate multiple categories. We have already seen that alternative lexical labels will include synonyms and spelling variants (chinchona versus cinchona). The set of alternative labels associated with each concept was further augmented by a series of post-processing steps such as pluralisation, hyphenation and dehyphenation (cocoanuts versus cocoa-nuts versus cocoa nuts, and the addition of selected head nouns to form compounds (apple > apple tree, groundnut > groundnut oil); these are also stored in the lexicon as separate entries. The resulting lexicon contained 20,476 commodity terms.
During the recognition step, we perform case-insensitive matching against the lexicon in combination with context rules to decide whether or not a given string is a commodity. The longest match is preferred during lookup. The linguistic pre-processing is important in this step. For example, we exclude word tokens tagged as verb, preposition, particle or adverb in the part-of-speech tagging. As each lexicon entry is associated with a DBpedia concept and at least one category, both types of information are added to the extracted entity mentions for each successful match, thereby linking the text-mined commodities to the hierarchy present in our commodity thesaurus.
3.2.3Text Mining
White Paper
historians. They manually extracted a list of several hundred raw materials or lightly processed commodities from customs ledgers stored at the National Archives (collection CUST 5), ranging from resources and related staples imported into Great Britain during the nineteenth century. The locations were recognised and geo-referenced using an adapted version of the Edinburgh Geoparser (Grover, 2010).
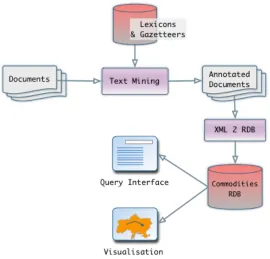
This prototype was integrated into an end-to-end system by month 12. The system architecture is visualised in Figure 5. Input documents are processed by the text mining component, and its output is stored in a relational database. This database is the back-end to two user interfaces.
[image:19.612.120.390.262.521.2]
Figure 5: Trading Consequences System Architecture.
White Paper
Figure 6: Processing steps of the text mining component
The text mining component takes documents from a number of different collections in different formats as input, and is the first processing step in the Trading Consequences system. Firstly, each collection is converted to a consistent in-house XML format which is used for running the text mining component. In some cases, original document pages are stored individually and therefore pooled into one file per document. Depending on the collection, a language identification step may be performed to ensure that the current document is in English.
The project’s underlying text mining tools are built on the LT-XML26 and LT-TTT27 tools.
While they are robust and achieve state-of-the-art results for modern digital newspaper text, their output for historical text will necessarily involve errors. Apart from OCR imperfections, the data is not continuous running text but passages interspersed with page breaks, page numbers, headers and occasionally hand-written notations in page margins. In order for our text mining tools to extract the maximum amount of information, we are carrying out automatic correction of the text as a preliminary processing step in our TM pipeline. We perform two automatic OCR post-processing steps, the first being the deletion of end-of-line soft hyphens splitting word tokens and the second being the correction of the “long s”-to-f confusion.
The main processing of the text mining component involves various types of shallow linguistic analysis of the text, lexicon and gazetteer lookup, named entity recognition and geo-grounding, and relation extraction. After performing the necessary pre-processing including tokenisation, sentence boundary detection, part-of-speech tagging and lemmatisation, various types of named entities (including commodity, location,
White Paper
organisation and person names), temporal information, amounts and units are extracted and grounded.
We use an existing rule-based named entity recognition system which has been developed inhouse over a number of years and adapted to different types of text. It was last used in the SYNC3 project (Sarris et al. 2011) and includes the Edinburgh Geoparser which extracts location names and grounds them to the GeoNames8 gazetteer. It has also been applied in the GeoDigRef and Embedding GeoCrossWalk projects to identify named entities in eighteenth century parliamentary papers and enable more sophisticated indexing and search (see Grover et al., 2008 and Grover et al., 2010). We also determine date attributes for commodity entities and direction attributes (destination, origin or transit) for location entities, if available. In the case of the former, we choose date entities in close textual proximity of a commodity mention as the attribute value. If none are available, we assign the year of the document’s publication date as the date attribute value. The direction attributes are assigned on the basis of prepositions that signal direction occurring in front of locations, e.g. to, from, in
etc. We also identify vocabulary referring to animal diseases and natural disasters in the text by means of two small gazetteers which we compiled manually. They contain entries like scabies, Rinderpest and ticks as well as drought, flood and tsunami, respectively.
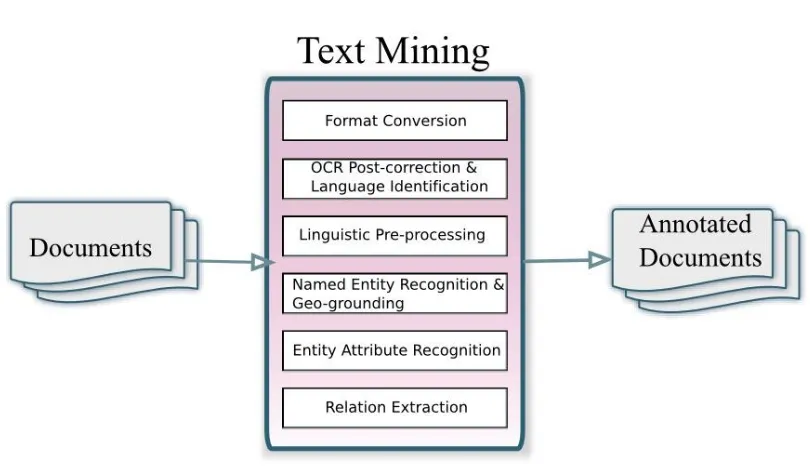
Once the various entity mentions are recognised, a relation extraction step is performed where we determine which commodities are related to which locations. In the first prototype, we applied the simple baseline that a relation holds between a commodity and a location occurring in the same sentence. We decided against using syntactic parsing to identify such relations as we expected the OCRed text to be too noisy, resulting in too many failed parses. In summary, we determine which commodities were traded when and in relation to which locations. We also determine whether locations are mentioned as points of origin, transit or destination, reflecting trade movements to and from certain locations and whether vocabulary relating to diseases and disasters appears in the text. All these pieces of information are added back into the XML document as different layers of annotation. This allows us to visualise documents for the purpose of error analysis. Figure 7 shows some of the entities we extract from the text, e.g. the locations Pandang and America, the year 1871, the commodity cassia bark and the quantity and unit 6,127 piculs. The text mining component further extracts that Pandang is an origin location and America is a destination location and geo-grounds both locations to latitudes and longitudes, information not visible in this figure. The commodity-location relations cassia bark-Pandang and cassia bark-America, visualised by the red arrow.
White Paper
Figure 7: Excerpt from "Spices" (Ridley, 1912). The text mined information is highlighted in colour and relations are visualised using arrows.
Examples of what this extracted and enriched information looks like in our in-house XML format are listed below:
<ents>
…
<ent id="rb5370" type="location" lat="-0.9492400" long="100.3542700" in-country="ID" gazref="geonames:1633419" feat-type="ppla" pop-size="840352" direction="origin">
<parts>
<part sw="w446944" ew="w446944">Padang</part> </parts>
</ent>
<ent id="rb5371" year="1871" type="date"> <parts>
<part sw="w446968" ew="w446968">1871</part> </parts>
</ent>
…
<ent id="rb5373" type="commodity" dates="1871"> <parts>
<part sw="w446990" ew="w446997">cassia bark</part> </parts>
</ent>
…
</ents> <relations> …
<relation type="com-loc" id="r591">
<argument ref="rb5373" text="cassia bark"/> <argument ref="rb5370" text="Padang"/> </relation>
…
</relations>
White Paper
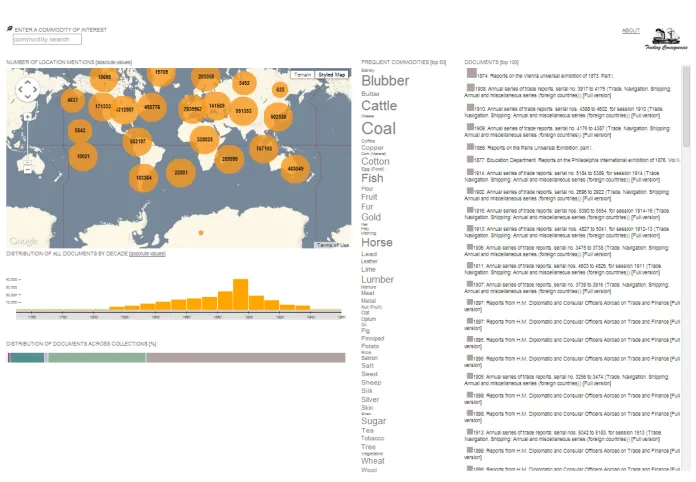
Figure 8: Trading Consequences query interface.
The first TC prototype included a query interface developed by EDINA (Figure 8). Further visualisation interfaces were created for prototype 2 and 3 (see Section 2.3).
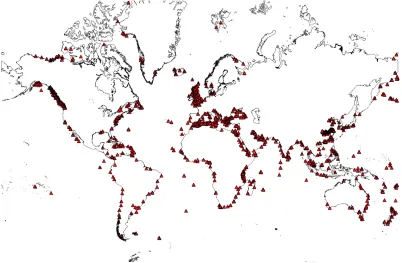
The initial query interface allowed users to search the TC database for commodities and/or related locations and displayed information on a heat map. This system was used for the first user evaluation which resulted in extremely useful feedback to improve the text mining. As a result we adapted our tools, extracted new types of information and improved the accuracy of existing output. For example, the historians noted early on that locations which are and were ports would be of more importance with respect to trade. We therefore adapted the Edinburgh Geoparser to give a higher ranking to locations which coincide with an entry in a geo-referenced list of ports which we aggregated from different sources as part of the project (Figure 9).9 The information presented via the query interface also showed examples of country names being wrongly geo-referenced to smaller locations (e.g. Jamaica was located in Queens, New
White Paper
[image:24.612.104.506.224.487.2]York). We therefore increased the weight of countries when ranking ambiguous locations. Our users also found that person names in text are sometimes confused with location names (e.g. Markham the botanist versus Markham in Ontario or Victoria (the Queen) versus Victoria (B.C.)). We therefore added a person name recognition step into our text mining pipeline as that helped us to disambiguate such cases. We also used the second version of the bootstrapped commodity lexicon containing over 21,000 entries for identifying commodities in text. All of these changes were applied in the second text mining prototype for which we created a full round of processing of all collections in July 2013.
Figure 9: Map of Ports Data Provided by the Old Weather Project.
White Paper
History using the brat annotation tool10 for which we developed a tutorial with very detailed annotation guidelines (see Section 3.2). This resulted in a manually annotated gold standard of 150 document excerpts. We also asked an MSc in economics student to mark up a sub-part of this data in order to determine inter-annotator agreement. The creation of the gold standard was completed by month 18 of the project. We then asked the first annotator to geo-reference all of the locations names (which he had manually annotated in the gold standard in the first annotation phase) to Geonames locations. This second level of annotation allowed us to evaluate the geo-resolution part of the text mining independently. We also created detailed annotation guidelines for this annotation task (see Section 3.2).
We spent the remaining 6 months of the project improving the text mining component as result of extensive error analysis on the output of the second prototype. This analysis was done jointly with the historians. We created sorted counts of extracted commodity mentions (and concepts), so that we could easily determine errors in the most frequently appearing terms. We also created most frequently occurring bigrams for a set of terms like “import,” “export,” “plantation,” etc. in order to identify commodities that were still missing from the lexicon. Finally, we asked the historians to check several ambiguous commodities like (“ice” or “lime”) in context in order to determine their use. A journal article on the results of the commodity extraction and how we improved this by cleaning the commodity lexicon and adding context-dependent boundary extension rules is currently in progress. We also submitted a journal article on the Edinburgh Geoparser in which we describe how we adapted it for Trading Consequences for a special edition in the International Journal for Humanities and Arts Computing which will appear later in 2014 (Alex et al., 2014). In summary we made following findings:
· the text mining output for the most frequent commodities is not 100% accurate but generally of good quality.
· named entity recognition performance suffers significantly in terms of precision and recall as a result of boundary errors, which is the main reason why applying boundary extension rules were effective.
· named entity recognition performance also suffers significantly in terms of recall as a result of OCR errors in the digitised text. This effect is worse for proper nouns than for common nouns.
· the Edinburgh Geoparser performs best when the number of ambiguous locations returned by GeoNames is set to 15.
· adapting the Geoparser to a particular domain can improve its performance.
Overall, we found the historians’ input and feedback to be vital for improving the performance of the text-mining component. We integrated all changes into the third
White Paper
prototype, most importantly the cleaned commodity lexicon, and performed a last full round of processing for all collections in month 24 of the project. This output is stored in the final Trading Consequences database which is at the back-end of the user interfaces that will be launched in parallel with the publication of this white paper.
3.3 Visualisation Research
When considering questions of large-scale global trade, migration or the exchange of ideas the amount of data available from historical document collections makes the analysis task difficult. It is becoming increasingly apparent that more powerful information exploration tools are required as the amount and complexity of data that these tools are expected to handle steadily increases. One approach to this problem is to convert aspects of the documents (i.e. the data or meta-data) into pictures and models that can be graphically displayed. The intuition behind the use of such graphics is that human beings are inherently skilled at understanding data in visual forms. Such interactive graphical displays or visualisations provide access to both the data and the mined data from the earlier stages of the trading consequences project.
Our goal here with visualisation is to graphically represent large amounts of abstract information on screen, which a user can interpret in ways not possible from the raw data alone. While our visualisations are primarily targeted toward environmental historians, they can also make the document collection available to a larger audience. These audiences can hence explore and study the data from a range of perspectives with different intents and interests.
We have developed a number of visualisation prototypes that expose different aspects of the mined data. All these prototypes have been developed in close collaboration with the text mining and history teams. In addition, we conducted a preliminary evaluation with a larger group of Environmental Historians as part of a workshop in Canada. In the following sections we describe the general goals and challenges we aimed at addressing with the visualisation tools. This is followed by a description of each visualisation prototype and a brief summary of our achievements and future research directions.
3.3.1 General Challenges and Goals
White Paper
Within the scope of this project, we aimed at developing visualisations that would largely fulfil two main purposes:
Document Seeking: Based on the extracted data, the visualisations should provide overviews of certain themes or relations within the data to facilitate the discovery of original documents to be studied in more detail.
Analytical Tools: The visualisation should facilitate an in-depth analysis of general themes of areas of interest within the document collection to (a) enable new discoveries (e.g., a change in discussion of a certain commodity over time) and to (b) support the verification of previous hypotheses and assumptions.
In order to develop suitable and accessible visualisation tools fit for purpose, it was important for us to identify the research questions that our target audience (environmental historians) was interested in and the approaches that they typically apply as part of their research. In collaboration with the history team, we identified three high-level design goals for our visualisation tools (1) enabling open-ended explorations, (2) providing multiple entry points into the data collection, and (3) enabling high-level overviews alongside direct document access. We describe each of these high-level design goals in detail.
3.3.1.1 Enabling Open-Ended Explorations
Historians often do not have clearly defined questions in mind when they start their research on a certain topic. In fact, their research questions often form and develop as part of their exploration of the available historic documents. Oftentimes, extensive sifting through the collections is necessary to allow the forming of more focused research questions; getting to know the collection and the (potentially) available information is an important first step in history research.
White Paper
2012). Translating this design goal into system design cuts across each of the visualisations and results in generous overview features as a starting point.
3.3.1.2 Providing Multiple Entry Points into the Data Collection
Environmental history is a vast field and, obviously, different researchers focus on different topics and may have different approaches towards the exploration of document collections. For example, some historians may focus on specific locations (e.g. Vancouver Island) and their relationships to a variety of commodities. Other researchers will have a broader geographic area of interest (e.g. a particular continent or country) and focus on a very particular commodity and time period.
The data collection that resulted from the text mining procedure is multifaceted where a facet is one perspective from which the data can be probed (Collins, 2009). These facets include, for example, commodities and geographic locations mentioned in the documents, the publication year of a document, the collection the document is part of, and other terms mentioned in relation to particular commodities and/or locations.
We aimed at developing visualisations that can provide multiple entry points into the data collection, e.g. from a commodity-centred point of view, or following a geographically-centred approach, while providing a glimpse into other perspectives that the data set can be explored from. Figures 10 and 11 show our early stage sketches of how this approach was taken.
White Paper
Figure 11: Early sketch juxtaposing geographic locations, commodities, related terms and temporal changes in three interlinked visualisations.
3.3.1.3 Enable High-Level Overviews while Providing Direct Access to Documents
Our visualisation prototypes aim to create visual abstractions from text in order to enable high-level overviews of a vast number of textual documents. To achieve this, we have extracted key terms from the textual documents in the text mining process as described earlier. This abstraction can potentially provide new, quite analytical, perspectives on historic documents that traditional close-reading approaches cannot. However, we do not aim at exchanging the close-reading approach with this distant-reading abstraction approach. Ultimately, our visualisations can only provide a glimpse of the data we mined from the documents; they cannot replace the study of the rich historic documents. We therefore aimed for providing high-level, abstract visual overviews of the mined data (considering its different facets as described above), but linking these overviews directly to the actual historic documents, so the connection between abstracted data and the actual information source is there at all times.
3.3.2 Exploration 1: Juxtaposing Geospatial, Temporal, and Contextual Dimensions
Following the idea of presenting the data sets along multiple facets, most importantly commodities, geospatial references, and temporal dimensions, we created an interlinked visualisation that would allow the exploration of the document collections along these lines.
White Paper
Figure 12: Interlinked visualisation of commodity mentions, geospatial references and temporal dimensions.
[image:30.612.127.479.365.606.2]White Paper
Figure 14: Selecting particular decades further refines the location mentions shown in the map as well as the list of commodities. Both filtering operations
refine the document list to the right.
White Paper
Figure 15: Specifying a commodities brings up a line chart of mentions of this commodity across the years. Also, the other visualisations are updated, reflecting on the
selected commodity.
To gain expert feedback on this first approach of representing different facets of the data set in an interlinked form to facilitate research in history, we conducted a half-day workshop where we introduced our visualisation prototype to environmental historians. The workshop was part of CHESS, the yearly Canadian History & Environment Summer School with over 20 environmental historians participating.11
White Paper
Figure 16: Presenting the first visualisation prototype to a group of environmental historians.
At the workshop, we first introduced the visualisations and then asked historians to explore these in small groups (Figure 16). These explorations were guided by a number of open-ended tasks, such as querying for particular commodities or focusing on a location of interest. These mini-tasks were meant to promote engagement with the visualisation components and to fuel discussions. Between tasks we discussed insights gained from the visualisation and comments on the functionality of the visualisation tool.
In the following we describe exploration strategies that historians applied with the visualisations, as well as comments that came up, and reflect on the general discussions regarding this new approach to facilitate historical research.
Building Trust: Verifying Content Shown in the Visualisations: As part of their exploration, some historians immediately started to focus on the Vancouver Island area where the workshop took place and that earlier presentations had focused on. Others experimented with commodities and locations related to their own research. In general, these first exploration periods were about verifying familiar facts, to assess the capabilities of the visualisation and the trustworthiness of the underlying data.
Visualisation Design & Functionality: The historians quickly understood the general purpose and high-level functionality of the visualisations and were able to start their explorations right away.
White Paper
Insights Gathered from the Visualisations: Workshop participants found meta-level overviews that the visualisations provide highly valuable as these can aggregate information about the collection beyond human capacity. In the short time of the workshop, historians made (sometimes surprising) discoveries that sparked their interest to conduct further research. While it is unclear if these discoveries withstand more detailed investigation (there is still some noise in the data set), this shows that visualisation has the potential to support exploration and insight construction in the context of historical research.
A large aspect of the discussions focused on what kind of insights can be gathered from the visualisations. Some historians pointed out the visualisations really represent the rhetoric around commodity trading in the 19th century: they show where and when a dialogue about particular commodities took place, rather than providing information about the occurrence of commodities in certain locations. This raises the question of how we can clarify what kind of data the visualisations are based on to avoid misinterpretation.
In general, we received positive feedback about our approach of combining text mining and visualisation to help research processes in environmental history. Historians saw the largest potential in the amounts of data that can be considered for research but also in the open-ended character of the explorations that the visualisations support in contrast to common database search interfaces. Similar approaches of interlinked visualisation tools have been proposed earlier (e.g. Dörk, 2008), but never been applied and evaluated in the context of vast document collections to facilitate research in the humanities. The addition of other types of visualisations was suggested to can help analyse and discover relations and patterns in the data. The suggestion mirrored ideas by the history team, who suggested we develop visualisations that could provide a more analytical perspective on the data set. Following up on this, we developed a number of visualisation prototypes that specifically highlight the relations between different commodity entities as well as the flow of location mentions over time for selected commodities, as we describe in the following sections.
3.3.3 Exploration 2: Showing Relations Between Different Commodities
The Commodity Arcs visualisation prototype is a brief exploration of how we could represent relations between selected commodities, i.e., what other commodities are mentioned in relation to a selected commodity. While “relatedness” could be defined in different ways, we chose to count two commodities as related if they are mentioned on the same document page.
White Paper
Figure 17: Scrollable list of commodities. The sizes of circles represent the frequency of mentions of a commodity within the entire document collection.
A commodity of interest can be selected in two different ways: historians can scroll through the list and click on the text label or corresponding circle, or they can just type in a commodity name into the text field to the upper left (Figure 17). Specifying a commodity in this way, results in the appearance of arcs connecting the selected commodity with other commodities that are mentioned on the same document pages (Figure 18). Related commodities are highlighted in orange, while unrelated ones remain grey. The strength (thickness) of the arcs represents the strength of relation between two connected commodities: the more pages exist where a pair of commodities is mentioned together, the stronger the corresponding arc between these commodities.
White Paper
Figure 18: Selecting or querying for a particular commodity, brings up arcs that connect the selected commodities with related ones.
Because of the large number commodities and their list-based alignment, it is not possible to see all related commodities in one view. However, it is possible to scroll through the list to explore related commodities – the arcs toward the selected commodity are cut off but still reveal the strength of relation (Figure 19).
Figure 19: Scrolling through the list of related commodities: cut-off arcs still reveal the strength of relation to the selected commodity.
White Paper
document (pages) that include related commodity terms, as well as an analysis of connections between related commodities across time.
Since the development of this first prototype, the underlying list of commodities has expanded from approx. 1000 to 5000. Future research will include refining the initial representation of commodities, since navigating a list of 5000 terms is not feasible. As part of this, we may show a list of DBpedia concepts first that will reveal connected commodities and their relations to other commodity terms upon request. The query functionality will remain in place to enable targeted search for commodity terms.
3.3.4 Exploration 3: Mapping Location Mentions across Time
[image:37.612.76.540.376.635.2]As mentioned in Section 2.3.1, the workshop with environmental historians on Vancouver Island revealed that, while the representation of location mentions on a world map nicely highlights their geospatial distribution, it can cause some confusion about the meaning of this mapping. While visualisation reflects on the rhetoric of commodity trading, the geospatial mapping may suggest that certain commodities have either come from the highlighted areas or are shipped there. We, therefore, explored another approach to visualise how for a selected commodity location mentions change over time within our document collections, focusing more on text-based representation techniques.
White Paper
We call the resulting visualisation prototype the Location Cloud that shows all the location mentions and frequencies for a selected commodity over time (Figure 20). Loading the visualisation first brings up a text field where a commodity can be specified (Figure 21).
Figure 21: Text field to specify a commodity of interest.
Once a commodity term is entered, all location data for this particular commodity is loaded and represented from three different perspectives. The main part of the interface consists of columns of location terms listed in alphabetical order and grouped by decade (Figure 20). The Location Cloud borrows from previous text visualisation approaches such as Parallel Tag Clouds (Collins, 2009; Viégas, 2006). The font size of each location mention is represents the frequency in which it is mentioned. In this way, frequent location mentions are highlighted. In the example as shown in Figure 20, we quickly see that places in India including the country itself are often associated with the commodity cinchona in the 1870s and 80s. Alphabetical ordering of the location mentions makes it easy to find particular locations of interest in the lists.
One limitation of representing location mentions in this way is that overlapping location labels cannot be avoided for commodities associated with large amounts of location mentions. Figure 22 shows this heavy overlap when showing all location mentions associated with the commodity “Blubber” (the most frequently mentioned commodity after the 2nd text mining pass). In this representation general trends cannot be deciphered and interaction is not possible. We address this problem in different ways.
Limiting the View to Top 50 Location Mentions
We limit the number of location mentions shown in each decade to the top most frequent location mentions which reduces clutter (see Figure 23). While not all location mentions are shown in this overview, a location query text field in the upper left corner of the interface allows for searching for particular locations of interest. In future iterations, we also plan to implement a “show all” functionality that allows scrolling through the entire list of location mentions in each decade.
Limiting the View to “Mentioned” Decades
White Paper
Figure 22: Mapping all location mentions associated with the frequently mentioned commodity "Blubber" leads to heavy overlapping problems with location labels.
[image:39.612.77.528.418.679.2]