This is an
Accepted Manuscript
, which has been through the
Royal Society of Chemistry peer review process and has been
accepted for publication.
Accepted Manuscripts
are published online shortly after
acceptance, before technical editing, formatting and proof reading.
Using this free service, authors can make their results available
to the community, in citable form, before we publish the edited
article. We will replace this
Accepted Manuscript
with the edited
and formatted
Advance Article
as soon as it is available.
You can find more information about
Accepted Manuscripts
in the
Information for Authors.
Please note that technical editing may introduce minor changes
to the text and/or graphics, which may alter content. The journal’s
standard Terms & Conditions and the Ethical guidelines still
apply. In no event shall the Royal Society of Chemistry be held
responsible for any errors or omissions in this
Accepted Manuscript
or any consequences arising from the use of any information it
contains.
Accepted Manuscript
Journal of
Materials Chemistry A
This article can be cited before page numbers have been issued, to do this please use: L. Lu, C. Ni, M.
Journal of Materials Chemistry A
ARTICLE
Received 00th January 20xx,
Accepted 00th January 20xx
DOI: 10.1039/x0xx00000x
www.rsc.org/
Demonstration of high performance in a perovskite oxide
supported solid oxide fuel cell based on La and Ca co-doped
SrTiO
3Lanying Lu
†, Chengsheng Ni
†, Mark Cassidy and John T. S. Irvine*
Perovskite electrodes have been considered as an alternative to Ni-YSZ cermet-based anodes as they afford better
tolerance towards coking and impurities and due to redox stability can allow very high levels of fuel utilisation.
Unfortunately performance levels have rarely been sufficient, especially for a second generation anode supported
concept. A-site deficient lanthanum and calcium co-doped SrTiO3, La0.2Sr0.25Ca0.45TiO3 (LSCTA-) shows promising thermal, mechanical and electrical properties and has been investigated in this study as a potential anode support material for
SOFCs. Flat multilayer ceramics cells were fabricated by aqueous tape casting and co-sintering, comprising a 450-µm thick porous LSCTA- scaffold support, a dense YSZ electrolyte and a thin layer of La0.8Sr0.2CoO3-δ (LSC)-La0.8Sr0.2FeO3-δ ( LSF)-YSZ cathode. Impregnation of a small content of Ni significantly enhanced fuel cell performance over naked LSCTA-. Use of ceria as a co-catalyst was found to improve the microstructure and stability of impregnated Ni and this in combination
with the catalytic enhancement from ceria significantly improved performance over Ni impregnation alone. With addition
of CeO2 and Ni to a titanate scaffold anode that had been pre-reduced at 1000 o
C, a maximum powder density of 0.96Wcm -2
can be achieved at 800oC using humidified hydrogen as fuel. The encouraging results show that an oxide anode material, LSCTA- can be used as anode support with YSZ electrolyte heralding a new option for SOFC development.
Introduction
Solid oxide fuel cells (SOFCs) have attracted much attention as the most efficient electrochemical devices that can directly convert chemical energy to usable electrical energy. The state-of-the-art anode material is the Ni-YSZ cermet where YSZ phase offers an oxygen ionic conductivity and Ni phases provides both electronic conductivity and catalytic activity for hydrogen oxidation1,2.However, Ni-YSZ anodes were found to exhibit serious degradation especially when exposed in hydrocarbon fuel in terms of carbon deposition3 and sulphur poisoning4, nickel sintering5 and redox instability. Therefore, the search for an alternative ceramic-based anode material is increasing.
Of the available perovskites being considered as a candidate for anode material, donor doped strontium titanate would be one of most interest owing to its high electronic conductivity and excellent thermal stability6~9. The desirable defects can be tailored by substitution of Sr2+ with La3+ and introduction of A-site vacancies, which are created to compensate the excess positive charges in oxidizing atmosphere. Upon reduction, a higher conductivity could be achieved in an A-site deficient sample than in of the stoichiometric counterparts10. For
example, A-site deficient La-doped SrTiO3 (LST) at 1400oC has shown conductivities as high as 100S/cm at 800oC in 4% H2/Ar11. In order to incorporate LST as the anode for an SOFC, the electrolyte-supported configuration was employed for the simplicity in processing: a porous anode layer was applied using screen printing12 , 13 or spin coating14 onto a thick electrolyte support. However, electrolyte-supported SOFCs that utilise zirconia-based electrolytes are typically operated in the temperature range between 800 and 1000oC to obtain decent ionic conductivity from thick YSZ electrolyte (200µm above). YSZ electrolytes of these thickness will cause intolerable ohmic loss (e.g. ~1Ωcm2 at 700oC) at intermediate temperatures in the range of 600-800oC. To operate at these temperatures a fuel cell with a thin film of electrolyte on an anode support is a preferred approach. This minimises ohmic losses across the electrolyte membrane while reduced operational temperatures impart flexibility in choice of metallic interconnect and an improved stability and durability15. Tape casting is a scalable technique, which can produce thinner electrolyte membranes supported on skeletal electrodes using a casting technique with a single-step co-sintering process, so is a promising design concerning the increase of productivity and the decrease of fabrication cost. However, any mismatch in shrinkage rate/amount between electrode and electrolyte during co-sintering could cause the problems of cracks, warping and exfoliation16,17. Le et al. have successfully demonstrated the sintering of YSZ on a dense NiO-YSZ support16, but the fabrication of a dense electrolyte on a
Journal
of
Materials
Chemistry
A
Accepted
Manuscript
Published on 28 June 2016. Downloaded by University of St Andrews Library on 05/07/2016 09:23:57.
porous ceramic support is more prone to be faulty18. A matched sintering process between the electrolyte and anode support was found to be the key factor in making a high-performance ceramic fuel cell19 , 20 , achieved by the optimization of particle size distribution of LSCTA- in this study.
From the point of view of environment, safety and economy, aqueous tape casting has been gradually developed in industry at the expense of their solvent-based counterparts. However, it is difficult to obtain a quality set of green tapes for full ceramic fuel cells with a thin gastight electrolyte because of the slow drying rate of the tape, high crack sensitivity and poor wetting of the slip due to the high surface tension of water21,22. Here crack-free full ceramic fuel cells with anode support were fabricated for the first time using aqueous tape casting technique by adjusting the slurry formula and sintering profiles.
Although A-site deficient LST offers multiple advantages, including a high mechanical and chemical stability, a close thermal expansion coefficient with YSZ electrolyte, and low tendency to react with zirconia electrolytes forming SrZrO36,23
during the high temperature co-sintering process, it possesses insufficient ionic conductivity and low catalytic activity for oxidation reactions. Therefore, it is necessary to incorporate a small amount of metal catalyst, as well as ionic conductor such as ceria in the robust ceramic scaffold, in order to reduce polarization losses. Ionic impregnation into and electronically conducting scaffold has been suggested as a key means of engineering the architecture and interface of solid state electrode for better electrochemical performance 24 . Remarkable performance has been reported using A-site deficient titanate-based anodes infiltrated with nickel, copper or ruthenium with additional ceria phase2529; for example, with Cu and GDC-impregnated La0.2Sr0.7TiO3-δ, a maximum power
density of 540mWcm-2 was achieved at 750oC for the cells when humidified hydrogen was used as fuel despite a suitable pre-reduction process was necessary for optimized electronic conductivity and improved anode performance30.
In the present study, an A-site deficient lanthanum- and calcium- co-doped strontium titanate La0.2Sr0.25Ca0.45TiO3
(LSCTA-) exhibiting sufficient electronic conductivity in hydrogen environments and excellent redox stability29,31,32 was used as an anode support for solid oxide fuel cells. Catalyst particles including CeO2 and Ni phases were impregnated into
porous LSCTA- scaffolds to enhance performance.
Experimental
La0.2Sr0.25Ca0.45TiO3 (LSCTA-) powder was supplied by Topsoe
Fuel Cells as part of the EU FCH-JU project SCOTAS and was calcined at temperatures in the range of 900-1250oC for 5h to investigate the physical properties, including specific surface area (SSA), particle size analysis (PSA) and sintering process. The purpose for the pre-calcination is to make the shrinkage of anode material compatible with YSZ electrolyte during the co-firing process, leading to a crack-free full ceramic cell. BET measurements were carried out on a Micromeritics TriStar II 3020 instrument to determine the change of the specific
surface areas (SSA) of LSCTA- powder before and after
calcinations. Particle size analysis of LSCTA- was carried out on a Malvern Instruments Mastersizer 2000 in deionised water as solution containing 2wt.% hypermer KD6 (Croda Iberica SA) as dispersant. The sinterability of green pellets made from calcined LSCTA- powder at different temperatures, as well as
8mol.% yttria-stabilized zirconia (YSZ) powder (HSY-8, DKK, Japan) were carried out on a Netzsch DIL 402 C instrument equipped with the Proteus thermal analysis software in air at a heating rate of 3oCmin-1 to 1350oC and a cooling rate of 3oCmin-1 after a dwelling time of 3h at 1350oC. The sintering shrinkage measurement was also performed on the mixed LSCTA- powder calcined at 1100
o
C (10wt.%) and 1250oC (90wt.%). The pellets were made by pressing powder with a uniaxial pressure of either 110Mpa or 150Mpa to create porous LSCTA- anodes and dense YSZ electrolytes, respectively. The final pellets were 2mm thick and 1.3cm in diameter. The sintered LSCTA- pellets with relative density ~60% were
prepared by pressing the mixture of LSCTA- and graphite and
then firing at 1350oC for 2h in air. The dimension is around 2mm in thickness and 10mm in diameter. The thermal expansion coefficient (TEC) measurement was carried out in flowing air and 5% H2-Ar atmospheres with a heating ramp of
3oCmin-1 from room temperature to 1000oC. The conductivity measurement was carried out using four-probe system in 5% H2-Ar atmosphere as a function of temperature. The samples
were prepared by tape casting using the LSCTA- slurries for the anode green tapes and sintering at 1350oC in air. The slabs were 11 × 11mm in area and 0.5mm in thickness with a relative density ~60%. Four platinum foil contacts were attached on the surface of the sample using platinum paste and consolidated by firing at 900oC for 30mins. In order to identify the influence of pre-reduction on the conductivity, the measurements were performed in reducing atmosphere from room temperature to 900oC on the samples with and without being pre-reduced at 1000oC in 5% H2-Ar.
The button fuel cells were fabricated by aqueous tape casting with co-sintering of dense YSZ electrolytes bonded with porous skeletal electrodes (LSCTA- and YSZ). The slurry formulation is
the most crucial step for tape casting, the green tapes and hence the sintered samples. The general procedure is described as follows. In the first step, the ceramic powder (LSCTA- for anode and YSZ for cathode) and flake graphite (Alfa
Aesar) were mixed and ball milled at a fast rate for 24h with addition of de-ionised water as solvent and hypermer KD6 (Croda Iberica SA) as dispersant. In the second step, another 24-h ball-milling was carried out after Poly(ethylene glycol) (PEG, Sigma-Aldrich) and Glycerol (Fisher Scientific UK Limited) as plasticizer, Polyvinyl alcohol (PVA, Alfa Aesar) as binder and Ethoxylated 2, 4, 7, 9-Tetraethyl 5 Decyn-4, 7-diol (Haikutech Europe BV) as defoamer were added to the homogenized powders successively. Then the mixed suspension was de-aired by slow ball milling and cast onto a Mylar film to produce a ceramic green tape. The dense YSZ green tapes were fabricated using the same recipe without pore former. To increase the connectivity of sintered LSCTA- anode and YSZ
electrolyte, co-casting of LSCTA- and YSZ green tapes was
Journal
of
Materials
Chemistry
A
Accepted
Manuscript
Journal Name
ARTICLE
employed, where the mixed suspension of LSCTA- was cast on
the top of the thin YSZ green slip. After drying overnight at room temperature, the green tapes were cut into an appropriate size and laminated, followed by co-sintering at 1350oC in air. The sintered samples of 2cm in diameter were subjected to a reduction process at 1000oC for 12h in a 5% H2
-Ar atmosphere. Upon reduction, the colour of LSCTA- changes
from light yellow to black.
The cathode side of pre-reduced samples was impregnated with precursor solutions containing La0.8Sr0.2FeO3 (LSF) and
La0.8Sr0.2CoO3 (LSC) successively and fired at 500 o
C in air to
decompose nitrate and avoid the re-oxidation of LSCTA-. The
loadings of impregnates in the YSZ cathode were 15wt.% LSF and 5wt.% LSC. Anode catalyst materials including CeO2 and Ni were impregnated into the porous LSCTA- scaffold using
solutions from Ce(NO3)3.6H2O (Sigma-Aldrich) and
Ni(NO3)2.6H2O (Newburyport, MA USA) with addition of triton
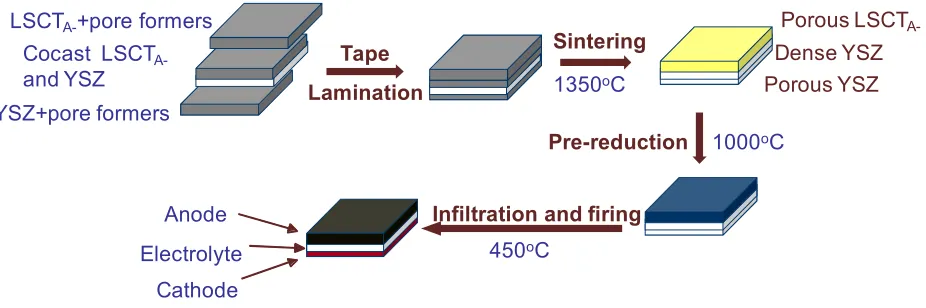
[image:4.612.80.543.216.370.2]as a dispersant. Multiple cycles of impregnation and calcination at 450oC were used until the desired loading of impregnates of oxides was reached. The manufacturing process for a functional anode-supported cell in this study is illustrated in Fig. 1.
Fig. 1 Process for the fabrication of LSCT
A-anode-supported fuel cell.
Silver paste (ESL Europe) was used for the current collection on the anode and cathode side and silver wire (Advent) as the lead for the electrodes. A single cell was sealed onto an alumina tube using ceramic adhesive (Ceramabond 552, Aremco). A gas flow of Ar containing 5% H2 was fed into the
anode chamber to avoid the oxidation of the anode upon heating to the test temperature, 800oC, before switching to humidified hydrogen (3% H2O). The current-voltage curves
were measured using a Solartron 1287 Electrochemical Interface and CorrWare v3.2c software (Scribner Associates) with 4-lead configuration. The electrochemical impedance tests were carried out at frequencies of between 100kHz and 0.01Hz using a combination of Solartron 1255 Frequency Response Analyser, Solartron 1287 Electrochemical Interface and ZPlot v3.2c software (Scribner Associates). The obtained impedance spectra were analysed by ZView 3.1 software (Scribner Associates).
The microstructure of single cell was analysed by Back-scattered Electron (BSE) using a JEOL 6700 scanning electron microscope. The Samples were immersed into epoxy under vacuum condition before grinding and polishing to a 1 micron diamond finish. The morphology of the electrodes were also analyzed by scanning electron microscopy (SEM) using a JEOL
6700 microscope to investigate the catalyst evolution prior to testing and after testing.
Results and discussion
Particle size and BET Analysis
The particle size of LSCTA- powder is an important parameter for a
tape-casting slurry in respects of dispersion, homogeneity of ceramics particles, viscosity of the slurry, the sintering behaviours of green tapes and the final structure. Because the calcination process is likely to cause the agglomeration of fine particles, all the powders for the particle size analysis have been ball milled for 24h in deionised water with addition of dispersant in advance. The PSA results of LSCTA- powders after thermal treatment and ball milling are presented in Fig. 2. A narrow and unimodal distribution is observed for all the cases. When calcination temperatures are increased from 900 to 1250o C, the distribution shifts from the fine particles to coarser particles.
The mean particle size d(0.5) and specific surface area (SSA) of all
samples are presented in Table 1. The SSA of the as-received powder is 35.8 m2g-1, much larger than calcined powders, indicating
LSCT
A-+pore formers
Electrolyte
Cathode
Anode
YSZ+pore formers
Cocast LSCT
A-and YSZ
Sintering
Tape
Lamination
Porous LSCT
A-1350
oC
Infiltration and firing
Porous YSZ
Pre-reduction
1000
oC
Dense YSZ
450
oC
Journal
of
Materials
Chemistry
A
Accepted
Manuscript
that it is composed of much smaller particles. The specific surface area (SSA) decreases with increasing calcination temperature, demonstrating a quick growth process of LSCTA- powder under calcination, which is in good agreement with the tendency of the mean particle size due to the inverse relationship between particle size and surface area.
Fig. 2 Particle size distribution of LSCTA- powder after
[image:5.612.70.294.130.303.2]calcination at 900-1250oC for 5h in air and ball milling for 24 h
Table 1 Mean particle size and specific surface area (SSA) of LSCT A-powder after calcination at varied temperatures and ball milling
Calcination Temp (°C) d(0.5) (µµµµm) SSA (m
2g-1)
As-received powder - 35.8
900 1.5 9.6
1000 1.8 6.2
1100 2.2 2.1
1200 3.7 0.66
1250 4.2 0.47
Thermal properties
YSZ and LSCTA- powders were used for the electrolyte and anode
skeleton, respectively. Therefore, matching the sinterability of LSCTA- and YSZ is very important to avoid defects in the cell such as delamination or cracks because of the stresses between the electrolyte and anode originated from the mismatch of sintering processes.
Precalcination was used to tailor the LSCTA- powder to match the
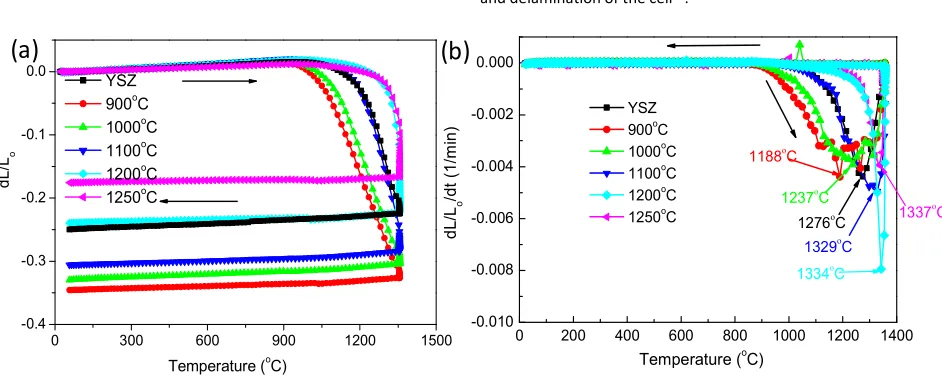
sinterability with the YSZ electrolyte. The shrinkage extent and the onset sintering temperature are the main parameters to determine compatibility. The dilatometer curves and the corresponding shrinkage rate of calcined LSCTA- and YSZ powder in air are used to
scope the sinterability of the two powders, as shown in Fig. 3. YSZ thermally expands with increasing temperature up to around 1100oC, and then shrinks abruptly to the maximum shrinkage rate at 1276oC (Fig. 3(b)), followed by a lower shrinkage rate to 1350oC, as the sintering process approaches the final stage. The onset sintering temperature of LSCTA- powder calcined below 1000oC is
lower than that of YSZ, and the total shrinkage is much larger than YSZ, reaching 34.5% and 32.9% for the powders calcined at 900oC and 1000oC, respectively, while the final shrinkage of YSZ powder is only 24.9%. The LSCTA- powders calcined below 1000
o
C seem to approach the maximum shrinkage rate at lower temperature than YSZ. The LSCTA- powder precalcined at 1100
o
C shows a very similar sintering curve to the YSZ until the temperature reaches 1276oC corresponding to the maximum shrinkage rate for YSZ: a continued fast sintering of the LSCTA- powder after this temperature causes
the mismatch of final shrinkage. The LSCTA- powders calcined at 1200 and 1250oC display a higher initiating temperature of densification and a smaller overall shrinkage than those of YSZ, which is in good agreement with the aforementioned BET analysis results. The temperature for the maximum shrinkage rate has been increased to 1334 and 1337oC for the powders calcined at 1200 and 1250oC, respectively. The evident discrepancy of the temperature of the maximum shrinkage rate between LSCTA- and YSZ may induce
the local stresses between electrolyte and anode, causing cracking and delamination of the cell33.
Fig. 3 Sintering (a) and shrinkage rate (b) curves for LSCTA- powders calcined at different temperatures and YSZ powder as a function of temperature in air.
0.01 0.1 1 10 100 1000 0
2 4 6 8 10
900oC 1000oC 1100oC 1200oC 1250oC
v
o
lu
m
e
%
particle diameter (µm)
0 200 400 600 800 1000 1200 1400 -0.010
-0.008 -0.006 -0.004 -0.002 0.000
1237o
C
1334o
C
1329o
C
1337o
C
Temperature (oC) YSZ
900oC 1000oC 1100oC 1200oC 1250oC
d
L
/Lo
/d
t
(1
/m
in
)
1276o
C
1188o
C
(b)
0 300 600 900 1200 1500 -0.4
-0.3 -0.2 -0.1 0.0
YSZ 900oC 1000oC 1100oC 1200oC 1250oC
Temperature (oC)
d
L
/Lo
(a)
Journal
of
Materials
Chemistry
A
Accepted
Manuscript
[image:5.612.63.539.260.651.2] [image:5.612.71.542.465.653.2]Journal Name
ARTICLE
Fig. 4 Sintering (a) and shrinkage rate (b) curves for mixed LSCTA- powder calcined at 1100oC (10wt.%) and 1250oC (90wt.%) compared with
YSZ powder as a function of sintering temperature in air.
Based on the comparison of the dilatometric sintering results of LSCTA- powder precalcined at different temperatures with YSZ
powder, it can be concluded that the shrinkage behaviour of LSCT A-powder calcined at a certain temperature is not compatible with the YSZ electrolyte. The mismatch could cause delamination or cracks on the cell components during sintering, resulting in the dysfunction of the whole cell. In order to make a better match in both the overall shrinkage and shrinkage rate with YSZ, a mixed LSCTA- powder containing 10wt.% calcined at 1100oC and 90wt.%
calcined at 1250oC was used. The mixture shows a very similar sintering shrinkage with YSZ, 24.3% for the mixed LSCTA- pellet and
25.0% for YSZ pellet (Fig. 4(a)). It is important to notice that during 3-h dwelling at 1350oC, LSCTA- green pellet shows a much larger
shrinkage than YSZ (7.4% comparing with 2.3%), so for a co-sintering process the dwelling time is crucial to keep the YSZ and LSCTA- bonded to each other. The discrepancy of the temperature corresponding to the maximum shrinkage rate between LSCT A-mixture and YSZ can be observed in Fig. 4(b) (1311oC for LSCT
A-mixture and 1276oC for YSZ), but the pores from the graphite in LSCTA- green tape might alleviate the strain through the
rearrangement of LSCTA- powder.
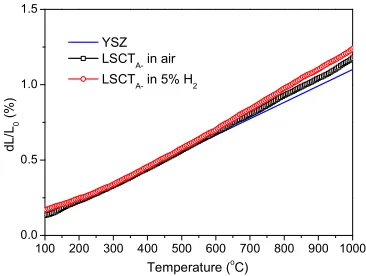
The thermal expansion behaviour of porous LSCTA- pellets sintered
at 1350oC for 2h in various atmospheres is plotted in Fig. 5 and compared with the thermal expansion of the YSZ electrolyte. The thermal expansion coefficients (TEC) are calculated as 12.1 and 11.6×10⁻⁶K-1 in reducing and oxidizing atmosphere, respectively, close to those of 11-12×10-6K-1 for LaxSr1-xTiO3 (x = 0.1-0.4) samples
in the temperature range 50-1000oC34. The sample with relative density of 60% shows a lower thermal expansion coefficient (TEC) value in air than that in reducing condition but still slightly higher than that of a typical zirconia based electrolyte (10.6-10.9×10⁻⁶ K
-1)35. The slightly higher TEC values in reducing atmosphere than
those in air could be attributed to the formation of Ti3+ ions in reducing atmosphere. However, the small difference of TEC values between YSZ and porous LSCTA- may be a cause of possible fuel cell
testing problems, e.g. spalling of YSZ from LSCTA- anode during
operation or cracking upon thermal cycles.
Fig. 5 Thermal expansion curves for LSCTA- samples with relative
density of 60% sintered in air at 1350oC for 2h, measured in 5% H2 -Ar atmosphere and flowing air
Electrical properties
It has been noted that the electrical conductivity of LST depends to a very large extent on the preparation and processing procedure leading to different porosity and concentration of Ti3+ ions36. The desired electrical conductivity of anode materials as a porous support is set to be greater than 1S/cm37. In dense form, the conductivity would need to be at least one order of magnitude greater. The conductivity of the LSCTA- sample with a high relative
density around 91% has been reported after pre-reduction at 1050oC under 5% H2-Ar condition for 72h, as 30S/cm31, while a very
slow reduction process at 880oC32 implies that high-temperature pre-reduction may be required for LSCTA- anode support to
introduce its high electrical conductivity.
Because the anode support requires sufficient porosity for the diffusion of fuel, the samples for conductivity measurement were prepared by the tape casting technique and sintering at 1350oC in
0 200 400 600 800 1000 1200 1400
-0.005 -0.004 -0.003 -0.002 -0.001 0.000 0.001
1311o C 1276o
C
Temperature (oC)
d
L
/Lo
/d
t
(1
/m
in
)
YSZ LSCT
A- mixture
0 200 400 600 800 1000 1200 1400
-0.3 -0.2 -0.1 0.0
d
L
/Lo
Temperature (oC)
YSZ LSCTA- mixture
(a)
(b)
100 200 300 400 500 600 700 800 900 1000
0.0 0.5 1.0 1.5
YSZ LSCT
A- in air
LSCT
A- in 5% H2
d
L
/L0
(
%
)
Temperature (oC)
Journal
of
Materials
Chemistry
A
Accepted
Manuscript
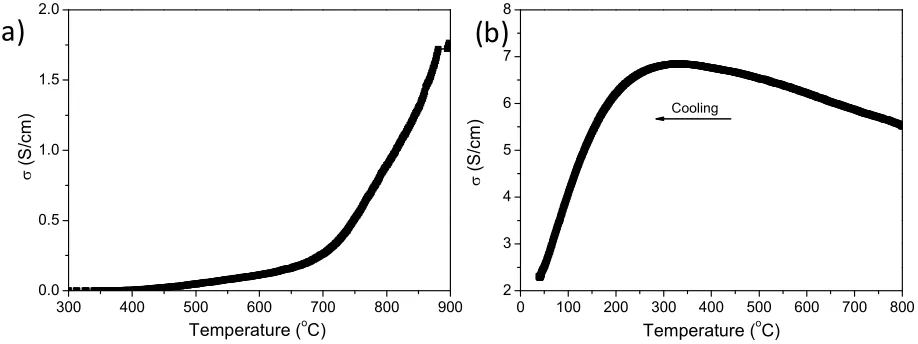
[image:6.612.314.497.327.465.2]air for 2h, the same as for fuel cell anode fabrication. The electrical conductivity of a porous LSCTA- samples with a relative density of 60% was carried out in 5% H2-Ar atmosphere with the increasing temperature to 900oC, as shown in Fig. 6(a). Conductivity increases with temperature suggesting a semiconducting behaviour. At 900oC, the conductivity can reach 1.7S/cm due to the reduction of Ti4+ to Ti3+, which is sufficient to provide electrical pathways for SOFC anodes. However, at the operation temperature of 700oC, the conductivity is only 0.25S/cm, indicating a high ohmic resistance could be caused by the low conductivity of the anode, leading to the inferior performance; for example, for an anode support with thickness of 0.5mm, an ohmic loss of 0.2Ωcm2 could be obtained for the anode.
In order to investigate the influence of the pre-reduction condition on the conductivity, a porous sample with a relative density of 60% was sintered at 1350oC in air, followed by pre-reduction at 1000oC for 24h in tube furnace under a constant purge flow of 5% H2-Ar
before conductivity measurement. To avoid the re-oxidation of the pre-reduced sample, 5% H2 was fed into the jig with the sample in
place for one hour to flush away the residual air before increasing the temperature for measurement. The temperature dependence
of the electrical conductivity in reducing atmosphere is shown in Fig. 6(b). The measurement was carried out upon cooling from 800oC to room temperature after being kept at 800oC for 24 h under PO2<10
-18Pa in 5% H
2-Ar atmosphere. The conductivity increases with the
decreasing temperature until 300oC, and below this temperature, the conductivity decreases with the decrease of the temperature, showing a metal–semiconductor transition from high temperature to room temperature. At 700oC, a conductivity of 5.9S/cm is obtained for a porous sample, which is quite promising for the electric transport as an anode support. However, the conductivity value is much lower than the one reported for porous La0.4Sr0.4TiO3
samples, probably due to more A-site vacancies and substitution of La3+ for Sr2+, and higher reducing temperature up to 1100-1300oC38 leading to the massive formation of Ti3+ ions.
[image:7.612.82.541.329.501.2]According to the conductivity measurement, LSCTA- is a good candidate as anode material for intermediate temperature SOFCs after pre-reduction at high temperature around 1000oC. However, careful consideration should be made when impregnating catalyst into the electrodes to prevent the re-oxidation of reduced anode during thermal treatment of the catalyst precursors.
Fig. 6 Electrical conductivity of LSCTA- sample with a relative density of 60 % in 5 % H2-Ar atmosphere as a function of temperature without
(a) and with (b) a pre-reduction process.
Intermediate temperature fuel cell tests
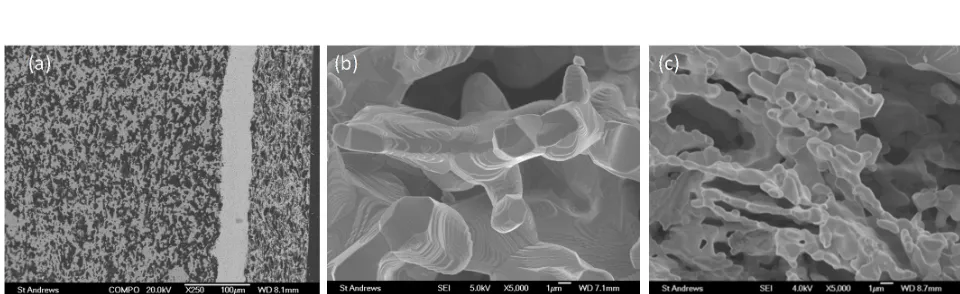
A BSE micrograph of the cross-section of the anode-supported button cells produced by aqueous tape casting is presented in Fig.7(a), showing the dense YSZ electrolyte adhering well with two porous electrode skeletons. In this study, the cells consisted of a
40-µm thick dense YSZ disk sandwiched by an 85μm thick porous YSZ layer on one side and a 450μm thick porous LSCTA- layer on the
other side. A crack-free dense YSZ electrolyte has been successfully obtained on the LSCTA- anode substrate after co-sintering without
open pores. As shown in the magnified SEM image of the fractured LSCTA- layer before impregnation (Fig. 7(b)), the necks between the
LSCTA- particles are difficult to distinguish, indicating a well-sintered
scaffold possibly due to the addition of fine particles from LSCT
A-powder calcined at 1100oC. The porous YSZ layer in Fig. 7(c) shows a much smaller homogeneous particle size of 1μm surrounded by the random pores between 1 and 5μm in size. The coarse pores formed in the porous electrodes are caused by the burnout of pore formers, which favours the easy transport of gas even after impregnation. The flake-like pores are attributed to replication of the platelet shape of graphite that was used as the pore-forming agent in these porous tapes.
300 400 500 600 700 800 900 0.0
0.5 1.0 1.5 2.0
Temperature (oC)
σ
(S
/c
m
)
0 100 200 300 400 500 600 700 800 2
3 4 5 6 7 8
σ
(S
/c
m
)
Temperature (oC)
Cooling
(b)
(a)
Journal
of
Materials
Chemistry
A
Accepted
Manuscript
Journal of Materials Chemistry A
ARTICLE
Fig. 7 (a) Back-scattered electron (BSE) image of the cross section of anode-supported cell produced by aqueous tape casting (from left to right: porous LSCTA- anode, dense YSZ electrolyte and porous YSZ cathode) ; (b) scanning electron micrographs (SEM) of porous LSCT A-anode backbone and (c) porous YSZ cathode backbone prior to impregnation.
The fuel cell was directly mounted and sealed onto an alumina tube, and a gas flow of Ar containing 5% H2 was fed into the anode to
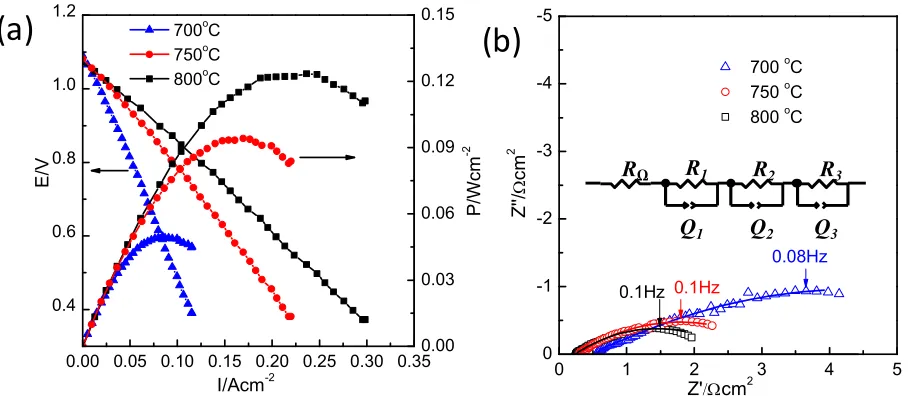
avoid the oxidation of the anode upon heating to the test temperature of 800oC, before switching to humidified hydrogen (3% H2O). The LSCTA- anode-supported button fuel cells (LSCTA- /YSZ/LSF-LSC-YSZ) with an active area of 0.8cm2 were electrochemically characterized at 700-800oC using humidified H2 (3vol.% H2O) as fuel
and ambient air as oxidant. The data were collected upon cooling down from 800 to 700oC. In Fig. 8(a), the open circuit voltages (OCVs) recorded are 1.09, 1.08 and 1.07 V at 700, 750 and 800oC, respectively, which is close to the theoretical values calculated from the Nernst equation. The high OCV values indicate that the thin electrolyte is sufficiently dense and the cell is well sealed onto the testing jig. The initial Area Specific Resistance (ASR) values calculated as the slope of the I-V curves are 6.3, 3.2 and 2.4Ωcm2 at 700, 750 and 800oC, respectively. The maximum power densities for the cell without catalysts on the anode side are 50, 94 and 124mW cm-2 at 700, 750 and 800oC, respectively. In order to understand the factors limiting cell performance, the electrochemical impedance spectra measured at OCV from 700 to 800oC are presented in Fig. 8(b). The ohmic resistance of the cell (Rs), determined from the
high-frequency intercepts with the abscissa, range from 0.55Ωcm2
at 700oC to 0.25Ωcm2 at 800oC. According to the conductivity of YSZ in the literature39, the contribution of the 40μm thick YSZ electrolyte to the ohmic resistance is around 0.20Ωcm2 at 700oC and 0.10Ωcm2 at 800oC. The differences of ohmic losses between the measured values and the calculated data are around 0.15-0.35 Ωcm2 at 700-800 oC, which should include the ohmic losses of anode and cathode, electrode/electrolyte interfacial resistance and current collection of silver paste. The low contribution of ohmic losses from electrodes demonstrates that LSCTA- backbone has a
reasonable electronic conductivity. The cell losses are dominated by the polarization resistance of electrodes (Rp), which are represented
by the distance between the high and low frequency intercepts of the curve with the abscissa. In order to analyse the nonohmic losses, an equivalent circuit of RΩ(R1Q1)(R2Q2)(R3Q3) (in Fig. 8(b)) was used
to fit the impedance spectra, where R is a resistance and Q a constant phase element (CPE). The fitting results reveal three distinct electrode processes corresponding to the high-frequency (~3kHz), medium-frequency (~5Hz), and low-frequency frequency (~0.1Hz) arcs. The sum of R1, R2 and R3 is considered to be the total
polarization resistance of electrodes (Rp). The fitted impedance
parameters are listed in Table 2.
Journal
of
Materials
Chemistry
A
Accepted
Manuscript
Published on 28 June 2016. Downloaded by University of St Andrews Library on 05/07/2016 09:23:57.
[image:8.612.64.544.141.288.2]Fig. 8 (a) I-V and power density curves and (b) impedance spectra for single-phase LSCTA- anode-supported cell in humidified hydrogen as a
[image:9.612.82.537.81.283.2]fuel gas and air as an oxidant gas collected at the following temperatures upon cooling: 700, 750 and 800oC. The impedance spectra were measured at open circuit voltage (OCV). Symbol and line represent the experimental data and fitting data with the equivalent circuit, respectively. The inset in (b) is equivalent circuit of the impedance spectra in this study.
Table 2 The Fitting Parameters (Ωcm2) for Impedance Spectra of the LSCTA- backbone cell tested at different temperatures in humidified hydrogen (3vol.% H2O)
Resistance 700oC 750oC 800oC
R1 0.52 0.11 0.036
R2 1.20 0.92 0.70
R3 3.98 1.50 1.12
Rp 5.70 2.53 1.86
The primary non-ohmic resistance is attributed to the low-frequency response with summit low-frequency value of ~0.1Hz. The appearance of a thermally activated low-frequency arc may suggest that the dissociative adsorption of gaseous species and surface diffusion are the arc-related processes. The high- and medium-frequency arcs are probably related with the charge transfer (oxygen ions and electron) between bulk and surface of the electrodes. However, it is difficult to separate the losses from the anode and cathode. The Rp value simulated from the equivalent
circuit (Rp=R1+R2+R3) range from 5.70Ωcm 2
at 700oC to 1.86Ωcm2 at 800oC, demonstrating a poor electrocatalytic activity of the LSCT
A-backbone for hydrogen oxidation, because the non-ohmic losses of the cathode are estimated to be around 0.13Ωcm2 at 700oC40. It is noteworthy that the polarization resistance values were much smaller than those of an electrolyte-supported cell with LSCT A-backbone anode at 900oC (45Ωcm2)29 and LST single-phase anode at 800oC (9.6Ωcm2)41, where the polarization resistance from the screen printed LSM-YSZ composite cathode is negligible at a range of 0.5-0.8Ωcm2 at 800-950oC42. The improved Rp values can be
explained by the generated oxygen vacancies with the formation of
Ti3+ upon high-temperature reduction, therefore increasing the reaction sites and improving the performance when using LSCT A-scaffold as the ionic and electronic conductive channel.
The addition of 4wt.% NiO enhances the performance significantly, as shown in Fig. 9(a): maximum power densities of 162, 237 and 367mW cm-2 are achieved at 700, 750 and 800oC, respectively, while the impregnated cell exhibits the reasonable OCV values between 1.07 and 1.09V. This performance is worse than that of Sr and Mg doped LaGaO3 (LSGM) with LSGM electrolyte even at 650 oC43, which could be attributed to the inferior ionic conductivity of LSCT and YSZ. The initial ASR values of the cell calculated as the slope of the I-V curves are 1.97, 1.33 and 0.87Ωcm2 at 700-800oC, respectively. These values are significantly lower than those of LSCTA- single phase cell at the same operation temperature. The impedance spectra shown in Fig. 9(b) are used to explain the losses of the cell. The ohmic resistances obtained from the EIS graph are 0.55-0.23Ωcm2 at the temperature range 700-800oC, close to those of the LSCTA- backbone cell. The addition of Ni did not alter the
ohmic resistances probably because the electrical conductivity of the anode backbone material after the pre-reduction process is sufficient to ensure that the resistance from the anode does not limit the cell performance. Moreover, the nickel loading is insufficient to form an interconnected layer for electronic conduction. The addition of nickel catalyst causes a dramatic drop of the non-ohmic losses, from 1.86Ωcm2 for the cell without impregnation to 0.60Ωcm2 for the cell impregnated with Ni at 800oC. The decrease of the Rp value for Ni impregnated cell confirms that
the high electrode losses can be attributed to the anode of the cell without catalyst. This result is consistent with what has been reported for infiltrating LST44, LSTM45 and LSCM46~48 as anodes.
0.00 0.05 0.10 0.15 0.20 0.25 0.30 0.35 0.4
0.6 0.8 1.0 1.2
700oC 750oC 800oC
E
/V
I/Acm-2
0.00 0.03 0.06 0.09 0.12 0.15
P
/W
c
m
-2
0 1 2 3 4 5
0 -1 -2 -3 -4 -5
0.1Hz 0.1Hz
0.08Hz
Z
''/
Ω
c
m
2
Z'
/Ωcm
2700 oC 750 oC 800 oC
R
ΩR
1R
2R
3Q
1Q
2Q
3(a)
(b)
Journal
of
Materials
Chemistry
A
Accepted
Manuscript
Journal Name
ARTICLE
Three responses presented at high, medium and low frequencies can be observed from the impedance spectra and analysed by using the equivalent circuit of RΩ(R1Q1)(R2Q2)(R3Q3), as shown in Fig. 8(b). For example, at 700oC the three main responses can be separated by the corresponding frequency values: 2000Hz for high-frequency response, 80Hz for medium-frequency response and 2Hz for
low-frequency response. The high-low-frequency arc can be distinguished clearly, while the medium- and low-frequency arcs overlap each other. The major electrode losses are from the low-frequency process, which is temperature dependent, suggesting that the adsorption and diffusion of reactant species are the dominant rate-limiting step in the anode.
Fig. 9 (a) I-V and power density curves and (b) impedance spectra for 4wt.% NiO impregnated LSCTA- anode-supported cell in humidified hydrogen as a fuel gas and air as an oxidant gas collected at the following temperatures upon cooling: 700, 750 and 800oC. The impedance spectra were measured at open circuit voltage (OCV). Symbol and line represent the experimental data and fitting data with the equivalent circuit, respectively.
The performance of the cell impregnated with 6wt.% CeO2 and 4wt.%
NiO into the LSCTA- was studied and is presented in Fig. 10. In Fig.
10(a), the cell obtained high OCV values of 1.08-1.10V at the temperature range 700-800oC, which is close to the theoretical OCV value considering the fuel is pure hydrogen containing 3vol.% H2O.
With the infiltration of combined ceria and nickel, the maximum power densities exceeded those of the nickel impregnated cell by a factor of two at the operation temperatures. The maximum power densities observed in Fig. 10(a) are 367, 568 and 960mW/cm2 at 700, 750 and 800oC, respectively. This performance is comparable to the NiO-YSZ supported fuel cell with 5-µm thickness electrolyte49, showing a performance of 1.2 W/cm2 The initial ASR values of unit cell calculated as the slope of the I-V curves are 0.80, 0.52 and 0.30Ωcm2 at 700-800oC, respectively. These values are significantly lower than those of LSCTA- single phase cell and Ni-impregnated cell
at the same operation temperature.
The impedance spectra at OCV are presented at Fig. 10b. The ohmic losses are quite similar to those of the cells with Ni catalyst and without catalyst. The polarization resistance (Rp) has been
significantly decreased with addition of ceria and nickel. The separation of the three main responses at high, medium and low frequency are much more evident than the other two cells, especially at low temperature. At 700oC, the maximum frequencies
for the corresponding electrode processes are 2000, 12.61 and 0.01Hz for high-, medium- and low-frequency arc, respectively. Compared to the cell impregnated with Ni only, the impregnation of ceria in addition can possibly provide extra oxygen ionic conductivity and exchange sites, so enlarging the electrochemical reaction zones, in part this may be achieved by forming better Ni dispersion and improving interfaces. Usually, on such impedance spectra, the reaction of charge transfer at high frequency, the absorption and surface diffusion process at medium frequency, and gas diffusion process at low frequency is expected29, 50. The resistance values across the high and medium frequency are thermally activated and strongly dependent on microstructure and anode composition. A significant decrease of the polarization resistance determined by absorption and surface diffusion process can be observed on the CeO2 and Ni co-impregnated cell compared
with the anode without catalyst and with Ni only, suggesting that the appearance of the ceria layer increases the TPBs, which might correlate with the ionic conductivity of ceria. In an anode where YSZ is used as a scaffold, ceria is not seen to have such an enhancing effect on the performance51,52, as YSZ provides sufficient oxygen ionic conductivity, whereas ceria on an LSCTA- scaffold plays the role of both ionic conductor and catalyst. The low-frequency arcs are temperature independent, with a relaxation time ~0.01Hz, pointing
(a)
(b)
0.0 0.2 0.4 0.6 0.8 1.0 0.0
0.2 0.4 0.6 0.8 1.0 1.2
700oC 750oC 800oC
E
/V
I/Acm-2
0.0 0.1 0.2 0.3 0.4
P
/W
c
m
-2
0.0 0.3 0.6 0.9 1.2 1.5 0.0
-0.3 -0.6 -0.9 -1.2 -1.5
2HZ
Z
''/
Ω
c
m
2
Z'/Ωcm2
700oC 750oC 800oC
8HZ 2HZ
Journal
of
Materials
Chemistry
A
Accepted
Manuscript
[image:10.612.80.540.166.361.2]out the gas diffusion and fuel delivery at the anode as the process associated with this arc.
Fig. 10 (a) I-V and power density curves and (b) impedance spectra for 6wt.% CeO2 and 4wt.% NiO impregnated LSCTA- anode-supported
cell in humidified hydrogen as a fuel gas and air as an oxidant gas collected at the following temperatures upon cooling: 700, 750 and 800oC. The impedance spectra were measured at open circuit voltage (OCV). Symbol and line represent the experimental data and fitting data with the equivalent circuit, respectively.
Microstructure of the infiltrated anode after cell tests
SEM images of the anodes with impregnated Ni/NiO before and after electrochemical testing are shown in Fig. 11. In Fig. 11(a) and (b), after annealing at 450oC in air, 100nm NiO particles are recognised on the surface of LSCTA- backbone, which plays an
important role in electrochemical catalytic activity. After testing at 800oC (Fig. 11(c) and (d)), two different Ni particle sizes can be seen on the LSCTA- structure: a finer nickel structure is visible on terrace
structure of the convex regions of LSCTA- surface and a coarser
nickel particle with agglomeration is formed on the concave zones of LSCTA- surface. This can be explained by the uneven deposition
process, which is driven by capillary action, resulting in a thinner layer formed on convex surfaces and a thicker layer located on concave surfaces53. Most agglomerations of nickel particles are located on the concave surface of LSCTA-, resulting from a thicker
layer of NiO forming upon the process. It is necessary to optimize the distribution and retard the agglomeration and growth of Ni particles on the anode surface during the electrochemical testing.
Fig 11 Scanning electron micrographs (SEM) of the 4wt.% NiO impregnated LSCTA- (a) fired at 450oC before electrochemical
measurements and (c) after electrochemical measurements at 800oC; (b) and (d) the magnified view of impregnated coating in (a) and (b), respectively (rectangular part).
Fig. 12 shows the SEM images of the anodes with impregnated CeO2
and NiO before and after electrochemical testing. Fig. 12(a) is the micrograph obtained following the addition of 6wt.% ceria and 4wt.% NiO and then annealing at 450oC in air. The Figure demonstrates that a loosely packed structure of CeO2 and NiO has been filled into
0.0 0.5 1.0 1.5 2.0 2.5 0.0
0.3 0.6 0.9 1.2
700oC 750oC 800oC
E
/V
I/Acm
-20.0 0.2 0.4 0.6 0.8 1.0
P
/W
c
m
-2
(a)
(b)
0.2 0.4 0.6 0.8 1.0
0.0 -0.2 -0.4 -0.6 -0.8
Z
''/
Ω
c
m
2
Z'
/Ωcm
2700oC 750oC 800oC
800Hz
0.01Hz
3.16Hz
2KHz 0.01Hz 12.61Hz
0.20 0.25 0.30 0.35 0.40 0.00
-0.05 -0.10
3KHz
0.01Hz
Journal
of
Materials
Chemistry
A
Accepted
Manuscript
[image:11.612.81.544.94.297.2] [image:11.612.313.540.394.575.2]Journal Name
ARTICLE
the pores of LSCTA- particles. From the magnified image of
impregnates in Fig. 12(b), a thin layer of ceria is observed, along with bright and rectangular NiO particles on the ceria coating. This morphology can possibly increase the ionic conductivity of the backbone and provide more TPBs for electrochemical reaction, which is in good agreement with the electrochemical testing results. After testing at 800oC, it is difficult to discern the ceria layer from nickel particles formed on the LSCTA- surface, as shown in Fig. 12(c)
and (d). By comparing Ni-impregnated LSCTA- structure with and
without ceria, it has been noted that the existence of the ceria layer slows down the growth and agglomeration of nickel nanoparticles during testing, which is supposed to favour the performance as well as the long-term operation. In order to further improve the performance, the optimization of catalyst impregnation method and understanding of scaffold-catalyst interactions is necessary.
Fig.12 Scanning electron micrographs (SEM) of the 6wt.% ceria and 4wt.% NiO impregnated LSCTA- (a) fired at 450oC before electrochemical measurements and (c) after electrochemical measurements at 800oC; (b) and (d) the magnified view of impregnated coating in (a) and (b), respectively (rectangular part).
Conclusion
Solid oxide fuel cells using A-site deficient strontium titanate La0.2Sr0.25Ca0.45TiO3 (LSCTA-) as an anode scaffold material reduced
at high temperature (i.e. 1000oC) show very promising electrochemical performance after impregnation of catalyst. The cell with CeO2 and Ni-impregnated LSCTA- anode exhibits a maximum powder density of 0.96Wcm-2 at 800oC, much larger than 0.367Wcm-2 for the cell impregnated with Ni alone and 0.125Wcm-2 for the cell without impregnation. The addition of ionic conductor (CeO2) and catalyst (Ni) into LSCTA- anode significantly reduces the
polarization resistance of the cells, suggesting an insufficient oxygen ionic conductivity and electrocatalytic activity for hydrogen oxidation of the LSCTA- backbone, but LSCTA- can provide the
electronic conductivity required for anode. The future work will focus on improving the understanding of the mechanics of the catalyst-scaffold interactions and scaling up the concept.
Acknowledgements
The research leading to these results has received funding from the European Union's Seventh Framework Programme (FP7/2007-2013) for the Fuel Cells and Hydrogen Joint Technology Initiative under grant agreement n° 256730 and Energy Technology Partnership (ETP).
Journal
of
Materials
Chemistry
A
Accepted
Manuscript
References
1 T. Setoguchi, k. Okamoto, K. Eguchi and H. Arai, J. Electrochem. Soc., 1992, 139(10), 2875.
2 S. T. Aruna, M. Muthuraman, K. C. Patil, Solid State Ionics, 1998,
111(1-2), 45.
3 M. L. Toebes, J. H. Bitter, A. J. van Dillen, K. P. de Jong, Catalysis Today, 2002, 76(1), 33.
4 Y. Matsuzaki, I. Yasuda, Solid State Ionics, 2000, 132(3-4), 261. 5 T. Iwata, J. Electrochem. Soc., 1996, 143(5), 1521.
6 P. R. Slater, D. P. Fagg and J. T. S. Irvine, J. Mater. Chem., 1997,
7(12), 2495.
7 R. Mukundan, E. L. Brosha, F. H. Garzon, Electrochem. Solid-State Lett., 2004, 7(1), A5.
8 K. Ahn, S. Jung, J. M. Vohs, R. J. Gorte, Ceram. Int., 2007, 33(6), 1065.
9 H. Kurokawa, L. M. Yang, C. P. Jacobson, L. C. De Jonghe, S. J. Visco, J. Power Sources, 2007, 164(2), 510.
10 G. Tsekouras, and J. T. S. Irvine, J. Mater. Chem., 2001, 21 (25), 9367.
11 Q. Ma, and F. Tietz, Solid State Ionics, 2012, 225, 108.
12 C. D. Savaniu and J. T. S. Irvine, J. Mater. Chem., 2009, 19(43), 8119.
13 K. B. Yoo, B. H. Park, and G. M. Choi, Solid State Ionics, 2012,
225, 104.
14 M. Roushanafshar, J.-L. Luo, A. L. Vincent, K. T. Chuang, and A. R. Sanger, Int. J. Hydrogen Energy,2012, 37, 7762.
15 E. D. Wachsman and K. T. Lee, Science, 2011, 334(6058), 935. 16 S. Le, K. N. Sun, N. Zhang, X. Zhu, H. Sun, Y. X. Yuan, and X. Zhou,
J. Power Sources, 2010, 195(9), 2644.
17 Z. Shen, X. Zhu, S. Le, W. Sun, and K. Sun, Int. J. Hydrogen Energy, 2012, 37(13), 10337.
18 L. C. De Jonghe, C. P. Jacobson, and S. J. Visco, Annu. Rev. Mater. Res., 2003, 33(1), 169.
19 E. Olevsky, T. T. Molla, H. L. Frandsen, R. Bjørk, V. Esposito, D. W. Ni, A. Ilyina, and N. Pryds, J. Am. Ceram. Soc., 2013, 96(8), 2657. 20 D. W. Ni, E. Olevsky, V. Esposito, T. T. Molla, S. P. V. Foghmoes,
R. Bjørk, E. Aleksandrova, and N. Pryds, J. Am. Ceram. Soc., 2013,
96(8), 2666.
21 C. Fu, S. H. Chan, Q. Liu, X. Ge, G. Pasciak, Int. J. Hydrogen Energy, 2010, 35(1), 301.
22 A. Akbari-Fakhrabadi, R. V. Mangalaraja, F. A. Sanhueza, R. E. Avila, S. Ananthakumar, S. H. Chan, J. Power Sources, 2012, 218, 307.
23 O. A. Marina, N. L. Canfield, and J. W. Stevenson, Solid State Ionics, 2002, 149, 21.
24 J. T.S. Irvine, D. Neagu, M. C. Verbraeken, C.
Chatzichristodoulou, C. Graves and M. B. Mogensen, Nature Energy, 2016, 1, 15014.
25 K. B. Yoo, G. M. Choi, Solid State Ionics, 2009, 180(11-13), 867. 26 T. Ikebe, H. Muroyama, T. Matsui, and K. Eguchi, J. Electrochem.
Soc., 2010, 157(6), B970.
27 H. Kurokawa, L. M. Yang, C. P. Jacobson, L. C. De Jonghe, S. J. Visco, J. Power Sources, 2007, 164(2), 510.
28 Q. L. Ma, F. Tietz, A. Leonide, E. Ivers-Tiffee, J. Power Sources, 2011, 196(17), 7308.
29 M. C. Verbraeken, B. Iwanschitz, A. Mai, J. T. S. Irvine, J. Electrochem. Soc., 2012, 159(11), F757.
30 C. D. Savaniu, and J. T. S. Irvine, ECS Trans., 2009, 25(2), 2213. 31 A. D. Aljaberi, J. T. S. Irvine, J. Mater. Chem. A, 2013, 1(19),
5868.
32 A. Yaqub, C. Savaniu, N. K. Janjua, and J. T. S. Irvine, J. Mater. Chem. A, 2013, 1 (45): 14189.
33 Z. M. Shen, X. D. Zhu, S. R. Le, W. Sun, and K. N. Sun, Inter. J. Hydrogen Energy, 2012, 37(13): 10337.
34 O. A. Marina, N. L. Canfield, and J. W. Stevenson, Solid State Ionics, 2002, 149, 21.
35 F. Tietz, Ionics, 1999, 5, 129.
36 Q. Ma, F. Tietz, D. Sebold, and D. Stöver, J. Power Sources, 2010,
195, 1920.
37 A. Atkinson, S. Barnett, R. J. Gorte, J. S. I. Irvine, A. J. McEvoy, M. Mogensen, S. C. Singhal, and J. Vohs, Nat. Mater., 2004, 3(1), 17. 38 D. Neagu, and J. T. S. Irvine, Chem. Mater., 2010, 22: 5042. 39 I. R. Gibson, and J. T. S. Irvine, J. Mater. Chem., 1996, 6(5), 895. 40 W. Wang, M. D. Gross, J. M. Vohs, and R. J. Gorte, J.
Electrochem. Soc., 2007, 154(5), B439.
41 K. B. Yoo, and G. M. Choi, ECS Trans., 2009, 25(2), 2259. 42 J.-D. Kim, G.-D. Kim, J.-W. Moon, Y. Park, W.-H. Lee, K.
Kobayashi, M. Nagai, and C.-E. Kim, Solid State Ionics, 2001, 143, 379.
43 Z. Zhan, D. M. Bierschenk, J. S. Cronin and S. A. Barnett, Energy & Environmental Science, 2011, 4, 3951-3954.
44 J. S. Park, I. D. Hasson, M. D. Gross, C. Chen, J. M. Vohs, and R. J. Gorte, J. Power Sources, 2011, 196(18), 7488.
45 J. H. Kim, H. Schlegl, and J. T. S. Irvine, Int. J. Hydrogen Energy, 2012, 37, 14511.
46 J. S. Kim, V. V. Nair, J. M. Vohs, and R. J. Gorte, Scripta Mater., 2011, 65(2), 90.
47 G. Kim, S. Lee, J. Y. Shin, G. Corre, J. T. S. Irvine, J. M. Vohs, and R. J. Gorte, Electrochem. Solid State Lett., 2009, 12(3), B48. 48 G. Kim, G. Corre, J. T. S. Irvine, J. M. Vohs, and R. J. Gorte,
Electrochem. Solid State Lett., 2008, 11(2), B16.
49 F. Zhao and A. V. Virkar, J. Power Sources, 2005, 141, 79-95. 50 D. A. Osinkin, N. M. Bogdanovich, S. M. Beresnev, and V. D. Zhuravlev, J. Power Sources, 2015, 288, 20.
51 M. D. Gross, J. M. vohs, and R. J. Gorte, J. Mater. Chem., 2007,
17(30), 3071.
52 M. D. Gross, J. M. vohs, and R. J. Gorte, J. Electrochem. Soc., 2007, 154(7), B694.
53 G. Corre, G. Kim,, M. Cassidy, J. M. Vohs, R. J. Gorte, and J. T. S. Irvine, Chem. Mater., 2009, 21(6), 1077.