Edited by:
David Costantini, Muséum National d’Histoire Naturelle, France
Reviewed by:
Kimberley A. Phillips, Trinity University, United States Valeria Marasco, University of Veterinary Medicine Vienna, Austria
*Correspondence:
Ruth Sonnweber ruth_sonnweber@eva.mpg.de
Specialty section:
This article was submitted to Behavioral and Evolutionary Ecology, a section of the journal Frontiers in Ecology and Evolution
Received:12 March 2018
Accepted:31 May 2018
Published:19 June 2018
Citation:
Sonnweber R, Araya-Ajoy YG, Behringer V, Deschner T, Tkaczynski P, Fedurek P, Preis A, Samuni L, Zommers Z, Gomes C, Zuberbühler K, Wittig RM and Crockford C (2018) Circadian Rhythms of Urinary Cortisol Levels Vary Between Individuals in Wild Male Chimpanzees: A Reaction Norm Approach. Front. Ecol. Evol. 6:85. doi: 10.3389/fevo.2018.00085
Circadian Rhythms of Urinary
Cortisol Levels Vary Between
Individuals in Wild Male
Chimpanzees: A Reaction Norm
Approach
Ruth Sonnweber1*, Yimen G. Araya-Ajoy2, Verena Behringer1, Tobias Deschner1,
Patrick Tkaczynski1, Pawel Fedurek1, Anna Preis1, Liran Samuni1, Zinta Zommers3,
Cristina Gomes4, Klaus Zuberbühler5,6, Roman M. Wittig1,7and Catherine Crockford1,7
1Department of Primatology, Max-Planck-Institut für Evolutionäre Anthropologie, Leipzig, Germany,2Department of Biology, Norwegian University of Science and Technology, Trondheim, Norway,3Food and Agriculture Organization of the United Nations, Freetown, Sierra Leone,4Tropical Conservation Institute, Florida International University, Miami, FL, United States, 5Department of Comparative Cognition, University of Neuchâtel, Neuchâtel, Switzerland,6Budongo Conservation Field Station, Masindi, Uganda,7Tai Chimpanzee Project, Department of Primatology, Max Planck Institute for Evolutionary Anthropology, Abidjan, Côte d’Ivoire
Investigating the repeatability of trait variation between individuals, that is the amount of individual variation in relation to overall phenotypic variation, indicates an upper level of heritability and reveals whether a given trait may be subject to selection. Labile traits are characterized by high levels of flexibility and consequently low trait repeatability is expected. Indeed, research examining glucocorticoid levels in various non-mammal species found low repeatability scores. However, mammals may be different in this respect as (i) differential maternal care early in life has the potential to prime hypothalamic-pituitary-adrenal axis functioning and (ii) allelic variation affecting hypothalamic-pituitary-adrenal axis functioning has been reported. Individuals often differ from each other in average and/or plastic labile trait expression, two aspects that can be described using a reaction norm approach. Both consistent and flexible reaction norm expression has been argued to serve adaptive purposes, depending on the stability and predictability of environmental conditions. Here, we investigated both trait and reaction norm repeatability of urinary cortisol levels in wild adult male chimpanzees. To capture the expression of the circadian urinary cortisol rhythm of individual males over time, urine samples were collected throughout the day. In total data of 30 males collected over a period of 8 years were included in the dataset. No male was sampled over the whole 8-year period however. We found minor levels of trait repeatability but considerable reaction norm repeatability. This implies a minor role of genetic or priming factors on cortisol excretion, but reveals that males differ consistently in average urinary cortisol levels and the shape of the circadian urinary cortisol rhythm. Relating these results to fitness parameters will provide answers to questions on the adaptive value of reaction norm repeatability of this labile hormonal trait in the future.
INTRODUCTION
Whether a trait varies more between or within individuals in a population has different ecological and evolutionary implications. Individual variation in a trait represents the raw material for natural selection and the stability of differences between individuals impacts the efficiency of adaptive responses to selection (Roche et al., 2016). Between individual variation in a trait is generated by differential exposure to relatively stable environmental factors, such as mothering styles (see for instance Liu et al., 1997; Francis and Meaney, 1999; Caldji et al., 2000), or by heritable differences between individuals (Dingemanse et al., 2010b; Forsman, 2015; Westneat et al., 2015). Individualtrait repeatability, defined as the proportion of phenotypic variance explained by consistent between individual differences, indicates whether a trait can evolve through selection in principle (Dingemanse and Dochtermann, 2013; Baugh et al., 2014): traits with high repeatability—that is high relative between individual variation—can potentially be selected for if between individual variation is generated by genetic differences. Thus, measures of repeatability indicate an upper level of heritability. Generally, traits that are more plastic as their expression is more sensitive to external or internal circumstances, are predicted to have low trait repeatability (Bell et al., 2009). Therefore, when it comes to labile traits, differences between individuals may be more pronounced in the scope within which a trait is expressed, rather than in individual measurements. Average trait expression and/or, in the presence of environmental or internal gradients, plasticity of trait expression are commonly used in reaction norm approaches to estimate this scope of trait expression (e.g., Martin et al., 2011; Araya-Ajoy et al., 2015). Reaction norms are commonly characterized by an individual’s average response to a mean centered environment (reaction norm intercept) and its level of plasticity (reaction norm slope) in response to that environmental gradient (Weis and Gorman, 1990; Via et al., 1995; Araya-Ajoy et al., 2015). Depending on the predictability of the environment and the time scale within which ecological conditions change, either highly flexible or less responsive phenotypes can be expected to cope better and represent a particular adaptive strategy (Dingemanse and Wolf, 2013; Botero et al., 2015).Reaction norm repeatability—that is how stable individuals are in their responses to environmental change over time—is expected only when individual attributes related to the costs and benefits of plasticity are stable over time. In the past years, research on average reaction norms and plasticity revealed that both can be subject to sexual and natural selection, and thus have important implications for environmental processes and trait evolution (Piersma and Drent, 2003; Nussey et al., 2005, 2007; Brommer, 2013; Dingemanse and Dochtermann, 2013; Westneat et al., 2015; Martin et al., 2017; Villegas-Ríos et al., 2017).
Currently, a strand of research in the field of evolutionary ecology focuses on examining levels of repeatability of labile traits, such as behavior or hormonal profiles (Nussey et al., 2007; Baugh et al., 2014; Westneat et al., 2015; Villegas-Ríos et al., 2017) as this is a promising avenue to tackle ultimate questions on selection pressures, adaptation, and fitness implications of
traits that are affected by ever changing environmental conditions (Brommer, 2013). A fair share of scientific effort in this line of research has focused on individual repeatability of glucocorticoid levels (e.g.,Hruschka et al., 2005; Bonier et al., 2009; Thomas et al., 2009; Dingemanse et al., 2010a; Flinn et al., 2011; Ouyang et al., 2011a; Brommer, 2013; Cockrem, 2013; Narayan and Hero, 2013; Baugh et al., 2014; Hau et al., 2016). Glucocorticoids are a group of steroid hormones that function as physiological mediators to deal with metabolic demands arising from internal (e.g., metabolic) and external (e.g., ecological) circumstances (Sapolsky et al., 2000; Romero et al., 2009; Wingfield, 2013). So far, studies investigating repeatability in glucocorticoid levels in wild populations of various bird, fish, and reptile species have found low between individual variation in glucocorticoid levels, suggesting a negligible role of genetic or priming factors in glucocorticoid profiles (see for instanceOuyang et al., 2011a; Cockrem, 2013; Baugh et al., 2014; Lendvai et al., 2015; Small and Schoech, 2015; Hau et al., 2016). To our knowledge, in mammals between individual glucocorticoid repeatability has not been investigated so far. There is however evidence for some genetic predisposition of glucocorticoid excretion mechanisms (Linkowski et al., 1993; Oswald et al., 2004; Pflüger et al., 2016). Furthermore, a multitude of species has prolonged phases of intensive maternal care (e.g., Purvis and Harvey, 1995), rendering priming of glucocorticoid excretion patterns possible (e.g., Plotsky and Meaney, 1993, but see Aizer et al., 2015; Berghänel et al., 2016; Murray et al., 2016; McCormick et al., 2017). Therefore, exposure to differential levels of parental care and differences in genetic makeup could generate glucocorticoid trait repeatability among adult individuals in mammals.
While relatively little is known about glucocorticoid trait repeatability, repeatability of reaction norms is even less investigated (Araya-Ajoy et al., 2015; Hau et al., 2016). Studies investigating consistency in glucocorticoid responses between and within individuals are all derived from sampling plasma corticosterone in bird species and mostly share the caveat that the time frame over which measures are taken is relatively short, usually spanning days or months (e.g.,Cockrem and Silverin, 2002; Romero and Reed, 2008). Results so far indicate that individuals are consistent in some aspects of their glucocorticoid excretion patterns but rather variable in other glucocorticoid response measures (e.g., high repeatability of stress-induced but not baseline glucocorticoid levels in Florida scrub jays,Rensel and Schoech, 2011). However, average glucocorticoid reaction norms and glucocorticoid plasticity as stable traits may be determined by the individual’s genotype to a certain extent and thus be subject to selection (Rensel and Schoech, 2011).
possible. Factors affecting glucocorticoid levels, such as circadian rhythms (Muller and Lipson, 2003), dominance rank (e.g., Muller and Wrangham, 2004; Anestis, 2005; Anestis et al., 2006; Muehlenbein and Watts, 2010), social dynamics (e.g., Fraser et al., 2008; Emery Thompson et al., 2010; Wittig et al., 2016), and maternal care (Murray et al., 2016) are well-studied in this species. This allows for an informed decision on potential control factors in statistical models and a sound biological interpretation of different patterns. We studied the circadian rhythm in urinary glucocorticoid excretion exhibited by chimpanzees (Muller and Lipson, 2003) and examined (i) trait repeatability of cortisol excretion, as well as (ii) the repeatability in circadian reaction norm parameters in adult male chimpanzees. The circadian cortisol excretion pattern (Kumar, 2017) is characterized by low levels of cortisol during the first half of the night, a continuous raise in cortisol levels toward the morning, and a pronounced increase at awakening, called the cortisol awakening response. Afterwards, throughout the day, cortisol levels decline, flattening in the afternoon, and reaching lowest levels in the evening. The circadian rhythm qualifies for the investigation of between individual variability in cortisol excretion for several reasons: (i) it represents a predictable internal gradient; (ii) due to ever changing social and environmental conditions within individual variation in cortisol levels along the gradient can be expected; (iii) lastly, the circadian rhythm in cortisol levels monitored over many years allows for detailed examination of repeatability estimates over shorter and longer periods. We predicted to find trait repeatability of cortisol phenotypes, which could either be due to differences in genetic makeup or because males are likely exposed differentially to factors that have the potential to prime HPA axis functioning, such as nutritional status of the mother during pregnancy (Edwards et al., 2002; Knackstedt et al., 2005) or postnatal maternal care (Murray et al., 2016). Furthermore, given the consistent results on reaction norm repeatability of corticosterone in birds (Hau et al., 2016), we expected to find that male chimpanzees are stable and consistently different from each other in their urinary cortisol reaction norms.
MATERIALS AND METHODS
Study Species and Study Sites
Data were collected at two sites on two subspecies of chimpanzees: Pan troglodytes schweinfurthii at the Budongo Conservation Field Station (1◦43′ N, 31◦32′ E) in Budongo
forest, Uganda andPan troglodytes verusat the Taï Chimpanzee Project (5◦52′N, 7◦20′E) in the Taï National Park, Ivory Coast.
In Budongo forest the Sonso community was studied, whereas for Taï data on three groups (East, North, and South group) were available. Both are long-term field sites, with systematic observations starting in Taï in 1982 (Boesch and Boesch-Achermann, 2000), and in Budongo in 1990 (Reynolds, 2005). The two long-term field sites keep track of demographic changes in the chimpanzee communities and record rainfall and temperature measurements. Field assistants are employed at both sites to collect behavioral data and urine samples (for hormonal analyses). Additionally, data from a variety of
individual cross-sectional research projects were made available from the long-term databases of the respective field site.
For the current study, we used data on adult male chimpanzees of well-habituated groups spanning over a total of 8 years. We included data from periods for which both urine samples for non-invasive assessment of cortisol levels and behavioral data (pant grunt vocalizations to establish rank hierarchies, further details below) were collected. Data from the Taï field site used in this study stem from three different communities (East, North, and South group) and were collected between July 2004 and April 2010, and between October 2013 and May 2015. Data were sometimes collected during the same time periods across groups, but no community is represented over the whole study period. Data on the Budongo males were collected in one community (Sonso group) from June 2006 until November 2009. Male chimpanzees reach adulthood at 14 years. Ages in this study ranged from 15 to 49 years (Budongo: average age= 23.25,
SD=9.26, range=15–49; Taï: average age=23.55,SD=8.65, range= 15–45). A detailed overview is given in Table S1 in the Supplementary Material. The chimpanzee communities differed regarding their group sizes and group composition (Table 1), ranging between an average of 9.47 (SD=1.37) adult individuals in the North group of Taï to an average of 44.01 (SD= 1.61) adult individuals in the Sonso community. The ratio of the number of adult males to the number of adult females was relatively similar for all groups (ranging from 0.50–0.56), apart from the North group in Taï that had an average sex ratio of 0.36 (SD=0.12).
Ethics Statement
At both sites, all methods of data collection were non-invasive. Permissions for the research were granted by the Ministries of Research and Environment of Ivory Coast and Office Ivorien des Parcs et Reserves for Taï, and Uganda Wildlife Authority and Uganda National Council for Science and Technology for Budongo. Furthermore, the Taï Chimpanzee Project and the Budongo Conservation Field Station approved all projects that made their data available for the current study. All aspects of the study comply with the ethics policy of both the Max Planck Society and the Department of Primatology of the Max Planck Institute for Evolutionary Anthropology, Germany (www. eva.mpg.de/primat/ethical-guidelines.html). Import and export certificates of urine sample shipments can be provided upon request.
Urine Sample Collection and Analysis
chimpanzee populations were collected non-invasively and opportunistically when they could be assigned reliably to a specific male, as he was observed urinating (detailed descriptions of urine sample collection protocols in the Supplementary Material and inDeschner et al., 2003; Crockford et al., 2013). Several (18 out of 30) individuals died during the study period. However, only in three cases samples were collected within the month of death (in one case 2 out of 9 samples were collected in the month of death, in another case 2 out of 19 samples, and in the last case 3 out of 22 samples). The chimpanzee population in the Tai forest suffered outbreaks of Ebola and was exposed to Anthrax repeatedly in the past decades. Samples that were obtained during such outbreaks were not included in the current study. Samples were shipped frozen to the Laboratory of Endocrinology at the Max Planck Institute for Evolutionary Anthropology, Germany and stored at−80◦C until
analysis.
Liquid chromatography–tandem mass spectrometry was used to measure urinary cortisol levels (Hauser et al., 2008). Furthermore, each sample was analyzed for creatinine concentrations to correct cortisol measurements for water content in the urine, which varies with the time since the last urination and the level of an animal’s hydration (Erb et al., 1970).
The Dataset
For our analyses, we had access to a total of 1,901 urine samples of 30 different adult males. Thirteen of those males were part of the Sonso community, Budongo Forest, Uganda, and 17 males inhabited the Taï forest, Ivory Coast. For Sonso a total of 617 urine samples was available (between 5 and 121 samples per male, average = 47.46,SD= 35.07). For Taï 1284 samples of adult males (between 10 and 218 samples per male, average= 75.53,
SD=68.00) were analyzed.
Whenever a urine sample was collected the time was noted. The first samples of the day were gathered at 05:30 in the morning and the last samples of the day were collected at ∼19:00. In the current study, we studied the circadian rhythm in urinary cortisol excretion. Thus, the collection time data generated the gradient over which we investigated variation in cortisol. Most urine samples (n=1,628) were collected between 8:00 and 17:00 with an average of 180.89 (SD = 203.77) samples per hour (Figure S1 shows a histogram of the number of samples collected binned into 1 h time intervals over the day in the Supplementary Material). A detailed overview of number of samples by time
interval and community or individual is given in Tables S2 and S3 in the Supplementary Material.
Extensive research has shown that a variety of social and ecological parameters correlate with excreted glucocorticoid levels (Beehner and Bergman, 2017). In this study, we controlled for the effects of such correlates to determine between individual variation in urinary cortisol levels independent of current social or environmental factors. To this end, we calculated several control variables: (i) in male chimpanzees, high social rank is associated with high glucocorticoid levels (Muller and Wrangham, 2004). To assess dynamic dominance relations amongst the males within each group, we used unidirectional submissive pant grunt vocalizations (Wittig and Boesch, 2003) that were collected during focal animal follows and with all occurrence sampling (Altmann, 1974). Data on submissive pant grunt vocalizations were then used to calculate daily Elo-rating scores (Neumann et al., 2011). Thus, for each urinary cortisol measurement of a given day a corresponding dominance score was assigned. All scores were standardized to values between 0 (lowest rank) and 1 (highest rank), so that scores were comparable between groups. (ii) HPA axis functioning changes in the course of the life-history of several primate species (e.g., Goncharova and Lapin, 2002; Seraphin et al., 2006). Therefore, we calculated the male’s age (in years) at the time a given sample was collected. (iii) From the demographic data, we calculated the group size (including adult individuals only) and the ratio of the number of adult males to the number of adult females (Table 1), as larger groups as well as a skew toward more males and fewer females may increase competition and male-male aggression and therefore result in higher glucocorticoid levels (Pride, 2005; Raouf et al., 2006). (iv) Apart from these social influences, ecological factors are related to changes in glucocorticoid levels. Changes in rainfall and temperature are associated with differential energetic demands for an individual, resulting in changes in excreted glucocorticoid levels (Muller and Wrangham, 2004; Bales et al., 2006; Gesquiere et al., 2008; Emery Thompson et al., 2010; MacLarnon et al., 2015). Using the field sites’ long-term temperature and rainfall data, we calculated average temperature and average precipitation per month for each year. Temperature varied relatively little within years (in Budongo: range=21.15–24.07◦C, average= 22.29◦C,
SD=0.77); in Taï: range=21.95–24.06◦C, average= 23.19◦C,
[image:4.595.46.551.606.687.2]SD=0.68), precipitation in Budongo (average rainfall 5.09 mm,
TABLE 1 |Overview of data collection periods and demographic records by chimpanzee communities.
Site Group identity Data collection timespan
Number of data collection months
Number of adult males (mean±SD)
Number of adult females (mean±SD)
Mean (±SD) group size
Mean (±SD) sex ratio
Budongo Sonso 2006–2009 39 15.77±1.48 28.24±1.55 44.01±1.61 0.56±0.07 Taï East 2007–2015 34 5.67±0.63 11.05±2.39 16.72±2.65 0.53±0.11
Taï North 2005–2008 13 2.41±0.51 7.06±1.48 9.47±1.37 0.36±0.12 Taï South 2004–2015 44 7.86±1.06 16.33±2.53 24.18±1.82 0.50±0.15
SD = 2.25), and Taï (4.99 mm, SD = 3.81) (more details in Table S4).
Data Preparations, Models, and Statistical
Analysis
Urinary cortisol measures corrected for creatinine levels [LCMS measurement of urinary cortisol (pg/µl) divided by creatinine
measurement (mg/ml) of the same sample] of adult male chimpanzees were log-transformed. The time a sample was collected was transformed into minutes since midnight and then mean centered and standardized two standard deviation units. Magnitude and sign of estimates of variance in reaction norm components are influenced by the measure and scale of the external or internal gradient used (Gelman, 2008). Therefore, we mean centered all control variables and standardized them to two standard deviation units (Araya-Ajoy et al., 2015).
We used random regression mixed-effect models (model structures also presented in Table S5 in the Supplementary Material) to study individual differences in cortisol levels throughout the day (Nussey et al., 2007). The response variable in all models was the log-transformed urinary cortisol measures corrected for creatinine. The following variables were added to all models: (i) since we could not expect a linear relationship between the time of day a sample was collected and urinary cortisol levels (Kumar, 2017), we added linear and quadratic effects of time of day to model the circadian rhythm in cortisol secretion; (ii) the dominance rank of each male on the day the urine sample was collected, (iii) the age of the male (in years) on the day the sample was collected (iv) the sex ratio of the day in the group, (v) group identity, (vi) monthly average rainfall in interaction with the time of day (higher glucocorticoid levels at times of high fruit availability (associated to higher precipitation) only in the morning, but not in the afternoon, (Muller and Lipson, 2003; Muller and Wrangham, 2004), and (vii) monthly average temperature measures. Community size was not included in the model as a control variable, as it correlated with the sex ratio (Spearman correlation: rs−0.06, p= 0.012). To control for across years or months variation in social or ecological parameters not captured by the main effect control variables, we added random intercepts for years and months. As urinary cortisol measures derived from different research projects, we added a random intercept term for dataset to control for potential biases introduced by dataset variation.
To estimate trait repeatability, we added random intercepts for individuals to the first model (intercept model). A log-likelihood test comparing this model with a model excluding the random intercept for individual males revealed a significant effect of the individual male intercept (Chi-square = 11.57,
df =1,p=0.001), indicating that males differ from each other in their average urinary cortisol expression. Since individuals were sampled repeatedly across the circadian gradient over years, we created a dummy variable (“male-year”), composed of male identity and sampling year, and included a random intercept for this variable too (the dummy variable “male year” encompassed 96 different male-year combinations). This allowed us to estimate short- (within year) and long-term (between years)
between individual variation in urinary cortisol levels ( Araya-Ajoy et al., 2015). To calculatereaction norm repeatability, we build a second model (slope model): in addition to random intercepts for individuals and the dummy variable “male-year,” we included random slopes for the time and its quadratic term. A log-likelihood test comparing this model and a model excluding the random slopes for individual males and the dummy variable “male-year” revealed that males differed in the plasticity of their circadian cortisol levels (Chi-square=20.38,df=10,p=0.026). Variance estimates of the random intercept and random slope models were used to calculate the repeatability of the reaction norm components.
Using the estimated variances of the random effects of these models, we calculated short- and long-term trait repeatability and repeatability of average reaction norms and reaction norm plasticity in urinary cortisol levels.Table 2gives an overview on how repeatability was calculated.
All data transformations, models, and repeatability analyses were done using RStudio (Version 1.0.136–© 2009–2016 RStudio, Inc.). Models were built and run using the lme4 package (Bates et al., 2014). Trait repeatabilities were estimate following Nakagawa and Schielzeth (2010)and reaction norm repeatabilites followingAraya-Ajoy et al. (2015).
RESULTS
[image:5.595.305.550.497.638.2]In a first step, we fitted a model including all main effects but excluding all random effects to test for potential model inflation. The model inflation factor was 1.47, indicating no issues with multicollinearity. Visual inspection of residuals’ histograms, qq-plots of residuals, and qq-plots showing residuals against fitted values for the complete intercept and slope model suggested that all assumptions for Gaussian random regression mixed-effect
TABLE 2 |Calculating reaction norm (average reaction norm and plasticity) and trait repeatability in urinary cortisol levels (followingDingemanse and
Dochtermann, 2013andAraya-Ajoy et al., 2015).
Repeatability for Calculated as
Trait repeatability of urinary cortisol levels across years
Intercept variance/total variance
Trait repeatability of urinary cortisol levels within years
(intercept variance+intercept male year variance)/total variance
Reaction norm repeatability of average reaction norms between males
Intercept variance/(intercept male+intercept male year)
Reaction norm repeatability of plasticity between males
Slope variance/(slope male+slope male year)
models were met. The results for the two models are shown in Table 3(further results for the control variables are presented in the Supplementary Material, Table S6). Exclusion of the quadratic effect of time of day did not alter the results (the model excluding the quadratic effect of time of day terms is presented in the Supplementary Material, Table S7).
Trait repeatability of urinary cortisol levels was 0.11 (lower confidence interval (lCI) = 0.07, upper confidence interval (uCI) = 0.17) between years and 0.19 (lCI = 0.14, uCI =0.24) within years. This suggests low trait repeatability of urinary cortisol levels between and within years. The long-term repeatability score represents the fraction of variation caused by genes and stable environmental factors (permanent environmental effects). The difference between short- and long-term repeatability (0.07) points at some differences in average cortisol levels between individuals, generated by environmental conditions that differed between individuals and varied between years. A log-likelihood test comparing the random intercept and the random slope model revealed a significant impact of the random slopes (Chi-square= 20.38,df = 10,p= 0.026), suggesting that individuals’ daily urinary cortisol excretion profiles differ from each other. Repeatability of reaction norm intercepts in urinary cortisol levels was 0.81 (lCI = 0.71, uCI = 0.88) and repeatability of urinary cortisol plasticity was 0.31 (lCI = 0.20, uCI = 0.43) for the linear term and 0.65 (lCI = 0.65, uCI = 0.65) for the quadratic term. Thus, males differed relatively consistently in average reaction norms and reaction norm plasticity in urinary cortisol levels across years. A visual presentation of individual male reaction norms is presented in Figure 1 (for the circadian gradient).
DISCUSSION
The populations of wild male chimpanzees in our study exhibited relatively low trait repeatability in urinary cortisol levels. Across and within year repeatability was comparable to repeatability scores reported in other studies on between individual variation in glucocorticoid levels (e.g.,Baugh et al., 2014) and behavioral traits (reviewed byBell et al., 2009). While the studies revealing similar levels of between individual glucocorticoid repeatability as our study used comparably short sampling periods (spanning over days or months), the data presented here accumulated over several years. Short-term repeated sampling can lead to higher repeatability estimates compared to longer sampling periods (Hau et al., 2016). Thus, trait repeatability in adult male chimpanzee urinary cortisol levels can be regarded as being higher than expected.
When comparing short- and long-term trait repeatability of cortisol levels in adult male chimpanzees, we found that short-term repeatability was in fact higher within years (0.19) than between years (0.12). On the one hand this indicates the necessity to consider the duration of sampling regimes when interpreting results, in particular when data are available for a short period of time only. On the other hand, it points to another interesting aspect: there seemed to be environmental factors that affected
TABLE 3 |Results for the random effects of the fitted models.
Random intercept model
Random slope model
Fixed effects β(95% CI) β(95% CI)
Intercept 4.23 (3.70, 4.75) 4.23 (3.73, 4.74)
Time −0.59 (−0.65,−0.53) −0.56 (−0.67,−0.47) Time squared −0.22 (−0.34,−0.09) −0.22 (−0.39,−0.06)
Dominance rank 0.09 (−0.05, 0.25) 0.09 (−0.06, 0.24) Sex ratio −0.29 (−0.45,−0.14) −0.29 (−0.44,−0.13)
Age at sample 0.24 (0.06, 0.43) 0.17 (−0.02, 0.35)
Group identity −0.39 (−1.09, 0.24) −0.38 (−1.02, 0.27) Rainfall −0.03 (−0.12, 0.05) −0.03 (−0.11, 0.06)
Temperature −0.14 (−0.25,−0.02) −0.14 (−0.25,−0.02) Rainfall * time 0.11 (0.00, 0.21) 0.08 (−0.02, 0.20)
RANDOM EFFECTS
Variance male-ID intercept 0.06 (0.04, 0.10) 0.18 (0.10, 0.29) Variance male-ID slope for
time
0.02 (0.01, 0.03)
Variance male-ID slope for time squared
0.02 (0.02, 0.02)
Variance male-year intercept
0.04 (0.03, 0.05) 0.04 (0.03, 0.05)
Variance male-year slope for time
0.05 (0.04, 0.07)
Variance male-year slope for time squared
0.01 (0.01, 0.01)
Variance year 0.01 (0.00, 0.02) 0.01 (0.00, 0.01)
Variance month 0.04 (0.02, 0.08) 0.05 (0.02, 0.10) Residual variance 0.38 (0.36, 0.41) 0.37 (0.35, 0.40)
Variances of the “random intercept model” were used to estimate trait repeatability of urinary cortisol levels. Variances of the “random slopes model” were used to estimate repeatability of urinary cortisol reaction norms (average reaction norm and plasticity). Results are based on 1,901 urine samples of 30 adult males. These data stem from ten different years and from seven different datasets. The dummy variable “male year” encompassed 96 different male-year combinations.
individual adult males differently and that varied more strongly between years than within years. A challenge for future research will be to determine which factors these are and what their biological or ecological implications may be. Similar to trait repeatability scores, short-time intervals of repeated sampling tend to reveal higher repeatability for reaction norms of labile traits than examinations over longer periods (Hau et al., 2016). Therefore, making use of long term data collection and extensive repeated sampling has the potential to gain more insight into the level of reaction norm consistency in glucocorticoid levels and plasticity (but seeMartin et al., 2011; van de Pol, 2012). For a range of mammal species, particularly non-human primates, such data are becoming available thanks to the continuous scientific work at various long term field sites, such as the Tai Chimpanzee Project (https://www.eva.mpg.de/primat/research-groups/chimpanzees/field-sites/tai-chimpanzee-project.html).
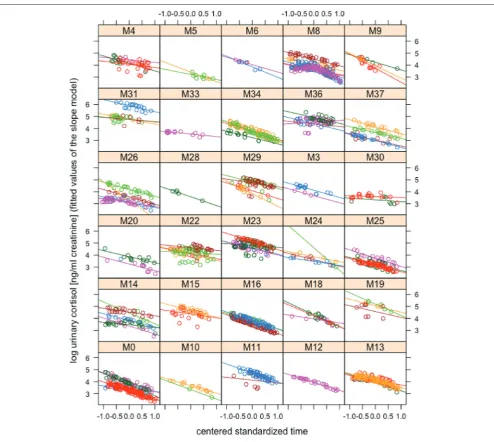
FIGURE 1 |Reaction norms of urinary cortisol levels. Log-transformed urinary cortisol concentrations (ng/ml creatinine) are plotted against the mean centered standardized time gradient based on the fitted values obtained from the “slope model.” Each box contains data of one individual. Differently colored lines and dots in individual boxes represent data from different “male-years.” While all males show a steady decrease in urinary cortisol levels across the day, they differ from each other in urinary cortisol intercepts and slopes: e.g., male M31 (first box in the second row from top) has higher average urinary cortisol levels than male M34 (third box in the second row from top) and male M22 (second box in the fourth row from top) shows a relatively flat decrease in urinary cortisol levels as compared to male M0 (first box in the bottom row). Crucially, these differences in average expression and shape of the circadian urinary cortisol rhythm between males show consistency across years (repeatable across years).
both reaction norm intercept (0.81) and reaction norm plasticity (0.31 and 0.65 for slopes over the linear and the quadratic term for time) in urinary cortisol levels. This result shows that adult male chimpanzees are relatively consistent in their cortisol excretion patterns—at least over the circadian gradient—and that individuals differ consistently from each other in both average cortisol reaction norms and in the shape of their circadian urinary cortisol rhythm. As can be seen inFigure 1, all males show a decrease in urinary cortisol levels across the day. This is consistent with what would be expected from the literature
Estimating variation in reaction norm slope parameters requires repeated measures of the phenotype across an environmental gradient, but the exact level of replication depends on the particularities of each study. To check for the robustness of our approach we used statistical simulations tailored to estimate the probability to detected significant results in a scenario where our data would show no variation in reaction norm slopes. We simulated data with the same structure as the actual data, but in the simulated dataset we assumed absence of variance in urinary cortisol levels in the slopes for individual males and the dummy variable “male-year.” If the results we reported were not spurious, the variance estimated from the model applied to the simulated data should be smaller than the variance estimated from the actual data (seeAraya-Ajoy and Dingemanse, 2017for a similar approach). We ran 1,000 simulations and estimated the probability that the observed variance estimated for the actual data was equal or smaller than the variance estimated for the simulated data (with no variation in reaction norm slopes). Furthermore, to estimate potential bias due to our unbalanced dataset (some males are represented with more samples, over more years, than others, also apparent inFigure 1), we simulated data with the exact structure as the actual data and used the parameters of the model results. Thus, analysis of the simulated data should provide the same estimates as the models applied to the real data. The deviations from the parameters applied to the real data and the simulated data are the bias associated to the sample size and structure of the data. Levels of bias due to data structure and sample size were low (deviations of parameter estimates of simulated and actual data: time slope in individual=0.22; quadratic time term in individual=0.03; time in male year=0.19; quadratic time term in male year=0.04). We found that the probability that our estimates were the result of the data structure and chance was always lower than 0.05. Therefore, the parameter estimates of variance in slopes are significant but their values need to be taken with care.
What may be the biological implications of such between individual differences? Differences in the circadian rhythm of cortisol have been reported for different chronotypes for instance: in humans, evening-types show lower morning arousal and a delay in peak cortisol levels in the morning as compared to morning types (e.g.,Bailey and Heitkemper, 1991). Also, differential exposure to stressors has been associated to differences in circadian patterns of cortisol in humans (e.g., Adam and Gunnar, 2001). In male chimpanzees, different life-history strategies may be associated with the patterns observed: males may face different levels of (inter- and intra-group) competition and aggression, and consequently be exposed to different (levels) of stressors, which may be reflected in different urinary cortisol reaction norms. A next step would be to compare repeatability of urinary cortisol levels over other gradients and contexts, such as gradients of differential food availability or social group stability. Two main scenarios of how individuals respond to diverse gradients are possible: (i) individuals could show very consistent glucocorticoid responses to any given stimulus that affects its metabolic rate, and therefore, they could express similar levels of average and plastic glucocorticoid responses across conditions. (ii) Variation in glucocorticoid
levels could also result in divergent glucocorticoid responses to different conditions if differences in neural processing of (experienced or anticipated) external and internal stimuli emerge (e.g.,Hau et al., 2016).
While the mechanisms behind glucocorticoid excretion patterns are relatively well-studied, comparably little is known about the ultimate implications of different glucocorticoid profiles (Beehner and Bergman, 2017). Evaluating consistency in individual cortisol levels promises to reveal links between a hormonal trait and fitness measures. For instance, Ouyang et al. (2011b) found that house sparrows that had high corticosterone levels before egg laying and low corticosterone levels during breeding exhibited enhanced reproductive success. Thus, plasticity in corticosterone levels was related to increased fitness. So far, a couple of studies have revealed relationships between hormones, behavior, and fitness in wild animals and suggest a genetic basis of corticosterone profiles (for a review seeZera et al., 2007). Long-term studies using a reaction norm approach in wild populations have great potential to shed light on fitness implications of between and within individual variation in glucocorticoid profiles.Dingemanse et al. (2010b)proposed to assess the covariance of fitness proxies with intercepts and slopes of reaction norms. This will further our understanding of the relationship between fitness outcomes and glucocorticoid excretion patterns. Glucocorticoids are amongst the best studied hormones in behavioral endocrinology, probably due to the multitude of processes that glucocorticoids are involved in and owing to well-established methods for analysis (Schwarzenberger et al., 1996; Heistermann, 2010; Creel et al., 2013; Murtagh et al., 2013; Behringer and Deschner, 2017). However, particularly in non-human primates, studies investigating the relationship between fitness and glucocorticoids are lacking (Beehner and Bergman, 2017). Combining approaches from evolutionary ecology and behavioral endocrinology may prove a fruitful path in this endeavor. Here, we have aimed to take a first step into this direction by showing that male chimpanzees are consistent in the expression of their urinary cortisol reaction norms. The crucial next step will be to relate this variation in a physiological trait to fitness parameters such as reproductive success, survival, or morbidity. We hope that research uniting patterns of variation in physiological traits and fitness measures will accelerate further.
heritability and repeatability of physiological measures, such as glucocorticoids, questions about the role of selection will likely be answered in the future.
AUTHOR CONTRIBUTIONS
RS and VB: conception of the study; TD, AP, LS, ZZ, CG, RW, and CC: data collection; RS and YA-A: statistical analysis and interpretation; RS and VB: drafting of the manuscript; RS, YA-A, VB, TD, PT, PF, AP, LS, ZZ, CG, KZ, RW, and CC: revising manuscript and final approval.
FUNDING
This research was funded by The European Research Council (ERC) under the European Union’s Horizon 2020 research and innovation program (Grant Agreement No 679787), awarded to CC and the Research Council of Norway (SFF-III 223257/F50).
ACKNOWLEDGMENTS
We like to thank Alexander Mielke for making the R code to calculate ELO ranks available. We thank the Ministries for Research and Environment of Ivory Coast, the Office Ivorien des Parcs et Reserves, the Uganda Wildlife Authority, and the Uganda National Council for Science and Technology for permission to conduct research. We are grateful to the Centre Suisse de Recherches Scientifiques, the staff members of the Taï Chimpanzee Project and the Budongo Conservation Field Station for continuous support and collection of long-term data and the members of the DFG Researcher Unit (FOR 2136) Sociality and Health in Primates for discussions.
SUPPLEMENTARY MATERIAL
The Supplementary Material for this article can be found online at: https://www.frontiersin.org/articles/10.3389/fevo. 2018.00085/full#supplementary-material
REFERENCES
Adam, E. K., and Gunnar, M. R. (2001). Relationship functioning and home and work demands predict individual differences in diurnal cortisol patterns in women. Psychoneuroendocrinology 26, 189–208. doi: 10.1016/S0306-4530(00)00045-7
Aizer, A., Stroud, L., and Buka, S. (2015). Maternal stress and child outcomes: evidence from siblings.J. Hum. Resour.51, 523–555. doi: 10.3386/w18422 Altmann, J. (1974). Observational study of behavior: sampling methods.Behaviour
49, 227–267. doi: 10.1163/156853974X00534
Anestis, S. F. (2005). Behavioral style, dominance rank, and urinary cortisol in young chimpanzees (Pan troglodytes). Behaviour 142, 1245–1268. doi: 10.1163/156853905774539418
Anestis, S. F., Bribiescas, R. G., and Hasselschwert, D. L. (2006). Age, rank, and personality effects on the cortisol sedation stress response in young chimpanzees.Physiol. Behav.89, 287–294. doi: 10.1016/j.physbeh.2006.06.010 Araya-Ajoy, Y. G., and Dingemanse, N. J. (2017). Repeatability, heritability, and
age-dependence of seasonal plasticity in aggressiveness in a wild passerine bird. J. Anim. Ecol.86, 227–238. doi: 10.1111/1365-2656.12621
Araya-Ajoy, Y. G., Mathot, K. J., and Dingemanse, N. J. (2015). An approach to estimate short-term, long-term and reaction norm repeatability.Methods Ecol. Evol.6, 1462–1473. doi: 10.1111/2041-210X.12430
Bahr, N. I., Palme, R., Mohle, U., Hodges, J. K., and Heistermann, M. (2000). Comparative aspects of the metabolism and excretion of cortisol in three individual nonhuman primates.Gen. Comp. Endocrinol.117, 427–438. doi: 10.1006/gcen.1999.7431
Bailey, S. L., and Heitkemper, M. M. (1991). Morningness-eveningness and early-morning salivary cortisol levels. Biol. Psychol. 32, 181–192. doi: 10.1016/0301-0511(91)90009-6
Bales, K. L., French, J. A., McWilliams, J., Lake, R. A., and Dietz, J. M. (2006). Effects of social status, age, and season on androgen and cortisol levels in wild male golden lion tamarins (Leontopithecus rosalia).Horm. Behav.49, 88–95. doi: 10.1016/j.yhbeh.2005.05.006
Bartter, F., Delea, C. S., and Halberg, F. (1962). A map of blood and urinary changes related to circadian variations in adrenal cortical function in normal subjects. Ann. N. Y. Acad. Sci.98, 969–983. doi: 10.1111/j.1749-6632.1962.tb30612.x Bates, D., Maechler, M., Bolker, B., and Walker, S. (2014).lme4: Linear
Mixed-Effects Models Using Eigen and S4. R Package Version 1, 1–7.
Baugh, A. T., Oers, K., van, Dingemanse, N. J., and Hau, M. (2014). Baseline and stress-induced glucocorticoid concentrations are not repeatable but covary within individual great tits (Parus major). Gen. Comp. Endocrinol. 208, 154–163. doi: 10.1016/j.ygcen.2014.08.014
Beehner, J. C., and Bergman, T. J. (2017). The next step for stress research in primates: to identify relationships between glucocorticoid secretion and fitness. Horm. Behav.91, 68–83. doi: 10.1016/j.yhbeh.2017.03.003
Behringer, V., and Deschner, T. (2017). Non-invasive monitoring of physiological markers in primates.Horm. Behav.91, 3–18. doi: 10.1016/j.yhbeh.2017.02.001 Bell, A. M., Hankison, S. J., and Laskowski, K. L. (2009). The
repeatability of behaviour: a meta-analysis. Anim. Behav. 77, 771–783. doi: 10.1016/j.anbehav.2008.12.022
Berghänel, A., Heistermann, M., Schülke, O., and Ostner, J. (2016). Prenatal stress effects in a wild, long-lived primate: predictive adaptive responses in an unpredictable environment.Proc. R. Soc. B Biol. Sci.283:20161304. doi: 10.1098/rspb.2016.1304
Boesch, C., and Boesch-Achermann, H. (2000).The Chimpanzees of the Taï Forest: Behavioural Ecology and Evolution. New York, NY: Oxford University Press. Bonier, F., Martin, P. R., Moore, I. T., and Wingfield, J. C. (2009). Do
baseline glucocorticoids predict fitness? Trends Ecol. Evol. 24, 634–642. doi: 10.1016/j.tree.2009.04.013
Botero, C. A., Weissing, F. J., Wright, J., and Rubenstein, D. R. (2015). Evolutionary tipping points in the capacity to adapt to environmental change.Proc. Natl. Acad. Sci. U.S.A.112, 184–189. doi: 10.1073/pnas.1408589111
Brommer, J. E. (2013). Phenotypic plasticity of labile traits in the wild.Curr. Zool. 59, 485–505. doi: 10.1093/czoolo/59.4.485
Caldji, C., Diorio, J., and Meaney, M. J. (2000). Variations in maternal care in infancy regulate the development of stress reactivity.Biol. Psychiatry48, 1164–1174. doi: 10.1016/S0006-3223(00)01084-2
Cockrem, J. F. (2013). Individual variation in glucocorticoid stress responses in animals.Gen. Comp. Endocrinol.181, 45–58. doi: 10.1016/j.ygcen.2012.1 1.025
Cockrem, J. F., and Silverin, B. (2002). Variation within and between birds in corticosterone responses of great tits (Parus major).Gen. Comp. Endocrinol. 125, 197–206. doi: 10.1006/gcen.2001.7750
Creel, S., Dantzer, B., Goymann, W., Rubenstein, D. R., and Boonstra, R. (2013). The ecology of stress: effects of the social environment.Funct. Ecol.27, 66–80. doi: 10.1111/j.1365-2435.2012.02029.x
Crockford, C., Wittig, R. M., Langergraber, K., Ziegler, T. E., Zuberbühler, K., and Deschner, T. (2013). Urinary oxytocin and social bonding in related and unrelated wild chimpanzees.Proc. R. Soc. B Biol. Sci. U.S.A.280:20122765. doi: 10.1098/rspb.2012.2765
Dingemanse, N. J., and Dochtermann, N. A. (2013). Quantifying individual variation in behaviour: mixed-effect modelling approaches.J. Anim. Ecol.82, 39–54. doi: 10.1111/1365-2656.12013
Dingemanse, N. J., and Wolf, M. (2013). Between-individual differences in behavioural plasticity within populations: causes and consequences.Anim. Behav.85, 1031–1039. doi: 10.1016/j.anbehav.2012.12.032
Dingemanse, N. J., Edelaar, P., and Kempenaers, B. (2010a). Why is there variation in baseline glucocorticoid levels? Trends Ecol. Evol. 25, 261–262. doi: 10.1016/j.tree.2010.0 1.008
Dingemanse, N. J., Kazem, A. J., Réale, D., and Wright, J. (2010b). Behavioural reaction norms: animal personality meets individual plasticity.Trends Ecol. Evol.25, 81–89. doi: 10.1016/j.tree.2009.07.013
Dochtermann, N. A., Schwab, T., and Sih, A. (2015). The contribution of additive genetic variation to personality variation: heritability of personality.Proc. R Soc. B282:20142201. doi: 10.1098/rspb.2014.2201
Edwards, L. J., Bryce, A. E., Coulter, C. L., and McMillen, I. C. (2002). Maternal undernutrition throughout pregnancy increases adrenocorticotrophin receptor and steroidogenic acute regulatory protein gene expression in the adrenal gland of twin fetal sheep during late gestation.Mol. Cell. Endocrinol.196, 1–10. doi: 10.1016/S0303-7207(02)00256-3
Emery Thompson, M., Muller, M. N., Kahlenberg, S. M., and Wrangham, R. W. (2010). Dynamics of social and energetic stress in wild female chimpanzees. Horm. Behav.58, 440–449. doi: 10.1016/j.yhbeh.2010.05.009
Erb, R. E., Tillson, S. A., Hodgen, G. D., and Plotka, E. D. (1970). Urinary creatinine as an index compound for estimating rate of excretion of steroids in the domestic sow.J. Anim. Sci.30, 79–85. doi: 10.2527/jas1970.30179x
Flinn, M. V., Nepomnaschy, P. A., Muehlenbein, M. P., and Ponzi, D. (2011). Evolutionary functions of early social modulation of hypothalamic-pituitary-adrenal axis development in humans.Neurosci. Biobehav. Rev.35, 1611–1629. doi: 10.1016/j.neubiorev.2011.01.005
Forsman, A. (2015). Rethinking phenotypic plasticity and its consequences for individuals, populations and species. Heredity 115, 276–284. doi: 10.1038/hdy.2014.92
Francis, D. D., and Meaney, M. J. (1999). Maternal care and the development of stress responses. Curr. Opin. Neurobiol. 9, 128–134. doi: 10.1016/S0959-4388(99)80016-6
Fraser, O. N., Stahl, D., and Aureli, F. (2008). Stress reduction through consolation in chimpanzees.Proc. Natl. Acad. Sci. U.S.A.105, 8557–8562. doi: 10.1073/pnas.0804141105
Gelman, A. (2008). Scaling regression inputs by dividing by two standard deviations.Stat. Med.27, 2865–2873. doi: 10.1002/sim.3107
Gesquiere, L. R., Khan, M., Shek, L., Wango, T. L., Wango, E. O., Alberts, S. C., et al. (2008). Coping with a challenging environment: effects of seasonal variability and reproductive status on glucocorticoid concentrations of female baboons (Papio cynocephalus). Horm. Behav. 54, 410–416. doi: 10.1016/j.yhbeh.2008.04.007
Goncharova, N. D., and Lapin, B. A. (2002). Effects of aging on hypothalamic– pituitary–adrenal system function in non-human primates.Mech. Ageing Dev. 123, 1191–1201. doi: 10.1016/S0047-6374(02)00012-X
Hau, M., Casagrande, S., Ouyang, J. Q., and Baugh, A. T. (2016). “Chapter two - glucocorticoid-mediated phenotypes in vertebrates: multilevel variation and evolution,” inAdvances in the Study of Behavior, eds J. C. M. Marc Naguib Leigh, W.Simmons, L. Barrett, S. Healy and M. Zuk (New York, NY: Academic Press), 41–115.
Hauser, B., Deschner, T., and Boesch, C. (2008). Development of a liquid chromatography–tandem mass spectrometry method for the determination of 23 endogenous steroids in small quantities of primate urine.J. Chromatogr. B 862, 100–112. doi: 10.1016/j.jchromb.2007.11.009
Heistermann, M. (2010). Non-invasive monitoring of endocrine status in laboratory primates: methods, guidelines and applications.Adv. Sci. Res.5, 1–9. doi: 10.5194/asr-5-1-2010
Hodges, J. K., and Heistermann, M. (2003). “Field endocrinology: monitoring hormonal changes in free-ranging primates,” in eds J. M. Setchell and D. J. Curtis (Cambridge: Cambridge University Press), 353–370.
Hruschka, D. J., Kohrt, B. A., and Worthman, C. M. (2005). Estimating between-and within-individual variation in cortisol levels using multilevel models. Psychoneuroendocrinology30, 698–714. doi: 10.1016/j.psyneuen.2005.03.002
Knackstedt, M. K., Hamelmann, E., and Arck, P. C. (2005). Mothers in stress: consequences for the offspring.Am. J. Reprod. Immunol.54, 63–69. doi: 10.1111/j.1600-0897.2005.00288.x
Kraan, G. P. B., Dullaart, R. P. F., Pratt, J. J., Wolthers, B. G., Drayer, N. M., and de Bruin, R. (1998). The daily cortisol production reinvestigated in healthy men. the serum and urinary cortisol production rates are not significantly different. J. Clin. Endocrinol. Metab.83, 1247–1252. doi: 10.1210/jc.83.4.1247
Kumar, V. (2017).Biological Timekeeping: Clocks, Rhythms and Behaviour. New Delhi: Springer.
Lendvai, Á. Z., Giraudeau, M., Bókony, V., Angelier, F., and Chastel, O. (2015). Within-individual plasticity explains age-related decrease in stress response in a short-lived bird.Biol. Lett.11:20150272. doi: 10.1098/rsbl.2015.0272 Linkowski, P., Onderbergen, A. V., Kerkhofs, M., Bosson, D., Mendlewicz, J., and
Cauter, E. V. (1993). Twin study of the 24-h cortisol profile: evidence for genetic control of the human circadian clock.Am. J. Physiol. Endocrinol. Metab.264, E173–E181. doi: 10.1152/ajpendo.1993.264.2.E173
Liu, D., Diorio, J., Tannenbaum, B., Caldji, C., Francis, D., Freedman, A., et al. (1997). Maternal care, hippocampal glucocorticoid receptors, and hypothalamic-pituitary-adrenal responses to stress.Science277, 1659–1662. doi: 10.1126/science.277.5332.1659
MacLarnon, A. M., Sommer, V., Goffe, A. S., Higham, J. P., Lodge, E., Tkaczynski, P., et al. (2015). Assessing adaptability and reactive scope: introducing a new measure and illustrating its use through a case study of environmental stress in forest-living baboons.Gen. Comp. Endocrinol.215, 10–24. doi: 10.1016/j.ygcen.2014.09.022
Martin, J. G. A., Nussey, D. H., Wilson, A. J., and Réale, D. (2011). Measuring individual differences in reaction norms in field and experimental studies: a power analysis of random regression models.Methods Ecol. Evol.2, 362–374. doi: 10.1111/j.2041-210X.2010.00084.x
Martin, J. G., Pirottay, E., Petellez, M. B., and Blumstein, D. T. (2017). Genetic basis of between-individual and within-individual variance of docility.J. Evol. Biol. 30, 796–805. doi: 10.1111/jeb.13048
McCormick, G. L., Robbins, T. R., Cavigelli, S. A., and Langkilde, T. (2017). Ancestry trumps experience: transgenerational but not early life stress affects the adult physiological stress response.Horm. Behav.87, 115–121. doi: 10.1016/j.yhbeh.2016.11.010
Miller, M. W., Hobbs, N. T., and Sousa, M. C. (1991). Detecting stress responses in Rocky Mountain bighorn sheep (Ovis canadensis canadensis): reliability of cortisol concentrations in urine and feces. Can. J. Zool. 69, 15–24. doi: 10.1139/z91-003
Muehlenbein, M. P., and Watts, D. P. (2010). The costs of dominance: testosterone, cortisol and intestinal parasites in wild male chimpanzees.Biopsychosoc. Med. 4:21. doi: 10.1186/1751-0759-4-21
Muller, M. N., and Lipson, S. F. (2003). Diurnal patterns of urinary steroid excretion in wild chimpanzees. Am. J. Primatol. 60, 161–166. doi: 10.1002/ajp.10103
Muller, M. N., and Wrangham, R. W. (2004). Dominance, cortisol and stress in wild chimpanzees (Pan troglodytes schweinfurthii).Behav. Ecol. Sociobiol.55, 332–340. doi: 10.1007/s00265-003-0713-1
Murray, C. M., Stanton, M. A., Wellens, K. R., Santymire, R. M., Heintz, M. R., and Lonsdorf, E. V. (2016). Maternal effects on offspring stress physiology in wild chimpanzees: chimpanzee maternal effects on offspring stress.Am. J. Primatol. 36, 473–488. doi: 10.1007/s10764-015-9836-2
Murtagh, R., Behringer, V., and Deschner, T. (2013). LC-MS as a method for non-invasive measurement of steroid hormones and their metabolites in urine and faeces of animals.Wien Tierärztl Monatsschrift100, 247–254.
Nakagawa, S., and Schielzeth, H. (2010). Repeatability for Gaussian and non-Gaussian data: a practical guide for biologists. Biol. Rev. 85, 935–956. doi: 10.1111/j.1469-185X.2010.00141.x
Narayan, E. J., and Hero, J. M. (2013). Repeatability of baseline corticosterone and acute stress responses to capture, and patterns of reproductive hormones in vitellogenic and non-vitellogenic female fijian ground frog (Platymantis vitiana).J. Exp. Zool. Part Ecol. Genet. Physiol.319, 471–481. doi: 10.1002/jez.1810
Nussey, D. H., Postma, E., Gienapp, P., and Visser, M. E. (2005). Selection on heritable phenotypic plasticity in a wild bird population.Science310, 304–306. doi: 10.1126/science.1117004
Nussey, D. H., Wilson, A. J., and Brommer, J. E. (2007). The evolutionary ecology of individual phenotypic plasticity in wild populations.J. Evol. Biol.20, 831–844. doi: 10.1111/j.1420-9101.2007.01300.x
Oswald, L. M., McCaul, M., Choi, L., Yang, X., and Wand, G. S. (2004). Catechol-O-methyltransferase polymorphism alters hypothalamic-pituitary-adrenal axis responses to naloxone: a preliminary report. Biol. Psychiatry55, 102–105. doi: 10.1016/j.biopsych.2003.07.003
Ouyang, J. Q., Hau, M., and Bonier, F. (2011a). Within seasons and among years: when are corticosterone levels repeatable?Horm. Behav.60, 559–564. doi: 10.1016/j.yhbeh.2011.08.004
Ouyang, J. Q., Sharp, P. J., Dawson, A., Quetting, M., and Hau, M. (2011b). Hormone levels predict individual differences in reproductive success in a passerine bird. Proc. R. Soc. Lond. B Biol. Sci. 278, 2537–2545. doi: 10.1098/rspb.2010.2490
Pflüger L. S., Gutleb, D. R., Hofer, M., Fieder, M., Wallner, B., and Steinborn, R. (2016). Allelic variation of the COMT gene in a despotic primate society: a haplotype is related to cortisol excretion inMacaca fuscata.Horm. Behav.78, 220–230. doi: 10.1016/j.yhbeh.2015.11.012
Piersma, T., and Drent, J. (2003). Phenotypic flexibility and the evolution of organismal design. Trends Ecol. Evol. 18, 228–233. doi: 10.1016/S0169-5347(03)00036-3
Plotsky, P. M., and Meaney, M. J. (1993). Early, postnatal experience alters hypothalamic corticotropin-releasing factor (CRF) mRNA, median eminence CRF content and stress-induced release in adult rats.Mol. Brain Res. 18, 195–200. doi: 10.1016/0169-328X(93)90189-V
Pride, R. E. (2005). Optimal group size and seasonal stress in ring-tailed lemurs (Lemur catta).Behav. Ecol.16, 550–560. doi: 10.1093/beheco/ari025 Purvis, A., and Harvey, P. H. (1995). Mammal life-history evolution: a comparative
test of Charnov’s model.J. Zool.237, 259–283.
Raouf, S. A., Smith, L. C., Brown, M. B., Wingfield, J. C., and Brown, C. R. (2006). Glucocorticoid hormone levels increase with group size and parasite load in cliff swallows.Anim. Behav.71, 39–48. doi: 10.1016/j.anbehav. 2005.03.027
Rensel, M. A., and Schoech, S. J. (2011). Repeatability of baseline and stress-induced corticosterone levels across early life stages in the Florida scrub-jay (Aphelocoma coerulescens). Horm. Behav. 59, 497–502. doi: 10.1016/j.yhbeh.2011.01.010
Reynolds, V. (2005).The Chimpanzees of the Budongo Forest: Ecology, Behaviour and Conservation. OUP Oxford
Roche, D. G., Careau, V., and Binning, S. A. (2016). Demystifying animal “personality” (or not): why individual variation matters to experimental biologists.J. Exp. Biol.219, 3832–3843. doi: 10.1242/jeb.146712
Romero, L. M., and Reed, J. M. (2008). Repeatability of baseline corticosterone concentrations. Gen. Comp. Endocrinol. 156, 27–33. doi: 10.1016/j.ygcen.2007.10.001
Romero, L. M., Dickens, M. J., and Cyr, N. E. (2009). The reactive scope model -a new model integr-ating homeost-asis, -allost-asis, -and stress.Horm. Behav.55, 375–389. doi: 10.1016/j.yhbeh.2008.12.009
Sapolsky, R. M., Romero, L. M., and Munck, A. U. (2000). How do glucocorticoids influence stress responses? Integrating permissive, suppressive, stimulatory, and preparative actions.Endocr. Rev.21, 55–89. doi: 10.1210/er.21.1.55 Schwarzenberger, F., Möstl, E., Palme, R., and Bamberg, E. (1996). Faecal
steroid analysis for non-invasive monitoring of reproductive status in farm, wild and zoo animals. Anim. Reprod. Sci. 42, 515–526. doi: 10.1016/0378-4320(96)01561-8
Seraphin, S. B., Whitten, P. L., and Reynolds, V. (2006). “The interaction of hormones with ecological factors in male Budongo forest chimpanzees,” inPrimates of Western Uganda Developments in Primatology: Progress and Prospects, eds N. E. Newton-Fisher, H. Notman, J. D. Paterson, and V. Reynolds (New York, NY: Springer), 93–104.
Small, T. W., and Schoech, S. J. (2015). Sex differences in the long-term repeatability of the acute stress response in long-lived, free-living Florida scrub-jays (Aphelocoma coerulescens). J. Comp. Physiol. B 185, 119–133. doi: 10.1007/s00360-014-0866-4
Thomas, M. V., Branscum, A., Miller, C. S., Ebersole, J., Al-Sabbagh, M., and Schuster, J. L. (2009). Within-subject variability in repeated measures of salivary analytes in healthy adults. J. Periodontol. 80, 1146–1153. doi: 10.1902/jop.2009.080654
van de Pol, M. (2012). Quantifying individual variation in reaction norms: how study design affects the accuracy, precision and power of random regression models.Methods Ecol. Evol.3, 268–280. doi: 10.1111/j.2041-210X.2011.00160.x Via, S., Gomulkiewicz, R., De Jong, G., Scheiner, S. M., Schlichting, C. D., and Van Tienderen, P. H. (1995). Adaptive phenotypic plasticity: consensus and controversy. Trends Ecol. Evol. 10, 212–217. doi: 10.1016/S0169-5347(00)89061-8
Villegas-Ríos, D., Réale, D., Freitas, C., Moland, E., and Olsen, E. M. (2017). Individual level consistency and correlations of fish spatial behaviour assessed from aquatic animal telemetry. Anim. Behav. 124, 83–94. doi: 10.1016/j.anbehav.2016.12.002
Weis, A. E., and Gorman, W. L. (1990). Measuring selection on reaction norms: an exploration of the eurosta-solidago system.Evolution44, 820–831. doi: 10.1111/j.1558-5646.1990.tb03807.x
Westneat, D. F., Wright, J., and Dingemanse, N. J. (2015). The biology hidden inside residual within-individual phenotypic variation.Biol. Rev.90, 729–743. doi: 10.1111/brv.12131
Wingfield, J. C. (2013). The comparative biology of environmental stress: behavioural endocrinology and variation in ability to cope with novel, changing environments. Anim. Behav. 85, 1127–1133. doi: 10.1016/j.anbehav.2013.02.018
Wittig, R. M., and Boesch, C. (2003). Food competition and linear dominance hierarchy among female chimpanzees of the Taï National Park.Int. J. Primatol. 24, 847–867. doi: 10.1023/A:1024632923180
Wittig, R. M., Crockford, C., Weltring, A., Langergraber, K. E., Deschner, T., and Zuberbühler, K. (2016). Social support reduces stress hormone levels in wild chimpanzees across stressful events and everyday affiliations.Nat. Commun. 7:13361. doi: 10.1038/ncomms13361
Zera, A. J., Harshman, L. G., and Williams, T. D. (2007). Evolutionary endocrinology: the developing synthesis between endocrinology and evolutionary genetics. Annu. Rev. Ecol. Evol. Syst. 38, 793–817. doi: 10.1146/annurev.ecolsys.38.091206.095615
Conflict of Interest Statement: The authors declare that the research was conducted in the absence of any commercial or financial relationships that could be construed as a potential conflict of interest.