Imaging of crystalline and amorphous surface regions using
time-of-flight secondary-ion mass spectrometry (ToF-SIMS): applications for
pharmaceutical materials.
†Andreea Iuraş, †David J. Scurr, ‡Catherine Boissier, ‡Mark L. Nicholas, †Clive J. Roberts and
†*Morgan R. Alexander.
† Laboratory of Biophysics and Surface Analysis, University of Nottingham, Nottingham NG7 2RD, England ‡ AstraZeneca R&D Mölndal, Pepparedsleden 1, Mölndal, SE-431 83, Sweden
ABSTRACT: The structure of a material, in particular the extremes of crystalline and amorphous forms, significantly impacts ma-terial performance in numerous sectors such as semiconductors, energy storage and, in the subject of this paper, pharmaceutical products. To characterize the spatial distribution for crystalline-amorphous forms at the uppermost molecular surface layer, we per-formed time-of-flight secondary-ion mass spectroscopy (ToF-SIMS) measurements for quench-cooled amorphous and recrystal-lized samples of the drugs indomethacin, felodipine and acetaminophen. Polarized light microscopy was used to localize crystallinity induced in the samples under controlled conditions. Principal component analysis was used to identify the subtle changes in the ToF-SIMS spectra indicative of the amorphous and crystalline forms for each drug. The indicators of amorphous and crystalline surfaces were common in type across the three drugs, and could be explained in general terms of crystal packing and intermolecular bonding, leading to intramolecular chain scission in the formation of secondary ions. Less intramolecular scission occurred in the amorphous form, resulting in a greater intensity of molecular and dimer secondary ions. To test the generality of amorphous-crystalline differentiation using ToF-SIMS, a different recrystallization method was investigated where acetaminophen single crystals were recrystallized from supersaturated solutions. The findings indicated that the ability to assign the crystal-line/amorphous state of the sample using ToF-SIMS was insensitive to the recrystallization method. This demonstrates ToF-SIMS capabilities of detecting and mapping ordered crystalline and disordered amorphous molecular materials forms at micron spatial resolution in the uppermost surface of a material.
The order and disorder of molecules in a solid material af-fect its surface activity, electrical, optical and many more properties with an impact in numerous industrial sectors, such as semiconductors1, structural materials2, energy storage3 and pharmaceuticals4. In pharmaceutical manufacturing, there is an increasing drive to ensure the pharmaceutical products quality from the design stage5 by predicting and controlling the physi-cal, chemical and pharmacological interactions that affect the bioavailability of the pharmaceutical end product. One of the most common, undesirable, difficult to control and to predict phenomena during the production of solid dosage forms (e.g. granules, capsules, tablets and inhalable dry powders) is the crystalline-amorphous transformation.
Crystalline and amorphous materials impact the pharmaceu-tical end product4 by altering the chemical and physical stabil-ity, for example the kinetics of drug dissolution and the kinet-ics of recrystallization. Furthermore, crystalline and amor-phous materials distributed at the surface of pharmaceutical powder particles affect how particles interact with each other6, which in turn alters the powder behavior during aggregation or dispersion6-8. While the quantification of amorphous-crystalline materials has been investigated by numerous non-spatially resolved techniques9-11, spatial distribution is consid-erably more challenging to assess at the surface of materials.
Presently, only confocal Raman spectroscopy12,13 and atom-ic force matom-icroscopy (AFM)6 have been used to successfully localize amorphous areas. Although an excellent technique for
polymorphic form determination, confocal Raman has a sam-pling depth resolution of 1-2 μm14 that does not address the first nanometers where the particle-particle interaction occurs. AFM has surface specificity, however it also has drawbacks associated with time consuming data acquisition, a relatively small area of analysis (usually much less than 100 μm × 100 μm), a requirement for very flat samples and strong artefacts that can lead to erroneous identification of a material as amor-phous material6.
An alternative analytical technique is time-of-flight second-ary-ion mass spectrometry (ToF-SIMS), which is highly sur-face specific and exhibits an information depth of 2 atomic layers15 to 10 atomic layers16 (uppermost 0.5-3 nm, depending on the material), a lateral resolution greater than 200 nm and considerably shorter data acquisition time than Raman and AFM mapping.
For non-molecular materials such as metals, the removal of surface atoms due to energetic particle bombardment (sputter-ing) is known to be strongly influenced by the crystalline ori-entation of the material.17 However, materials comprised of molecules present a more complex situation and structural information from ToF-SIMS has only been published in three cases known to the authors.
2
with an easily identifiable terminal bromine group displayed on the surface of the polymer film. Lau et al.19 noted the crys-tallization of the surfaces of poly(bisphenol A-etheroctanes), poly(bisphenol etherdecanes) and poly(bisphenol A-etherdodecanes), where the flexible-segment length increased from 8 to 10 CH2 units resulted in an increase in the intensity
of the flexible-segment folds over the rigid-segment folds as-sessed with ToF-SIMS.
In the only other example, Muster and Prestidge20 achieved structural determination of molecular materials with ToF-SIMS on single crystals of N,N-octyl-D-gluconamide and sulfathiazole where several fragment ions and their intensities were found to be correlated with specific crystal faces. For example, the sulfathiazole molecular ion was associated with the [102] crystal face where the molecular layers were less associated among themselves, as assessed using the molecular ion intensity normalized to the total ion counts and the crystal-lographic information.20
In this work we consider three drugs where controlled re-crystallization of amorphous surfaces has been employed to obtain distinct crystalline regions in an amorphous continuum. The drugs (indomethacin, felodipine and acetaminophen) were chosen for their amorphous form stability and molecular weight range being typical for pharmaceutical drugs, between m/z = 100 and m/z = 400. Using multivariate analysis we iden-tify secondary ions indicative of each structurally distinct re-gion and we develop a general rationale for the observation of structural differences in the ToF-SIMS data from molecular materials which we propose will have application in other material science sectors.
EXPERIMENTAL SECTION
Sample preparation. Acetaminophen (form I polymorph) of purity ≥ 99.0 % and indomethacin (γ-form polymorph) of purity ≥ 99.0 % were purchased from Sigma-Aldrich (Dorset, UK). Felodipine (3-ethyl 5-methyl 4-(2,3-dichlorophenyl)-2,6-dimethyl-1,4-dihydropyridine-3,5-dicarboxylate, form I poly-morph) was provided by AstraZeneca (Södertälje, Sweden). Analytical grade solvents were obtained from Fisher Scientific (Loughborough, UK). The water was purified by reverse os-mosis using Merck Millipore Milli-Q System (Molsheim, France).
Indomethacin and felodipine. The as-received drug was placed between two glass slides and melted at 200 °C on a Linkam Scientific LTS350 thermal stage (Tadworth, UK) with a heating rate of 30 °C / min. The melted sample between the glass slides was then immersed into liquid nitrogen. The glass slides were then separated, leaving a film of quench cooled drug on the slides. The film was scratched with a metal needle to initiate crystallization and then left for 1 h in a Thermo Fisher Scientific Hereaus VT 6025 vacuum oven (Waltham, MA) at 80 °C and 1 × 10⁻² mbar. The recrystallized areas were detectable by polarized light microscopy (PLM) after 1 h. For indomethacin, the recrystallized areas were confirmed as α-form (Figures 1-5 of the Supporting Inα-formation). The recrys-tallized felodipine was confirmed as form I (Figures 6 and 7 of the Supporting Information).
Acetaminophen. The as-received drug was melted onto a glass slide at 160 °C using the LTS350 thermal stage. The melted sample was mounted on the SIMS cryo stage at room
temperature, then liquid nitrogen was poured to quench cool it. The sample was placed in the instrument air lock which had been pre-cooled to -40 °C. Exposure to room conditions was kept to less than 10 seconds to maintain surface amorphicity for acetaminophen. Following the ToF-SIMS analysis of the amorphous surface, visually monitored recrystallization of the amorphous sample was performed by exposure to ambient conditions for 30 min. The recrystallized acetaminophen was confirmed as type I (Figure 8A,B of the Supporting Infor-mation). Aqueous supersaturated solutions of acetaminophen were prepared by heating the solution to 70 °C for 30 min, using a supersaturation level above 50%.21 The resulting crys-tals were extracted through a 1 cm deep layer of toluene and washed with additional toluene to stop crystal growth.22 The crystals were placed in the vacuum oven at 80 °C and 1 × 10⁻² mbar for 12 h to remove any toluene.
ToF-SIMS. ION-TOF IV instrument (Münster, Germany) equipped with a single-stage reflectron analyzer and a bismuth liquid metal ion gun was used. The analysis was conducted in high current-bunched mode for optimal mass resolution with Bi3
+
primary ions. The primary ion gun energy was 25 kV and the pulsed target current was approximately 0.3 pA.
For indomethacin and felodipine ToF-SIMS analysis was performed immediately on the same crystallized areas identi-fied with PLM for areas of 500 μm × 500 μm, at a resolution of 1024 × 1024 pixels, for 12 scans. These conditions ensured a primary ion dose intensity of 9.42 × 10¹¹ (primary ions/ cm2). For acetaminophen, ToF-SIMS analysis was performed for areas of 100 μm × 100 μm, at a resolution of 256 × 256 pixels, for 8 scans (with one shot per pixel) and primary ion dose intensity of 9.81 × 10¹¹ (primary ions/ cm2), comparable with the dose intensity for indomethacin and for felodipine.
Positive and negative polarity data were acquired for this study. Positive polarity results are presented for indomethacin, whereas negative polarity results are presented for acetamino-phen and felodipine. The discussion of the remaining results is provided in the Supporting Information the Multivariate data analysis discussion section. The mass range of the peaks was m/z = 0-800. The calibration of the spectra followed the pro-cedure recommended by Green et al.23. For indomethacin, the spectra were calibrated using the CH3
+
, C2H3 +
, C3H7 +
and C4H9
+
, C5H11 +
and C19H16NO4Cl +
([M]+) fragment ions. For felodipine, negative polarity ion spectra were calibrated using the CH-, C2H
-, C3H
-, C4H
-, C5H
-, C6H5Cl
and the C18H17NO4Cl2K
([M]-) fragment ions. For acetaminophen, negative polarity ion spectra were calibrated using the CH-, C2H
-, C3H
-, C4H
-, C5H
-, and C8H9NO2
([M]-) fragment ions. The obtained calibration deviations were below 50 ppm.
3
Multivariate data analysis. PLS Toolbox v. 2.0 (Eigenvec-tor Research, Manson, WA) for MATLAB (the MathWorks, Inc., Natick, MA) was used for principal component analysis (PCA). Prior to PCA, SIMS data were normalized to total counts to reduce changes in signal due to topography and in-strumental conditions.25 Then Poisson scaling was used to account for the absolute measurement uncertainty of the ToF-SIMS detector.26. Lastly, the data was mean centered so that the variance in the dataset is due to sample variances instead of differences in sample means.27 The significance of the amorphous-recrystallized group separations in the PCA scores plots was calculated using the method described by Worley et al28.
Polarized light microscopy. The polarized filters Prior Sci-entific PriorLux POL (Cambridge, UK) were together with the attached QImaging camera (Surrey, Canada).
RESULTS AND DISCUSSION
Crystalline materials expose different chemical groups at each crystal faces29 as a result of the molecular order in the crystalline lattice. Amorphous materials do not possess a crys-talline lattice nor long-range molecular order and hence ran-dom groups are present at their surface. The secondary ions detected in ToF-SIMS emerge from the molecules making up the surface and therefore will be strongly influenced by the molecular arrangement16. We therefore investigate whether the different surface structures between polycrystalline and amor-phous areas of the same material lead to differences in their secondary-ion mass spectra.
Firstly we present the results for the amorphous, quench-cooled surfaces and the recrystallized surfaces chemically mapped using ToF-SIMS. Secondly, in order to test the gener-ality of our observations, we compare the findings with the ToF-SIMS information from samples prepared through a dif-ferent crystallization method typically found in the pharma-ceutical industry, that is the recrystallization from supersatu-rated solutions of acetaminophen crystals.
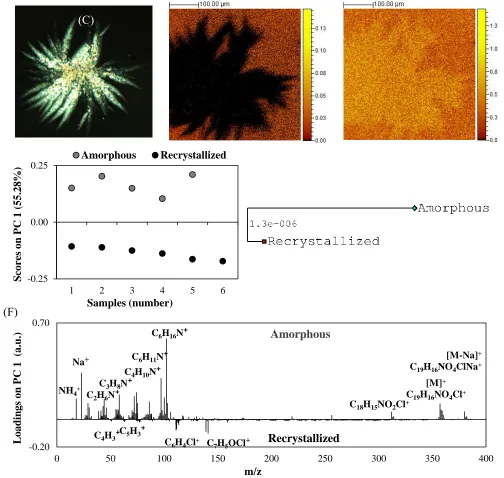
Indomethacin. Polarized light microscopy (PLM) of the in-domethacin samples after recrystallization revealed localized crystalline features on a continuum substrate of amorphous film shown in Figure 1A. The freshly crystallized features could not be detected with confocal Raman spectroscopy, the data for which is shown in Figures 1-5 of the Supporting In-formation. It is proposed that the crystallized features are sur-face localized due to the scratch initiation used and are less than 1 μm deep in depth which leads to a convoluted crystal-line signal, outweighed by the underlying amorphous signal, due to the information depth specific to Raman spectroscopy.14
ToF-SIMS images were subdivided, cropping the amor-phous and the crystalline regions of interest, as identified by the C6H16N
+
fragment ion (m/z = 102.13) that was present in the amorphous areas and absent in the crystalline areas. The crystalline and amorphous areas were subdivided into smaller regions of interest that were treated as individual samples to ensure improved statistics for PCA. The scores plot in Figure 1D indicates the discrimination of amorphous areas from crys-talline areas.
Amorphous areas present positive scores on principal com-ponent one (PC 1) capturing 55.28 % of total variation in the
dataset, whereas crystalline areas present negative scores. This segregation is significant, as shown in Figure 1E. The loadings plot shown in Figure 1F indicates the chemical fragments cor-related with the amorphous surfaces and with the crystalline surfaces. Fragment ions with positive values indicate amor-phous surfaces and originate from the indole part of the mole-cule whereas fragments with negative values indicate crystal-line surfaces present and originate from the chlorobenzoyl part of the molecule (Charts1,2 of the Supporting Information). For example, the secondary ions C6H16N
+
(m/z = 102.12), NH4 +
(m/z = 18.03), C4H10N +
(m/z = 86.10), C6H11N +
(m/z = 97.07) and the molecular ion C19H16NO4Cl
+
([M]+, m/z = 357.07) are associated with the amorphous form (Figure 1F). These sec-ondary ions originate from the indole ring of the indomethacin molecule.
Crystal structures for indomethacin show the indole ring is overlapping with the acetic acid group of another molecule where the tri-molecular arrangement specific to α-indomethacin30 leads to a less exposed indole ring.
In the amorphous state there is no crystalline lattice and the molecule is not as strongly bound by its neighbors as it is in the crystalline form. We propose that this leads to a more fa-vored production of the molecular ion [M]+ from the amor-phous state than the fragmented secondary ions originating from the indole ring of the molecule. Crystalline areas have negative scores values and present negative loadings values (Figure 1F) with secondary ions originating from the chlorobenzoyl ring: C7H5OCl
+
(m/z = 141.00), C6H4Cl +
(m/z = 110.99) andC6H
+
(m/z = 73.00). Smaller fragments, such as C4H3
+
(m/z = 51.00), C5H3 +
(m/z = 63.00) are also correlated with the crystalline surfaces and are originating most likely from the breakage of the benzoyl ring.
4
Smaller fragments,such as C4H3 +
(m/z = 51.00), C5H3 +
(m/z = 63.00) are also correlated with the crystalline surfaces and are originating most likely from the breakage of the benzoyl ring.
[image:4.612.52.556.145.623.2]Therefore, SIMS imaging together with polarized light mi-croscopy and multivariate analysis has demonstrated the clear differentiation of the crystal molecular arrangement between the recrystallized features and quench-cooled amorphous films for indomethacin
Figure 1. Indomethacin crystalline nuclei on amorphous quench cooled films observed by two microscopy techniques: (A) polarized mi-croscopy and ToF-SIMS imaging of (B) C6H16N
+
secondary ion (m/z = 102.13) and (C) C6H4Cl +
secondary ion (m/z = 110.99) normalized to the total ion image to remove topographical effects. (D) Scores plot on PC 1 for indomethacin subdivided areas of the recrystallized surface and the amorphous surface, using positive ion spectra. (E) Dendrogram generated from scores in (D) using Mahalanobis distances, with p values for the null hypothesis. (F) Loadings vector plotted as loadings coefficient versus peak m/z for the data set (model with three latent variables). Eigenvalue plot and principal component number selection are shown in Figure 15A of the Supporting Information.
-0.25 0.00 0.25
1 2 3 4 5 6
Score
s
on P
C
1 (
55.28%
)
Samples (number)
Amorphous
Recrystallized
-0.20 0.70
0 50 100 150 200 250 300 350 400
L
oadings
on
P
C
1
(
a.u.)
m/z
C6H16N+Na+
NH4+
C6H11N+
[M]+
C19H16NO4Cl+
C18H15NO2Cl+
C7H5OCl+ C6H4Cl+
Amorphous
Recrystallized
[M-Na]+
C19H16NO4ClNa+
C4H3+C5H3+
C3H8N+ C2H6N+
C4H10N+
(C)
(F)
(B)
(A)
(D)
5
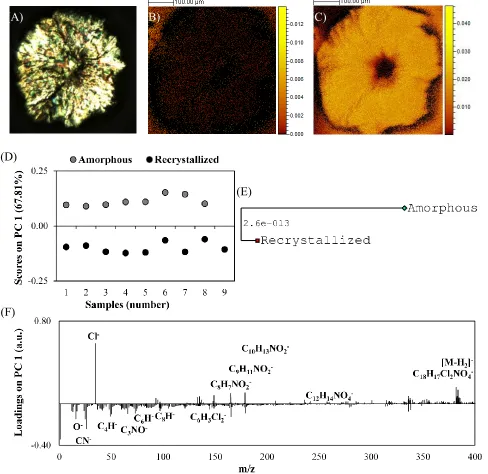
Figure 2. Felodipine crystalline nuclei on amorphous quench-cooled films observed by two microscopy techniques: (A) polarized micros-copy; and ToF-SIMS imaging of (B) C5Cl- secondary ion (m/z = 94.97) and (C) C3NO- secondary ion (m/z = 66.00) normalized to the total
ion image to remove topographical effects (D). Scores plot on PC 1 for felodipine subdivided areas of the recrystallized surface and the amorphous surface, using negative ion spectra. (E) Dendrogram generated from scores in (D) using Mahalanobis distances, with p values for the null hypothesis. (F) Loadings vector plotted as loadings coefficient versus peak m/z for the data set (model with three latent varia-bles). Eigenvalue plot and principal component number selection are shown in Figure 19A of the Supporting Information.
Felodipine. Crystallized areas were detected for felodipine with PLM (Figure 2A) and ToF-SIMS imaging (Figure 2B,C). The amorphous area in ToF-SIMS can be identified by the presence of C5Cl
-
(m/z = 94.97), shown in Figure 2B. The crystalline area can be identified by the presence of C3NO
+
(m/z = 66.00), shown in Figure 2C. The amorphous area used for the PCA analyses is not that shown in Figure 4. There was too little amorphous area in Figure 4 to ensure reliable statis-tics for the multivariate analyses and the crystallized areas were visibly higher than the amorphous substrate. Therefore, a separate ToF-SIMS image of a larger amorphous region was
acquired and subdivided in smaller areas for the PCA and PLS-DA analyses. In the centre of the crystallized area a de-pression was present (Figure 2A), which led to signal loss in that area for the secondary ions characteristic for crystalline surfaces (Figure 2C). Hence, the data for the crystalline area was subdivided into smaller areas that excluded the depres-sion.
Crystalline and amorphous surfaces could be discriminated on PC 1, which captures 67.81% of the total variance in the dataset. The multivariate analysis shows the significant separa-tion of the amorphous-recrystallized groups (Figures 2D,E).
(D)
(E)
(F)
6
The ions correlated with the amorphous areas present positive values in the loadings plot, whereas the ions correlated with the crystalline areas present negative values, as shown in Fig-ure 2F.
The crystalline form was indicated by secondary ions result-ing from the fragmentation of the dichlorophenyl rresult-ing or from the fragmentation of the intermolecular CN-H···O hydrogen bond between the pyridyl N atom to the carboxyl O atoms of the methyl or ethyl ester31, such as C6H3Cl2
(m/z = 145.00), C8H
(m/z = 97.00),C6H
(m/z = 73.00), C3N
(m/z = 50.00), C3NO
(m/z = 65.99) and CN- (m/z = 26.00). The amorphous form was indicated by the presence of the quasi-molecular ion [M-H2]
(C18H17Cl2NO4
-, m/z = 381.76)-, Cl- (m/z = 34.97), C12H14NO4
(m/z = 236.08 ), C8H7NO2
(m/z = 149.00) , C9H11NO2
-
(m/z = 165.00) and C10H13NO2
(m/z = 179.00). The secondary ions correlated with the amorphous form ei-ther contain an intact dihydropyridine ring or originate from the breakage of the dihydropyridine ring. Crystal structures for felodipine show the parallel dihydropyridne rings are inter-twined in a mesh with 90°-oriented dichlorophenyl rings act-ing as the links between the parallel stacks of dihydropyridine. This molecular arrangement leads to a less exposed dihydropyridine ring.32 While the dihydropyridne rings are less exposed by their arrangement in the intertwined mesh with the intermolecular dichlorophenyl rings, the dichlorophenyl fraction is “sticking out” at the surface of felodipine crystals.32 Furthermore, all four polymorphs31 of crystalline felodipine exhibit intermolecular CN-H···O hydro-gen bonds from the pyridyl N atom and the carboxyl O atom of the methyl/ethyl ester.
In the amorphous state there is no crystalline lattice and the molecule is not as strongly bound by its neighbors as it is in the crystalline form. We propose that this molecular arrange-ment leads to a more favored production of the molecular ion [M-H2]
(C18H17Cl2NO4
,m/z = 381.76) from the amorphous state than the fragmented secondary ions originating from the dichlorophenyl of the molecule. Therefore, SIMS imaging together with polarized light microscopy and multivariate analysis has demonstrated the clear differentiation of the crys-tal molecular arrangement between the recryscrys-tallized features and quench-cooled amorphous films for felodipine.
Acetaminophen. In the pharmaceutical industry there are numerous cases of drugs with unstable amorphous forms where varying degrees of amorphous material can lead to problems during pharmaceutical manufacturing and during the commercialization of the pharmaceutical product. Although not used in its amorphous form, acetaminophen represents one of these cases where the amorphous form is very unstable and exhibits a fast crystallization rate on the order of minutes13. Therefore, crystallized areas on amorphous films could not be imaged by both PLM and SIMS because of the rapid recrystal-lization of the amorphous form. The acetaminophen samples were analyzed before and after recrystallization and were con-firmed as form I. The identity of the amorphous and recrystal-lized samples was ascertained by Raman spectroscopy, shown in Figure 8A,B of the Supporting Information.
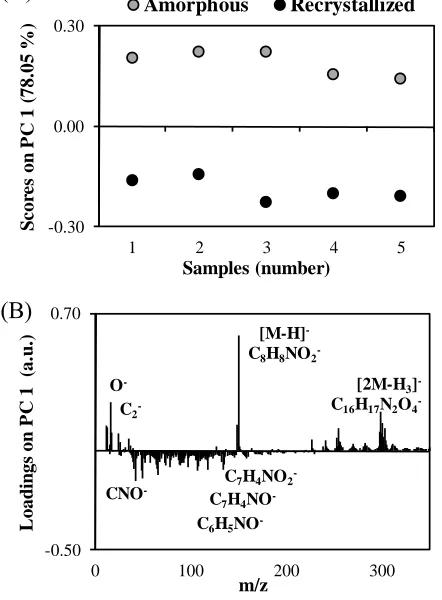
Figure 3. PCA of acetaminophen subdivided areas of the recrys-tallized surface and the amorphous surface: (A) Scores plot for PC 1 using negative ion spectra. (B) Loadings vector plotted as load-ings coefficient versus peak m/z for the data set (model with three principal components). Eigenvalue plot and principal component number selection are shown in Figure 23A of the Supporting In-formation).
Amorphous and recrystallized surfaces were discriminated on PC 1 (78. 05 % of the total variation in the dataset), with positive scores values for amorphous surfaces and negative scores values for crystalline surfaces (Figure 3A). The p value (9.47e-007) calculated using Mahalanobis distances indicated a clear segregation for the 2 clusters. The loadings coefficients in Figure 3B identify the secondary ions correlated with amor-phous surfaces (positive values) and crystalline surfaces (negative values). The secondary ions correlated with amor-phous acetaminophen were the quasi-molecular ion C8H8NO2
-([M-H]-, m/z = 150.06), the quasi-dimer ion [2M-H3]
(m/z = 299.09), O- (m/z = 15.99), OH- (m/z = 17.00) and C2
(m/z = 24.00).
These findings can be explained, as with indomethacin and felodipine, based on the acetaminophen crystal structure.
-0.50 0.70
0 100 200 300
L oad in gs on P C 1 ( a. u .) m/z [M-H]
-C8H8NO2
-[2M-H3]
-C16H17N2O4
-O
-C2
-CNO
-C6H5NO
-C7H4NO
-C7H4NO2
--0.30 0.00 0.30
1 2 3 4 5
[image:6.612.320.541.32.332.2]7
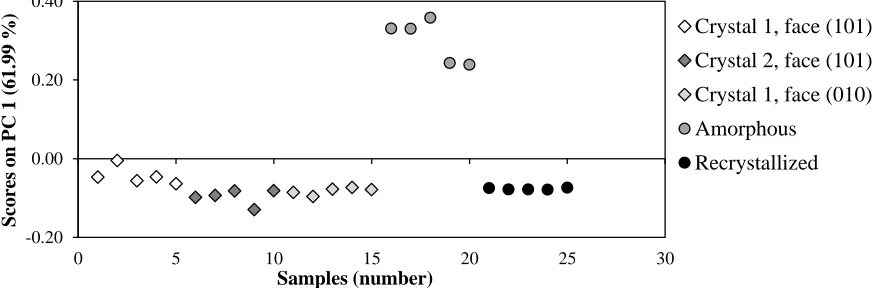
Figure 4. Scores plot on PC 1 for PCA of acetaminophen amorphous, recrystallized and single crystal surfaces. Negative ion spectra were used. The eigenvalue plot and the loadings plot are shown in Figure 27A,C of the Supporting Information. The p values calculated using Mahalanobis distances indicated a clear segregation (p value = 6.3e-006) for the amorphous cluster and the cluster formed of recrystal-lized, and the three crystal faces.
The acetaminophen crystal structure is determined by in-termolecular hydrogen bonds, with each molecule being linked to another four acetaminophen molecules33. We propose that the absence of intermolecular bonds between the neighboring molecules specific to amorphous materials leads to a more favored production of the molecular ion C8H8NO2
-.
The correlation of the OH- (m/z = 17.00) and O- (m/z = 15.99) fragment ions with the amorphous form can be ex-plained by the same absence of the hydrogen intermolecular bonds, which results in free OH groups leading to a higher yield of O- and OH- in comparison with the crystalline form where the hydroxyl groups are engaged together with the am-ide groups in hydrogen bonds. Crystalline surfaces were indi-cated by secondary ions such as C7H4NO2
(m/z = 134.02), CNO- (m/z = 42.00).
We observed that the crystalline form is correlated with the secondary fragment ions originating from the breakage of in-termolecular bonds, producing fragments such as C3NO
(m/z = 66.00) and C6H5NO
(m/z = 107.03) ions.
To test the generality of amorphous-crystalline differentia-tion using ToF-SIMS, acetaminophen crystals were recrystal-lized from super-saturated solutions. The newly produced crystals were confirmed as acetaminophen polymorph form I (Figure 8A, B in the Supporting Information). The XRD anal-ysis confirmed the presence of a single crystal with three dis-tinct faces (Figure 9F of the Supporting Information). The crystal faces were identified based on their morphology using Cambridge Structural Database34 and Mercury 2.235 (Figure 9A-E of the Supporting Information). The surface of the crys-tal faces was imaged using atomic force microscopy. The data are shown in Figure 10A-F of the Supporting Information.
PCA shows that crystal faces are similar to recrystallized surfaces and both of them are different from amorphous sur-faces (Figure 4).
Whilst it is not the purpose of this work, it is interesting to note that there are not differences between different crystal faces and recrystallized surfaces, as opposed to the findings of one previous work20. Muster and Prestidge 20 have shown that recrystallization from saturated solutions in controlled condi-tions can produce crystals where crystal faces exhibit different
chemistries that can lead to differences in their SIMS spectra. However, both their analyzed crystals N,N-octyl-D-gluconamide and sulfathiazole were cleaved in order to expose contamination-free surfaces. As opposed to their method, in our work the acetaminophen crystals were analyzed without prior truncation, in order to simulate the typical crystal grow-ing conditions seen in the pharmaceutical industry. Thus, the non-cleaved acetaminophen crystal faces were more likely to exhibit lattice defects, contaminants and various crystal habits that could obscure the differences among different crystal fac-es and recrystallized surfacfac-es in a PCA analysis. The same fragment ions were correlated with amorphous and with crys-talline surfaces (Figure 27C of the Supporting Information) as the ones identified by analyzing only the recrystallized and quench-cooled amorphous surfaces (Figure 3B).
Therefore, SIMS imaging together with polarized light mi-croscopy and multivariate analysis has again demonstrated the clear differentiation of the crystal molecular arrangement be-tween the amorphous surfaces and crystalline surfaces manu-factured in two different ways for acetaminophen. The pres-ence of lattice defects, bound to occur in any crystallization phenomenon, do not seem to affect the amorphous-crystalline discrimination seen with ToF-SIMS in Figures 3 and 4, how-ever further investigations are necessary to confirm this hy-pothesis. These findings strengthen the argument for the usage of ToF-SIMS imaging to detect and to map polycrystalline and amorphous surfaces for drug films that could be further ex-tended for drug particles characterization.
CONCLUSION
We demonstrated that ToF-SIMS imaging using Bi3 +
prima-ry ions can be used as a reliable method to identify amorphous and crystalline surfaces for drugs, exemplified using indo-methacin, felodipine and acetaminophen. The crystalline sur-faces are indicated by secondary ion fragments resulting from intramolecular and intermolecular bond scission, whereas the amorphous surfaces are indicated by molecular ions and di-mers.
Different recrystallization methods do not affect this general difference between amorphous and crystalline surfaces. These -0.20
0.00 0.20 0.40
0 5 10 15 20 25 30
Score
s
on P
C
1 (
61.99
%
)
Samples (number)
Crystal 1, face (101)
Crystal 2, face (101)
Crystal 1, face (010)
Amorphous
8
findings enable enhanced surface characterization for ordered and disordered molecular systems, with implications for poor-ly understood interfacial processes, such as powder behavior, catalysis surface performance and semiconductor manufactur-ing quality control. For pharmaceutical materials, the ability to analyze the spatial surface distribution of crystalline and amorphous regions will add to our knowledge of the interac-tions between solid surfaces
SUPPORTING INFORMATION
Characterization of the prepared samples for indomethacin, felodipine, and acetaminophen, ToF-SIMS unprocessed spectra, details on the multivariate analysis pre-processing and structural formulae of the secondary ions are included. This material is available free of charge via the Internet at http://pubs.acs.org.
AUTHOR INFORMATION
Corresponding Author
*E-mail: [email protected].
Funding Sources
The authors acknowledge support from AstraZeneca and EPSRC for funding through grant EP/I01375X/1 via the joint Centre for Doctoral Training in Targeted Therapeutics and Formulation Sci-ences.
Notes
The authors declare no competing financial interest.
ACKNOWLEDGEMENTS
The Nottingham Nanotechnology and Nanoscience Centre is gratefully acknowledged for providing access to the Raman mi-croscope. We thank Francesco Tres, James Calladine, Andrew Davies, Nigel Neate and Sandy Blake (University of Nottingham) for their advice in confocal Raman spectroscopy and XRPD work. Mats Josefson (AstraZeneca) and Ian Gilmore (National Physics Laboratory) are acknowledged for their input. Data visualization was aided by Daniel’s XL Toolbox add-in for Excel, version 6.60, by Daniel Kraus, Würzburg, Germany.
REFERENCES
1. Nomura, K.; Ohta, H.; Takagi, A., et al., Nature 2004, 432 (7016), 488-492.
2. Johnson, W. L., Jom-Journal of the Minerals Metals & Materials Society 2002, 54 (3), 40-43.
3. Cui, L.-F.; Ruffo, R.; Chan, C. K., et al., Nano Letters
2009, 9 (1), 491-495.
4. Hancock, B. C.; Zograf, G., Journal of Pharmaceutical Sciences 1997, 86 (1), 1-12.
5. Yu, L., Pharmaceutical Research 2008, 25 (4), 781-791. 6. Dai, X.; Reading, M.; Craig, D. Q. M., Journal of Pharmaceutical Sciences 2009, 98 (4), 1499-1510.
7. Stegemann, S.; Kopp, S.; Borchard, G., et al., European Journal of Pharmaceutical Sciences 2013, 48 (1-2), 181-194.
8. Kawashima, Y.; Serigano, T.; Hino, T., et al., International Journal of Pharmaceutics 1998, 172 (1-2), 179-188.
9. Harding, L.; King, W. P.; Dai, X., et al., Pharmaceutical research 2007, 24 (11), 2048-2054.
10. Newman, A.; Zografi, G., Journal of pharmaceutical sciences 2014, 103 (9), 2595-2604.
11. Ward, S.; Perkins, M.; Zhang, J., et al., Pharmaceutical Research 2005, 22 (7), 1195-1202.
12. Ward, S.; Perkins, M.; Zhang, J. X., et al., Pharmaceutical Research 2005, 22 (7), 1195-1202.
13. Nanubolu, J. B.; Burley, J. C., Molecular Pharmaceutics
2012, 9 (6), 1544-1558.
14. Gouadec, G.; Colomban, P., Progress in Crystal Growth and Characterization of Materials 2007, 53 (1), 1-56.
15. Möller, W.; Eckstein, W., Nuclear Instruments and Methods in Physics Research Section B: Beam Interactions with Materials and Atoms 1984, 2 (1), 814-818.
16. Vickerman, J. C., Introduction. In Surface Analysis: The Principal Techniques, 2nd ed.; Vickerman, J. C.; Gilmore, I. S., Eds. John Wiley & Sons Ltd: Chichester, UK, 2009; pp 1-9.
17. Behrisch, R.; Wittmaack, K., Topics in Applied Physics
1991, 64, 1-13.
18. Li, L.; Ng, K. M.; Chan, C. M., et al., Macromolecules
2000, 33 (15), 5588-5592.
19. Lau, Y.-T. R.; Weng, L.-T.; Ng, K.-M., et al., Analytical Chemistry 2010, 82 (7), 2661-2667.
20. Muster, T. H.; Prestidge, C. A., Journal of Pharmaceutical Sciences 2002, 91 (6), 1432-1444.
21. Finnie, S. D.; Ristic, R. I.; Sherwood, J. N., et al., Journal of Crystal Growth 1999, 207 (4), 308-318.
22. Ristic, R. I.; Finnie, S.; Sheen, D. B., et al., Journal of Physical Chemistry B 2001, 105 (38), 9057-9066.
23. Green, F. M.; Gilmore, I. S.; Seah, M. P., Journal of the American Society for Mass Spectrometry 2006, 17 (4), 514-523.
24. mzCloud- Advanced Mass Spectral Database Home Page.
https://www.mzcloud.org (accessed Dec 29, 2015).
25. Graham, D. J.; Wagner, M. S.; Castner, D. G., Applied Surface Science 2006, 252 (19), 6860-6868.
26. Keenan, M. R.; Kotula, P. G., Surface and Interface Analysis 2004, 36 (3), 203-212.
27. Lee, J.; Gilmore, I. S., The Application of Multivariate Data Analysis Techniques in Surface Analysis. In Surface analysis: the principal techniques, Vickerman, J. C.; Gilmore, I. S., Eds. Wiley Online Library: 2009.
28. Worley, B.; Halouska, S.; Powers, R., Analytical Biochemistry 2013, 433 (2), 102-104.
29. Pingali, K. C.; Shinbrot, T.; Cuitino, A., et al., International journal of pharmaceutics 2012, 438 (1), 184-190.
30. Chen, X.; Morris, K. R.; Griesser, U. J., et al., Journal of the American Chemical Society 2002, 124 (50), 15012-15019.
31. Surov, A. O.; Solanko, K. A.; Bond, A. D., et al., Crystal Growth & Design 2012, 12 (8), 4022-4030.
32. Fossheim, R., Journal of Medicinal Chemistry 1986, 29 (2), 305-307.
33. Esrafili, M. D.; Behzadi, H.; Hadipour, N. L., Biophysical Chemistry 2007, 128 (1), 38-45.
34. Allen, F. H., Acta Crystallographica Section B-Structural Science 2002, 58, 380-388.