REPORT
STIMULATING DESIRED
BEHAVIOR OF STUDENTS
BY MEANS OF A CONTEXT
AWARE DYNAMIC LIGHTING
SYSTEM IN THE SMARTXP
Heleen M. Kok
EEMCS
CREATIVE TECHNOLOGY
EXAMINATION COMMITTEE
Abstract
Acknowledgements
1 Introduction 1
2 State of the Art 3
2.1 Domain analysis . . . 3
2.2 Literature review . . . 6
2.3 Interview . . . 8
2.4 Behavior change . . . 9
2.5 Technology acceptance models . . . 11
2.6 Research hypotheses . . . 14
2.7 Analysis of the literature . . . 15
3 Ideation 17 3.1 Target group . . . 17
3.2 Use cases . . . 19
3.3 Interviews . . . 20
3.4 Behavior intervention . . . 22
3.5 Mode of delivery . . . 28
4 Method 39 4.1 Preparation of the interviews . . . 39
4.2 Color connotation . . . 39
4.3 Light scene effect . . . 41
4.4 UTAUT survey and analysis method . . . 43
5 Results 47 5.1 Color connotation results . . . 47
5.2 Light scene effect results . . . 53
5.3 UTAUT analysis linear regression . . . 56
5.4 UTAUT analysis Path analysis . . . 60
5.5 UTAUT results per construct . . . 61
6 Discussion and Conclusion 67
6.1 Discussion . . . 67
6.2 Conclusions . . . 68
7 Recommendations 69 7.1 Behavior change techniques . . . 69
7.2 Design changes . . . 70
7.3 Evaluation . . . 71
Appendices A Personas 75 B Color connotation literature review 77 C Color connotation survey 79 D Color connotation survey results 83 E UTAUT survey 93 F UTAUT linear regression results, dependent construct: BI 97 G UTAUT linear regression results, dependent construct: USE 109 H UTAUT path analysis 119 I Volume results 125 J Interview plan 127 K Interview 1 129 K.1 Use cases . . . 129
K.2 Lecture . . . 129
K.3 Lectorials and Colstructures . . . 130
K.4 Assisted self study . . . 131
K.5 Supervised project . . . 131
K.6 Demo market . . . 132
K.7 Conference . . . 133
K.8 Other remarks about the SmartXp or the lighting system? . . . 133
L.2 Lecture . . . 135
L.3 Lectorials and Colstructures . . . 136
L.6 Demo market . . . 137
L.8 Other remarks about the SmartXp or the lighting system? . . . 137
M Interview 3 139 M.1 Use cases . . . 139
M.2 Lecture . . . 139
M.5 Supervised project . . . 140
M.6 Demo market . . . 140
Introduction
One of the most innovative and creative rooms of the University of Twente is the SmartXp. The theater of the SmartXp is a collaborative workspace. Due to its mobile furniture and three trusses, the theater can be transformed for several use cases. It is used for lectures, presentations, workspace, and for different types of research projects.
Ninety percent of the time, the study Creative Technology uses the theater for lectures and as a project related workspace. The other ten percent of the time the theater is reserved for the faculty of EEMCS1 or for S.A. Proto2, who use the
workspace for research and gatherings and activities respectively.
The different users of the theater have different goals. While the users work in different sections of the theater, their goals often interfere (see fig. 1.1). For instance, their goals will interfere when one group would like to hold a lecture and another would like to have an active brainstorm session. Currently, the only option to dissolve this problem is to use the room dividers. Resulting in a situation where the users are not able to see each other. The dividers do absorb part of the noise, however, since the users do not see each other, they are less aware of each other and start to speak louder. Therefore the interference still remains.
The SmartXp has an advanced lighting system hanging in the trusses. This system is hardly ever used, usually the lights are set to one state and color. They remain on this state until one of the users requests a change. The amount of light and the color of the light has effect on the atmosphere of the room. ”In 2008, Vogels introduced the concept of atmosphere: the experience of ambient surroundings in relation to the observer.” [1]. At this moment the smart lighting industry is rising, making smart light bulbs and light scenes for consumers [2]. The lighting system in the SmartXp provides an opportunity to create a solution for the interference prob-lem. With the light system we could create light scenes that indicate the desired
1Faculty of Electrical Engineering, Mathematics and Computer Science. 2The study association of Creative Technology.
Figure 1.1: Floor map of the SmartXp, dividers between section 1 and 2
behavior of the students. This leads to the research question:
How to stimulate desired behavior of students by means of a context aware dynamic lighting system in the SmartXp?
In order to stimulate desired behavior we first need to know what the desired behavior in the SmartXp is. We then need to know what the effect of the color of light is, to be able to stimulate the desired behavior with that color. Consequently the following subquestions to the research question were formulated:
State of the Art
2.1
Domain analysis
2.1.1
SmartXp
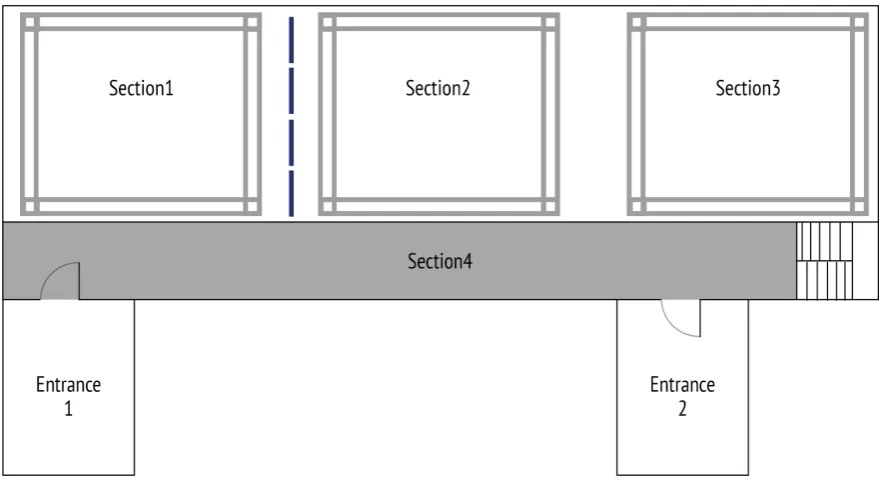
[image:11.595.94.534.426.675.2]The theater of the SmartXp can be divided into four sections (See fig. 2.1). Section 1 to 3 are on the ground floor and section 4 is a mezzanine with the staircase in the theater. The office for the SmartXp technician is also located in the SmartXp area. Additionally, the hallways outside of the SmartXp are also equipped with lights.
Figure 2.1: Floor map of the SmartXp
Section 1 to 3 of the theater are used for lectures, workspace and for research. Each section has its own truss, in fig. 2.1 the trusses are illustrated as gray squares. In the top of the trusses equipment can be placed to transform the section into a research area. LED lights are placed shining upward in the frame of the trusses,
giving the frame a certain color (see fig. 2.2). The SmartXp is equipped with the following lights;
• 12 RGB LED plateau spots that are placed in each corner of the truss frames,
• 17 RGB LED light spots,
• 2 moving head lights, and
• 2 white long range spots.
Figure 2.2: LED light shining upward in a truss frame
the room give a lot of daylight into the SmartXp. The skylights also have blinders that can be activated with a switch. Figure 2.3 also shows that the walls are white and that the floor is a dark gray color.
Figure 2.3: Picture of the SmartXp taken from section 2 facing section 3
2.1.2
User analysis
The SmartXp theater is mainly used for educational purposes for the study Creative Technology. This study occupies the theater 90 percent of the time. The other 10 percent of the time is reserved by the faculty EEMCS and by Study Association Proto. When the SmartXp is not reserved, it is used by students for unsupervised project time or self study.
2.2
Literature review
To be able to answer the research question knowledge is needed about color psy-chology and the effect of colored light on human behavior. The existing lighting systems and their implementation give insight in the way smart lighting systems are used.
2.2.1
Related work
The smart lighting industry is rapidly evolving. There are several manufactures of smart light systems. These smart light systems are mainly configured by a mobile application in which the user can set their preference. Examples of smart lighting systems are: Philips Hue [3], Belkin WeMo [4], and LightwaveRF [5]. These lighting systems mainly focus on home usage. The can all be used to create a pleasant ambiance. Each system can be adjusted by the user to their preference. Research regarding light systems in educational context is scarce. The main topic of that type of research was the effect of the color temperature of the white fluorescent lights that are often used in schools [6]. The results showing that a cooler color temperature gained more focus and better sleep quality.
2.2.2
Color categorization
Knowledge about color categorization is necessary ,to understand color psychol-ogy and the effect of colored light better [7]. A color can be divided into three val-ues; hue, chroma and brightness [8–11]. Munsell categorized these values in three dimensions making a clear visualization of the categorization possible [12]. The brightness of a color is on the z-axis, the higher the value, the more white the color contains and the brighter the color appears. The hue is defined in a circle on the xz-axis, Munsell defined five primary hues on this circle, all other hue values are a combination of these five hues. The five primary hues are; red, yellow, green, blue and purple. Lastly, the chroma, this value indicates the saturation of a color. When the chroma is high, the saturation of the color is high and it gets close to its hue color (see fig. 2.4) [7, 12, 13].
Figure 2.4: The Munsell color categorization, adapted from [7]
cool hues is important, since they have a different effect on the body. The effect will be explained in paragraph 2.2.4.
2.2.3
Color psychology
There has been a lot of research on the preference of colors and the color conno-tations [6, 7, 14–17]. Whether color has an effect on a psychological level or not is debatable [18]. However, the preference and the connotation of colors have been research in depth. Research showed that preference of colors was affected by the demographic characteristics of the user. The preference is strongly affected by the age, sex, and cultural background of the subject [7, 14, 19]. However, emotional color connotation was not influenced by demographics. Especially the descriptive dimensions of warm and cool colors showed significant results [20, 21]. Warm colors like red, orange and yellow were described as cute, sweet, joyful, and inti-mate [1, 6, 7, 19, 22, 23]. But these warm colors were also experienced as tensed, hot, and less pleasant [21]. The cool colors are blue, green and purple, these colors have a short wave length [24]. Cool colors were seen as bitter, cool, and sorrow-ful [1, 6, 19, 20, 22]. The table in appendix B gives an overview of the researched colors and there associations.
2.2.4
Effect of colored light
showed that blue light has a significant effect on the secretion of the hormone mela-tonin and thereby influencing the sleep-wake cycle. When people saw blue light during the day it improved their quality of sleep and decreased depression [29]. In addition to the effect on sleep the physiological effects of colored light have been studied. It was found that red light increases the heart rate, resulting in an elevated blood pressure and core body temperature [22, 26]. Another effect was that warm colored light increased brain activity [24]. The effects of cool colored light include faster cognitive processing [22], but not a faster reaction time. Cool light resulted in better concentration and had a sedative calming effect [29]. The overall effects that colored light had on the human body were on concentration, vitality, vigor, productiv-ity, and learning ability [22,29,30]. There was one experiment that closely resembles my research question, namely the experiment of Jin [6]. This experiment changed two light factors that affected the atmosphere of a room. The light shining down was a white light of which the researchers changed the color temperature. The second light shined towards the ceiling in changing color. The experiment was executed to find out what color temperature and color combination was preferred in a living room during certain activities.
2.3
Interview
The structure of an interview can be divided in one of three categories.
Firstly, unstructured interviews; these interviews do not have restrictions, the interviewer can ask any question at any time. This leads to in depth qualitative research. However the downside of an unstructured interview is that it is hard to keep track of the progress of the interview and the outcome is hard to compare to other interviews.
Secondly, the structured interview; the questions of the interview are fixed. The interviewer is restricted to use only the planned questions. Structured interviews are often used to get data from a large group, and are distributed as surveys. Structured interview obtain quantitative data which is easy to analyze [31].
2.4
Behavior change
In order to stimulate behavior, information about behavior change is needed.
2.4.1
Behavior change wheel
A renowned behavior change tool is the Behavior Change Wheel(BCW), it was used to design this intervention. A behavior intervention is a strategy to change behavior. The BCW combines 19 frameworks of behavior change, and reduced them to nine intervention functions. The nine intervention functions are; education, persuasion, incentivisation, coercion, training, restriction, environmental restructuring, modeling, and enablement. The BCW can be categorized into sources of behavior, intervention functions, and policy categories [32]. In fig. 2.5 the sources of behavior are the core of the wheel and displayed in green. The intervention functions are shown in the middle ring in red and the outer ring of the wheel are the policy categories these are shown in gray. All in all, the BCW helps decide what intervention options to use and how to evaluate them.
Figure 2.5: The behavior change wheel from [32]
At the core of the BCW is the COM-B model. COM-B stands for the components; capability, opportunity, motivation, and behavior (see fig. 2.6). The theory behind the COM-B model is that behavior change will involve changing one or more of the components [32].
The guide, uses eight steps to use the BCW [32];
1. define the problem in behavior terms,
Figure 2.6: The COM-B model [32]
3. specify the target behavior,
4. identify what needs to change,
5. identify intervention functions,
6. identify policy categories,
7. identify behavior change techniques,
8. identify mode of delivery.
These eight steps will be used in the ideation paragraph 3.4 to define the problem behavior, the behavior change functions, and how to evaluate the intervention.
2.4.2
Nudge
2.5
Technology acceptance models
There are many behavior theory models that predict the acceptance of a model. Three of the models will be described in this literature review. The models are based upon the Theory of Reasoned Action (TRA). This theory states that the intention of use indicates the actual usage of the intervention [35]. Additionally, Wixom states that the intention is influenced by the attitude towards the intervention and the social value it has [36].
2.5.1
TAM
The first model is developed by F.D. Davis [37]. It is the Technology Acceptance Model (TAM). Davis model uses the Perceived Usefulness (PU) and the Perceived Ease of Use (PEOU). The PU is the attitude of a person to what extend the technol-ogy will be useful to them. The PEOU is used to measure if a person expects the technology to be easy to use [37]. The PU and PEOU will predict the Intention (I) of use. The I can than predict the actual Usage (U) of the technology (see fig. 2.7). TAM is the best known acceptance model [39]. The TAM is widely used because the
Figure 2.7: Schematic view of the TAM [38]
2.5.2
TPB
The authors of the TRA model expanded the model to predict what determinant drives people to accept a technology. The new model is the Theory of Planned Behavior (TPB). The TPB model has three determinants that influence the Usage Intention (I):
1. Attitude (A)
2. Subjective Norms (SN)
3. Perceived Behavioral Control (PBC)
The A is the same factor as the TAM uses. The SN is a new determinant, it measures the social influence the usage of the technology has on a person. The PCB is an extended version of the PEOU, it also measures if the user feel that he or she has enough knowledge to operate the technology and if they feel the facilitating conditions are sufficient [35] . Unlike the TAM the TPB does not believe that its model can be used in every situation, this model has no standard questions, because the questions are context specific [41]. TPB is often used to determine which variable influence the actual usage [35].
2.5.3
UTAUT
The last model is the Unified Theory of Acceptance and Use of Technology (UTAUT). UTAUT combines the theory of TAM, TPB and six other models [42]. As can be seen in the model, the behavioral intention is influenced by four core constructs that have a direct influence and four indirect variables (see fig. 2.9). Venkatesh showed that the UTAUT explains 70 percent of the variation in the use behavior of technology [38]. The validation of the UTAUT model was greater than the eight previous models [42]. Carlsson state in his study; ”The model has been empirically examined and found to outperform the eight individual models, including the TAM model.” [43]. Fatema Akbar used UTAUT to research the student acceptance of technology, she reported that the UTAUT model is applicable to some extent in the educational setting, however some modifications need to be made to improve the model for educational use [42].
Figure 2.9: UTAUT model from [42]
Table 2.1: Definitions of the UTAUT constructs
Construct Definition
Performance Expectancy (PE)
The degree to which an individual believes that using the sys-tem will help him or her to attain gains in job performance. Effort
Expectancy (EE)
The degree of ease associated with the use of the system.
Social Influence (SI)
The degree to which an individual perceives that important others believe he or she should use the new system.
Self Efficacy (SE) Judgment of ones ability to use a technology to accomplish a particular job or task. (Adapted from the Social Cognitive Theory)
Anxiety (ANX) Evoking anxious or emotional reactions when it comes to performing a behavior (i.e. using the technology) (Adapted from the Social Cognitive Theory)
Attitude (ATUT) An individual’s overall affective reaction to using a system.
2.6
Research hypotheses
In the study ”Adoption of mobile devices/services searching for answers with the UTAUT” [43] Carlsson modified the the impact hypotheses of Venkatesch study [38] to fit the context of mobile devices/services. The hypotheses that Carlsson used have been adopted in this study, H5 and H6 have been modified to fit the context of the light system. Expected relationships for direct effects are:
H1: Performance expectancy has an influence on behavioral intention. H2: Effort expectancy has an influence on behavioral intention.
H3: Social influence has an influence on behavioral intention.
H4a: Facilitating conditions will not have an influence on behavioral intention. H4b: Facilitating conditions has an influence on usage.
H5: Anxiety toward the the effect of the light system will not have an influence on behavioral intention.
H6: Attitudes towards the light system will not have an influence on behavioral intention.
2.7
Analysis of the literature
There have been several studies to find out what the effects of light are on the human body [14, 22, 23, 25–29]. Also the preference of colored light has been researched in depth [1, 6, 7, 13, 21, 44]. However, to the best of our knowledge, no research has been published on stimulating behavior using colored light. Therefore, it is presumed that the research question is novel and significant. The effect of light on the human body can be used in the installation to stimulate or sedate the body. Stimulating colors are colors with a warm hue like red, orange, and yellow. A sedative effect is accomplished with cool hues like blue, green, or purple. Blue light has a high effect on the quality of sleep of the subject. Furthermore, the preference of a color is determined by demographic characteristics, while the emotional connotation of the colors where culture and gender independent. As can be seen in table B.1 some colors have been researched more than others. A critical review on color psychol-ogy pointed out that many of the articles about color psycholpsychol-ogy lack in empirical evidence, because there sample groups are to small [18]. It is therefore important to evaluate the color connotations for the target group and compare the results with the results that were found in the literature.
Ideation
The ideation phase normally consists of three stages, the user identification, the technology, and the creative idea stage. However, since the focus of this graduation project lies in defining a user experience, not designing a prototype, a slightly dif-ferent approach is taken. First, the users will be identified, then the use cases will be defined. Results of user interviews will be discussed next, and finally the light scenes per use case will be discussed.
3.1
Target group
The target group can be categorized in the following groups:
• Students
• Teachers
• Student assistants
To get an idea of the goals of the target group personas were made. The personas can be found in appendix A. A stakeholder analysis was conducted to find how the users influence the dynamic lighting system and what their interest in the system is. Sharp wrote an article about stakeholder identification [45]. He stated in his article: ”Stakeholders are related to each other and interact with each other [22,11,17]. In-teractions between them include: exchanging information, products, or instructions, or providing supporting tasks.” [45]. In the table table 3.1 the interaction between stakeholders can be found.
In table table 3.2 the stakeholders and their role of influence is defined. The level of importance is based on the dimensions of importance as reported in the origi-nating study of Sharp [45]: ”Dimensions of importance are: relationships between stakeholders, the relationship of each stakeholder to the system, and the priority to be given to each stakeholders’ view.”.
Table 3.1: Stakeholders interaction
Stakeholder Interaction with Interaction
Teacher Student Provide information and instructions
Student Teacher or Student
Assistant
Ask questions
Student Technical consultant
of the SmartXp
Ideate and creation of compartments for projects
Technical consultant Student and Teach-ers
Facilitate technology
Cleaners All Providing supporting tasks
Students of other studies Creative Technology students Collaborate Management SmartXp
All Improve the SmartXp and facilitate
Figure 3.1: Interest Influence Matrix
Table 3.2: Stakeholders and their role and Influence
Stakeholder Role Key interest Topic Level
Students End users Usability Interaction Medium
Student assistants End users Usability Interaction Low
Teachers Legislator Improvement Interaction High
Technical advisor Developer Development R and D Medium
3.2
Use cases
The SmartXp has many use cases. Their are educational and social use cases. Jeroen Jansen van Roosendaal placed a survey on facebook asking the students for which use cases they used the SmartXp. Next to that source, the schedule of the SmartXp was used to define the educational use cases. The use cases regarding the target group are; lectures, tutorials, presentations, project time, meetings, con-sulting the technical adviser, workshops, eating lunch and self study. Each will be further discussed in their own section.
3.2.1
Educational use cases
• Lecture: A plenary way of teaching. Often involves a powerpoint with additional information. When the SmartXp is reserved for a lecture, the sections 2 and 3 are used for this activity. Students attending the lecture sit in rows facing the lecturer.
• Tutorials, practicals, and colstructions: These use cases are supervised ed-ucational activities. The teacher and student assistants help the attending student to solve the questions or to build the tasks. Sometimes extra explana-tion is needed and the teacher then switches to a plenary teaching situaexplana-tion. During these use cases it is important that the student assistant walks around to help.
• Presentations: Presentations take place in section 3, the tables in this section are then removed and the chairs are placed in half circles.
• Supervised project time: When project time is supervised, this often includes meetings between the project group and the supervisor. These meetings take place in section 3. The project groups that are not in a meeting, are spread in the SmartXp, working with their group on their project. The groups often rearrange tables in a way that the members face each other, and they are able to work together.
3.2.2
Miscellaneous use cases
The following use cases are categorized as miscellaneous, since they are not edu-cational but they do involve the target group and the SmartXp.
• Meetings: During the lunch break the SmartXp is often used for committee meetings. The students sit in section 1 to discuss what needs to be done.
• Consulting the technical adviser of the SmartXp: many students use the facil-ities of the SmartXp to build project work or personal projects. The technical adviser of the SmartXp help the students ideate and create the components that the students need in order to finish their project. The room of the technical adviser is in the back of the SmartXp next to section 1.
• Meet friends: the SmartXp is the home of the study Creative Technology. For which the theater has become a meeting space.
• Workshops: the study association initiates a workshop in which students can learn to build something new. During the workshops the tables are filled with electronics and equipment. Workshops are usually planned at night.
• Eating lunch: students responded that they use the SmartXp theater to eat lunch.
• Self study: students who use the SmartXp for self study seek a workspace. Often students sit together with friends to work on assignments or to study for a test. Students who use section 4, work by themselves and sit next to their friends. Students who use section 1 for self study, group around a table and often make use of an extra screen to work together.
3.3
Interviews
3.3.1
Result of the interview
The following table gives the results of the interviews. For each use case the desired behavior of the attending students and the surrounding students are described. Ad-ditionally, the usage of the entrances and stairs is evaluated with the scale of open, semi open, and closed. When an entrance is set to semi open, it is allowed to use this entrance but only in a quiet manner.
Table 3.3: Results of the expert interviews per use case
Use case Attending students Surrounding students Entrance Usage
Lecture Focused, awake, feeling free to ask questions
Quiet 1: Semi open, 2: Closed, Stairs: Closed
Lectorials Can sit where they want, go to section 3 for ques-tions
Do not disturb All: Semi open
Assisted self study
Collaborate and self suf-ficient working attitude, student assistants need to walk around
Do not disturb All: semi open
Supervised project
Discuss and collabo-rate, meetings with the teacher in section 3
Does not matter 1: Open 2 and Stairs: Semi Open
Demo mar-ket
Walk around, try out projects
3.4
Behavior intervention
In this section the eight steps that were discussed in paragraph 2.4 are used to define the behavior that needs to be changed and how to change that behavior.
3.4.1
The behavior
First an understanding of the current behavior, and the target behavior is needed. The interviews, observations, and personal experience let to the answers of step 1 to 4.
Define the problem
The CBW guide states that to be able to define the problem in behavior terms, a knowledge about the location, the behavior and the individual or group that displays the behavior are necessary [32]. The knowledge about the location can be found in the domain analysis of paragraph 2.1. The groups that are involved are described in paragraph 3.1.
The problem behavior can be defined in one sentence as: Disturbing edu-cational use cases in the SmartXp by talking, using the entrances, using the
stairs and or making noise. The surrounding students show most of the problem
behavior. The surrounding students are in the SmartXp for the miscellaneous use cases that are described in paragraph 3.2.2.
Select the target behavior
In table 3.3, the desired behavior of the students that are in the SmartXp during an educational use case is described.
After discussing the problem with students of Creative Technology, the reason why they showed the problem behavior became more clear. Students mentioned that they often did not know when there was a lecture present in the SmartXp. By the time the students arrived at entrance 2 and they could see that there was a lecture they would decide to sneak into the room quickly. Another reason to make noise was that they did not know that when they talked in section 1 this would be disturbing for the lecture. A couple of students mentioned that they learned from older students that their was one teacher who they should not walk in on and that the other teachers did not care if you used the entrances or the stairs.
behavior. Furthermore, the entrances need to show if they can be used and how they should be used.
Specify the target behavior
• Who need to change their behavior? – Surrounding students
• What behavior needs changing? – Usage of entrances
– The behavior displayed when entering the room
– Distracting behavior like:
∗ Talking
∗ Walking around
∗ Laughing
∗ Building/making noise
• Where does the behavior take place? – In the SmartXp
• When does the behavior take place? – During educational use cases
• Why does the behavior take place?
– Student do not know that there is a use case active in the SmartXp
– Students learned to ignore the active use case
– Students do not know that their behavior is disturbing
• With whom do the surrounding students display the unwanted behavior? – With other surrounding students
What needs to change?
The surrounding students need to know where they are allowed to sit and what behavior is expected of them during the active use case. The problem behavior is distracting the educational use case, by using the entrances, the stairs or by making noise. People should learn when they are allowed to use the entrances and the staircase, and they should learn when they should be quiet. The awareness of the surrounding students of the SmartXp needs to change.
3.4.2
Intervention options
Now that the target behavior and what needs to change is defined the intervention options can be chosen.
APEASE criteria
The APEASE criteria are used to identify the appropriate behavior change tech-nique. Michie describes the APEASE criteria in her book as [32]:
• Affordability: how much the delivery mode will cost, in terms of design and delivery.
• Practicability: the mode of delivery should allow the intervention to be delivered as designed.
• Effectiveness: also revered to as cost-effectiveness, especially the delivery mode has influence on the effectiveness.
• Acceptability: how acceptable the stakeholders find the intervention.
• Safety: unintended side effects of interventions should be explored.
• Equity: will the delivery mode result in the intervention reaching the intended recipients or will some targets not have access because of health, wellbeing, or standard of living?
An intervention function is suitable for the behavioral change when the APEASE criteria are met [32]. See table 3.4 for the intervention functions of this system.
Intervention functions
Table 3.4: Identification of the behavior change techniques by using the APESE criteria
Intervention function
Definition BCTs for this system APEASE?
Education Increasing knowledge or understanding
Providing information how to use the lighting system
Yes
Persuasion Using communication to induce positive or nega-tive feelings or stimulate action
By changing the atmo-sphere, stimulating the be-havior
Yes
Incentivisation Creating an expectation of reward
- Not
practica-ble Coercion Creating an expectation
of punishment or cost
- Not
practica-ble Training Imparting skills Teachers and older
stu-dents explaining the sys-tem to new users of the SmartXp, an explanation lecture at the start of the college year
Yes
Restriction Using rules to reduce the opportunity to en-gage competing behav-ior
Rules for the usage of the doors on a poster near the entrances
Unlikely to be acceptable
Environmental re-structuring
Changing the physical or social context
Using a dynamic light sys-tem to indicate desired be-havior
Yes
Modeling Providing an example for people to aspire to or im-itate
Students and teachers showing how the system should be used
Yes
Enablement Increasing means, re-ducing barriers to in-crease capability or op-portunity
No further than environ-mental restructuring or training
No
Policy categories
• Environmental planning,
• Communication, and
• Regulation.
Regulation scores as unlikely acceptable in the APEASE criteria, because it is un-likely that the current students that use the SmartXp are going to accept the rules and principles of behavior in the SmartXp. The current students already have a mindset and their own rules regarding the SmartXp. However, the new students of the SmartXp that start in September do not have this mindset and for them the regulation policy could be acceptable, when it is clear and logical. Therefore the regulations will be designed and evaluated.
Table 3.5: Identification of the policies using the APESE criteria
Policy Definition Option for this system APEASE?
Environmental or social planning
Designing and or con-trolling the physical or social environment
Changing the environment by changing the lights
Yes
Communication and marketing
Using print, electronic, telephonic or broadcast media
Using posters to explain the color codes and the rules
Yes
Legislation Making or changing the laws
Does not apply No
Service provision
Delivering a service Does not apply No
Regulation Establishing rules or principles of behavior
Establishing rules for the usage of the doors and de-scribe principles for each color code
Unlikely acceptable
Fiscal measures
Taxes and financial costs
Not possible No
Guidelines Documents that recom-mend or mandate prac-tice
Documents or a workshop how to use the system
Yes
3.4.3
Implementation
implementations. The application was used in this project to see what BCTs were applicable for the lighting system.
Behavior change techniques
BCT 4.1 Instruct on how to perform the behavior ”Advise or agree on how to
perform the behavior (includes ’Skills training’)” [46]
By instructing the student what the colored light means, they are able to interpret the lighting system and act upon the instructions.
BCT 7.1 Prompt or cues ”Introduce or define environmental or social stimulus
with the purpose of prompting or cueing the behavior. The prompt or cue would normally occur at the time or place of performance.” [46]
The color of the light is the cue. The color shows what the context of the section is. Whether a student is allowed to sit there and what behavior is expected of the student.
BCT 8.2 Behavior substitution ”Prompt substitution of the unwanted behavior
with a wanted or neutral behavior.” [46]
This BCT is applicable in case of the entrance usage. When the students are allowed to use the entrance but should use it quietly, the color of the light is blue. The blue light prompt the students to stop talking, but they are still allowed to use the entrance.
BCT 12.1 Restructuring the physical environment ”Change, or advise to change
the physical environment in order to facilitate performance of the wanted behavior or create barriers to the unwanted behavior.” [46]
The first restructuring of the SmartXp is the removal of the room dividers between section 1 and 2. The room dividers do not solve the problem and in order to test if the light system works it is advisable to have the same setup in each section.
BCT 12.5 Adding objects to the environment ”Add objects to the environment
in order to facilitate performance of the behavior.” [46]
LED strip to illuminate this section. After the interviews, one of the teachers men-tioned that the usage of the staircase was distracting. The other teachers confirmed that the stairs were as much a distraction as entrance 2. This insight led to another RGB LED strip to indicate the usage of the staircase.
3.5
Mode of delivery
For the design of the intervention the chosen BCTs of the previous sections were used. BCT 12.1 and 12.5 were used to design the light plan. To indicate what behavior was desired the colors of the sections and entrances was designed in color codes and the light scenes, there BCT 7.1 and 8.2 were used. The last part of this section is instructions, here BCT 4.1 was used to design posters to give instructions of the use of the light system.
3.5.1
Light plan
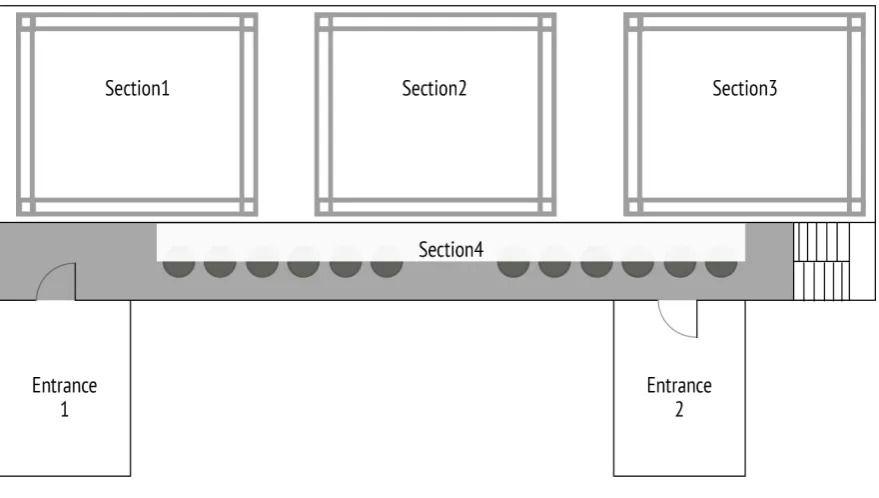
[image:36.595.66.505.482.719.2]Together with Jeroen, the light plan was designed. Each section should have the same amount of colored lights, to be able to create the same effect in each section. The design of the light plan is depicted in fig. 3.2. The lights that had the same address, were lamps of the same manufacturer and type. When a hue, chroma and brightness is set for this address the lights will all show the same value. These addresses are shown next to the light indicators.
3.5.2
Color coding
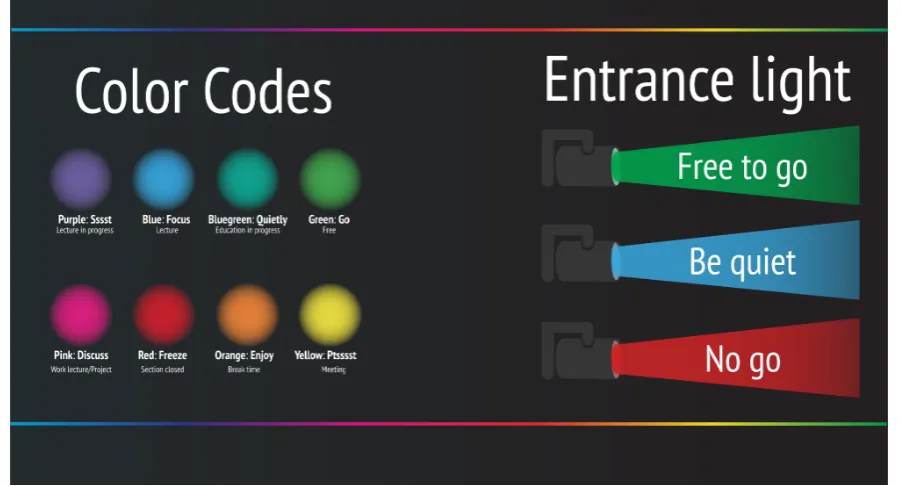
[image:37.595.88.539.251.494.2]For the scope of the graduation project, it was decide to give the same color for all the lights in one section. After the color connotation survey described in paragraph 4.2, the colors to prompt the behavior with could be chosen. The colors and the behavior that they indicate are illustrated in fig. 3.3, on the left are the colors that indicate the behavior for each section, and on the right the colors that were used at the entrances and for the staircase. Each of the colors will be described next, what behavior the color indicates, and what the connotation of the color was.
Figure 3.3: Chosen colors and their behavior indication
Purple: Ssst This color was chosen for sections were student were allowed to sit,
but only in silence. The purple color is of the cool hue range and has a calming effect on the body. Furthermore, purple was seen as a closed, serious and balanced color. These are connotations that fit working in silence.
Blue: Focus A blue section indicates that students in that section attend a lecture.
Bluegreen: Quietly For most of the educational use cases the teachers men-tioned that the behavior of the surrounding students did not matter as long as they did not distract the attending students too much. In order to inform the surrounding students that an educational use case is active the color bluegreen appears in the sections which are available for the surrounding students. This color like the colors purple,blue and green is from the cool hue range and has a calming effect. The color connotation showed that this color is relaxed, happy, open and balanced.
Green: Go The SmartXp is not always reserved, to indicate that the room is free
to use the color green was chosen. Firstly, because green has the traffic light con-notation of go. Secondly, the color was seen as happy, relaxed, interesting and balanced. Lastly, green was chosen because the SmartXp is the home of the study Creative Technology and green is the color of the study association.
Pink: Discuss During work lectures and projects the teachers would like to see
the students collaborate as much as possible. However, the SmartXp gets noisy we people talk too loud. Pink is mix of the warm and stimulating hue red, and the calming serious hue purple. Because of the mix of a warm and cool hue, the color pink should stimulate while also staying awake and active. However, pink evoked strong distinctions in the color connotation, the chaotic and tensed feeling it evoked could have a negative effect on the work lecture or project time.
Red: Freeze Red got the highest ratings for the connotations closed, tensed and
serious. This color has alike green the association with traffic lights and was chosen to indicate that a section or an entrance is closed.
Orange: Enjoy During lunch time the SmartXp should be open and happy.
Re-search has shown that warm hues increase appetite [47]. Also walking around and a change of atmosphere are necessary to be able to focus later on. The playful and active connotation of orange could help achieve a better break.
Yellow:Psst When a section is set to yellow a group is having a meeting in that
3.5.3
Light scenes
In this section the light scenes for the most occurring use cases are explained. In the illustrations the corners of the sections 1-3 show colored circles, these circles are representative for the color of all the RGB LED lights in that section. The brightness of the lights was set to full, because the distance between the light and the subject was very far. Excluding the LED strips, the brightness for the LED strips was set lower to approximately a value of 40 on a scale from 0 to 255. For the hue and the chroma the colors of fig. 3.3 were tried to reach.
Lecture
During a lecture sections 2 and 3 are used. To indicate where the attending students may sit in these sections are set to blue. The color blue was chosen, because this is a cool color and therefore a calming color. The color blue has the highest effect on the circadian rhythm, keeping the attending students focused and awake. The focus of the attending students should be on the lecturer and the presentation. A way to get more focus on the lecturer is by illuminating the lecturer and dimming the surroundings. To achieve this effect the spotlights in section 3 (see fig. 3.2 the lights with address 100) are turned on and set upon the lecturer. In addition, the fluorescent lights that illuminate the hallway beneath section 4 should be turned off. For the surrounding students, the sections 1 and 4 are free to use as a workspace. The lights in these sections are set to purple, indicating that a lecture is in progress and they should be quiet (see fig. 3.3 and fig. 3.4). Entrance 2 and the staircase should not be used during this use case and are set to red. However entrance 1 may be used, but only if the user is quiet.
Work lecture
A work lecture can differ from a practicum, supervised self study, or a colstructure. All these use cases include a teacher, student assistants, and attending students. These use cases are similarly to a lecture arranged in section 2 and 3. Because the teachers want the student and student assistants to collaborate, the color pink was chosen. Pink is a color that consists of a mixture between the warm hue red and the cool hue purple, resulting in the fact that the color is both exiting and awake. In the results of the color connotation it can be seen that pink is also seen as an interesting and open color. However, pink was also seen as tensed and chaotic. That is why this color is not suitable for a work lecture were the students need all their attention like a mathematical work lecture. In case of a serious work lecture, where silence is preferred, the light scene of the lecture use case is more suitable. As can be seen in the illustration for the work lecture (fig. 3.5), the surrounding students are allowed to sit in section 1 and 4. The surrounding students are allowed to use both entrances and the stairs. However, in order not to distract the the explanation sessions that the teachers often give in section 3, the staircase and entrance 2 should be used quietly. The color of section 1 and 4 is bluegreen, and indicates that the students may talk, but not disturb the attending students.
Supervised Project
The light scene for supervised project is almost the same as the light scene for the work lecture use case. The difference is that section 1 is also reserved for super-vised project time, while during supersuper-vised project time all the attending students work in the SmartXp in groups and they need all the space they can get. Not all supervised projects need entrance 2 and the staircase to be set to blue. Only the supervised projects that have project meetings with the supervisors in section 3 need this light setting. However, it was decided to set the stairs and entrance 2 to blue for all the supervised project, because it should reduce the amount of walking and talking in the hallways and that will reduce the total produced volume.
Figure 3.6: Light scene for the supervised project use case
Unsupervised Project
Figure 3.7: Light scene for the unsupervised project use case
Break
Because the students stated that they used the SmartXp during the lunch as a place to meet friends and to eat lunch an appropriate light scene for the lunch time was designed. Every work day at 12:30 the light switch to the light scene that is illustrated in fig. 3.8. The connotation results for orange were; awake, warm, happy, playful, interesting, and open. Because of this connotation, the color orange seemed like a good color for break time.
Meeting
The other use case for the SmartXp is for meetings. During this use case the stu-dents gather to have a meeting for committees and projects. As was described in paragraph 3.2.2, the students often sit in section 1. However, after rearranging the SmartXp, the more logical section for a meeting became section 3. Section 3 is more suitable for a meeting, because the this section is almost empty during lunch time. Furthermore, this section is darker because of the permanent blinders, a darker area gives less focus on the surroundings and more focus on the meeting. Especially when the moving head (see??) is set as a spot on the meeting students. Another reason why meeting should move from section 1 to section 3, is because the office of the technical consultant is near section 1. During the day many stu-dents walk in section 1 to get help from the technical consultant. Especially during the lunch break, the section gets crowded with students who have questions. Con-sequently the section is crowded, it gets noisy, and a noisy environment is not ideal for a meeting.
Figure 3.9: Light scene for the meeting use case
Free
Figure 3.10: Light scene for the free use case
Closed
When other users than the study of Creative Technology want to use the SmartXp, the room should indicate that the sections are closed for students. By setting the sections to red, the students can see that they should not be using the setting. Red was chosen, because this color got the most votes for the connotations tensed and closed.
Figure 3.11: Light scene for the closed use case
3.5.4
Instructions
posters used minimal information to get more attention. Further the design of the posters was high in contrast and suited the interior design of the SmartXp.
Figure 3.12: Instruction poster at the top of the stairs
Figure 3.13: Instruction poster at en-trance 2
Figure 3.14: Instruction poster with all the instructions in the hallway before en-tering the SmartXp
Method
4.1
Preparation of the interviews
The Guide to Semi Structured Interviews [48] emphasizes on a good preparation. While preparing for an interview the interviewer needs to have a goal for the inter-view, make an appointment, prepare how to record the interview and confirm the data and location with the interviewee [48]. For the semi-structured interviews with the teachers an interview plan was made, consisting of topic, main questions and follow-up questions. While preparing the questions, closed questions were avoided as much as possible. The interview plan can be found in appendix J and the results of the interviews can be found in chapters K to M. After the second interview the interview plan was adjusted, because the interviewee noted that the usage of the staircase was as distracting as the usage of the entrances. Consequently the out-comes of the second and third interview could be compared considering the usage of the staircase.
4.2
Color connotation
The first part of the experiment was to evaluate what color connotations the target group has for several colors. This is necessary because the literature research showed varying results and especially red, green and blue were evaluated. Also several of the studies had a small sample size and therefor their research can not be taken for granted. In order to evaluate the color connotation for several hues by the target group a survey was conducted.
The survey used the hue colors of the Munsell color system. This system con-sists of five primary hue colors and five secondary hue colors (see fig. 4.1. The primary hue colors are red, yellow, green, blue and purple. These primary colors have a brightness half way the brightness scale and a full chroma. This means that
these colors are fully saturated and show the primary hue. The primary colors of the Munsell system were chosen to use for this connotation survey, because most of the studies used color chips from the Munsell color system.
Figure 4.1: The Munsell hue colors
Each color was evaluated separately. The subject sees the color in a square and is asked to choose between descriptive words, see fig. 4.2.
Figure 4.2: Example question of the color connotation survey
can influence the results of the following color. The total color connotation survey can be found in chapter C.
The color connotation survey was distributed via; social media, whatsapp, email and by addressing people in person. The survey had 74 responses, of which 53 completed the survey. Of the respondents 54.72 percent was male and 45.28 fe-male. The age range was between 18 and 25 years. The respondents were mostly Dutch. One of the participants is colorblind. The results of the color connotation can be found in chapter D and will be further discussed in paragraph 5.1.
4.3
Light scene effect
When the values for the hue, chroma, and brightness have been determined to match the desired behavior, the proposed scenes needed to be tested and evalu-ated. Therefor the SmartXp was converted into an experiment stage. The furniture in each section needed to be identical, the only variable being the color of the light.
4.3.1
Test setup
In order to get good results a good preparation is needed. First data needs to be collected when the light system is off. That data will then function as the normal situation of the SmartXp. During the experiment the only variable that changes needs to be the light scene.
Informed consent
The test subjects need to sign an informed consent in order for me to be able to observe and collect data about them. To inform the students of the SmartXp that the whole room is used as an experimental setup, information posters need to be placed at the entrances. Informing that everyone who enters the room will be part of the experiment, where the information can be found, and who to contact for feedback and questions.
Entrance usage
Effect of the colored sections
To test if the color of light has effect on the focus of the students the produced volume will be measured. In each section the volume will be measure using an decibel measure application on a mobile phone. Each section will be measured for at least 40 seconds walking through the whole section to measure, an average decibel and the maximum volume that was produced in that section. The decibel measurements will be done at intervals of 2 hours, starting at 9:45 and ending at 17:45.
Environmental factors
The light coming in trough the windows changes during the day and can influence the atmosphere. In the critical examination of Veitch [49] the results show that the setting in which the experiment is performed have great influence on the results. Especially, when light is the object of study. Presence of windows, furniture, and color of wall all are variables that influence the intensity of the light and the study [49]. Knowing this it would be a logical step to examine the light system in a controlled environment. However, the study of Fabio states that an application that is tested in a controlled environment could result less effective when implemented in the real environment [?]. The acceptability and usability of the lighting system is important, consequently the system will be examined in the real environment. The results of the experiment can then help improve the system and increase the behavioral intention. Although, the experiment is in the real environment, this does not mean that we can not control this environment. As mentioned in paragraph 2.1, the blinders of the windows can be manually lowered. During the extend of the experiment the following blinders will be closed; skylights 1 and 2, and the windows on the entrance side of the SmartXp. All the sections need the same setup to be able to compare the volume measurements, therefore the furniture in section 1 to 3 needs to be identical. Lastly the fluorescent lights in all the sections need to be turned on, because that is similar to the real environment of the SmartXp. When the fluorescents lights are on, the influence of the windows that are not blinded will be smaller.
Test week
large groups, with an average group size of 13 students. The room was divided into project areas to facilitate the project groups. Every group had its own project area that contained of a large table setting, a toolkit, and tape on the ground to define the area. Because the SmartXp was reserved for this supervised project for the duration of two weeks, the project groups were able to leave materials in their project area.
20-06 This was the first test day, and the normal state of the SmartXP was
eval-uated. The blinders were closed on one side and the blinders of the skylights were closed. The lighting system was off and the fluorescent lights were on. During the day the produced volume of each section was measured and cameras that faced the doors recorded the flow through the doors. This was one of the first days of the supervised project and most groups were complete. The surrounding students sat in section 4, went to the study association, or consulted the technical consultant.
21-06 First day with the lighting system on. The light scene was set to the
su-pervised project use case, with an adjustment to the entrance and stairs settings. During this day the entrances and staircase were set to the color green.
22-06 The light system was set to supervised project again. Entrance 1 was set to
green, entrance 2 and the staircase were set to blue.
23-06 This day the lighting system was yet again set to supervised project.
En-trance 2 and the staircase were set to red and enEn-trance 1 was set to blue.
4.4
UTAUT survey and analysis method
4.4.1
Survey questions
4.4.2
Survey participants
The survey was distributed via the social media, email and by asking in person to respond to the survey. The distribution was amongst students and teacher of Creative Technology. However, only three teachers replied to the survey. Resulting that the age distribution was mainly between below 20 till 25 (see fig. 4.3. The survey got 74 responses of which 52 completed the survey. As shown in fig. 4.3, 58,46 percent of the participants was male, 36,92 percent female, and 4.62 percent did not want to share their gender.
Figure 4.3: Participants’ age distribution
4.4.3
Data analysis
In order for the results to be statistically significant a certain threshold for the sample size needs to be met. The sample size requires at least ten times the number of items that the most complex construct contains [51]. The construct with the most items is called the most complex construct [52]. The most complex constructs of this survey are PE, EE, and FC they all have 5 items. Consequently, the sample size needs a minimum of 50 responses.
Results
5.1
Color connotation results
The results statistical and percentages of the color connotation for each color can be found in chapter D. The data from the survey was used as input for a data vi-sualization program (Quadrigram)1 to make the data interactive and to be able to
compare the results. In fig. 5.1 the data visualization of the connotation of red is visible. Each bar shows the amount of vote that connotation got. The first two bars are the first connotation couple, awake and tired, the graph clearly shows that red was connotated as awake. In the following paragraphs the colors from the literature review (see appendix chapter B) will be compared with the results of the survey (see appendixchapter D), the visualization graphs are included as visual aid.
5.1.1
Red results analysis
According to the literature review red was seen as demanding, intense, strong, excit-ing, warm, and distracting. The results of the survey in fig. 5.1 confirm the connota-tions; warm, exciting, and tensed. The color was further seen as active, interesting, closed and chaotic.
5.1.2
Orange results analysis
Orange was described as warmest color with the positive reactions in the literature. The connotation survey confirms these statements, the color orange was definitely seen as a warm color. The color scored high for the connotations awake, happy, playful, active interesting, open and balanced (see fig. 5.2).
1The data visualization can be found at [53] and is interactive
Figure 5.1: Results of the color connotation for the red color [53]
Figure 5.2: Results of the color connotation for the orange color [53]
5.1.3
Yellow results analysis
[image:56.595.64.510.361.580.2]Figure 5.3: Results of the color connotation for the yellow color [53]
5.1.4
Yellow-green results analysis
The hue between yellow and green has not been researched before, thus can not be compared to literature. The connotations for yellow-green from this survey were; relaxed, happy, passive, serious, open, and balanced.
[image:57.595.93.535.484.710.2]5.1.5
Green results compared
[image:58.595.64.507.193.411.2]Green got the connotation awake, cool, happy, relaxed, interesting, open, and bal-anced. The literature equally uses the connotations balance, happiness, and relax-ing. However, the literature connotated green as boring, and the survey indicates the opposed connotation.
Figure 5.5: Results of the color connotation for the green color [53]
5.1.6
Blue results analysis
When the survey results for the color blue are compared with the results found in the literature the connotations calm, relaxed and cold are similar. Remarkable is, that the blue connotation did not score high for both the relaxed statements. The exciting versus relaxing connotation got a mean of 1.45, in this scale exciting got the value 1 and relaxing 2.
5.1.7
Purple-blue results analysis
Figure 5.6: Results of the color connotation for the blue color [53]
Figure 5.7: Results of the color connotation for the purple-blue color [53]
5.1.8
Purple results analysis
[image:59.595.93.534.344.566.2]Figure 5.8: Results of the color connotation for the purple color [53]
5.1.9
Pink results analysis
Lastly the color pink can be compared with the results from the literature review. The literature stated that pink evoked strong feelings in the participants. The strong feelings can be seen in fig. 5.9. Pink got low variance scores for the connotation couples. Pink was seen as; awake, warm, exciting, happy, active, tensed, playful, interesting, open, and chaotic.
[image:60.595.63.508.496.714.2]5.2
Light scene effect results
5.2.1
Volume
[image:61.595.102.519.298.547.2]The data of the dB measurements during week 25 can be found in chapter I. The average and maximum volumes are listed there per section per day. In fig. 5.10 the average volume of the first day, when the light system was off, is visible. The figures 5.11, fig. 5.12, and fig. 5.13 show the average measurements of each section during the days that the lighting system is active. All the measurements are within the dB range of a normal conversation. On 20-06 there was a peak at 11:45 in section 2 (see fig. 5.10).
Figure 5.11: Average volume on 21-06 day 2 of the experiment week, light scene: Supervised project, Entrance 1: Green, Entrance 2: Green, and Stairs: Green
[image:62.595.75.492.436.685.2]Figure 5.13: Average volume on 23-06 day 4 of the experiment week, light scene: Supervised project, Entrance 1: Blue, Entrance 2: Red, and Stairs: Red
5.2.2
Entrance usage
The data for the entrance usage have been excluded from this report due to mal-functioning equipment. However, the observations will be discussed in this section.
20-06 In the normal situation the entrances and the stairs were used regularly.
21-06 This was the first day the lights were officially on and the entrances were
set to green. To test if the posters were clear a user evaluation took place. Most of participants did not notice the instruction poster. The participants who did notice the poster, did not take the time to read it. Different positions for the poster were tested, but the position did not effect the notability of the poster. Both entrances and the stairs were used regularly.
22-06 During this day the lights on the entrance 2 and the stairs were set to blue.
The blue color indicated that the entrance or stairs may be used but only quietly. However, the students did talk while walking in.
23-06 This day the entrance 1 was set to blue, and entrance 2 and the stairs to
entrance or up the stairs.
5.3
UTAUT analysis linear regression
The complete linear analysis outputs can be found in chapters F to H. The tables that are used for the UTAUT analysis are also displayed in the next paragraphs.
5.3.1
Significance
For the linear regression analysis, the stepwise method was chosen to filter the sig-nificant constructs from the insigsig-nificant constructs. In fig. 5.15 the ANOVA method is used to test the statistical significance of each step from the stepwise model. The significance for all the steps is below .0005, the steps are therefor accepted as significant. Below the table the constructs of the steps can be seen. For the depen-dent variable BI the constructs PE, and EE have significant effect. In fig. 5.14 the R value (which is the linear correlation coefficient) goes up with each step, showing that the each independent variable that is added as a predictor variable strengthens the correlation for predicting the independent variable. A correlation of +1 indicates a perfect fit [54]. In the correlation table fig. 5.18 only the constructs themselves have a perfect correlation fit. The stepwise method for choosing the constructs can be seen in fig. 5.16 and fig. 5.17. For the linear regression with BI as dependent variable, the significant constructs were PE, EE, and USE. For the linear regression of dependent variable USE only BI was a significant construct.
Figure 5.14: ANOVA
5.3.2
Linear regression model dependent variable BI
Figure 5.15: Model summary
Figure 5.16: Stepwise analysis of the significant regression variables with the dependent variable BI
Figure 5.17: Stepwise analysis of the significant regression variables with the dependent variable USE
between EE and BI is 0.592. Looking at the coefficients table (see fig. 5.20) the standardized beta weights helps predict which predictor variable is best, both PE and EE have a positive standardized beta weight. Therefore, a positive value for PE or EE will give a positive value for BI. The beta weight of PE is higher than the beta weight of EE, consequently PE is better at predicting BI than EE. However, the R value for step 2is higher than for step 1(see 5.14), resulting in the constructs together being better at predicting the behavioral intention than by themselves. This is corresponding to the original UTAUT model [38].
5.3.3
Linear regression model dependent variable USE
Figure 5.18: Correlation table for the complete UTAUT model compiled with the linear regression model
Figure 5.19: Linear regression estimates for the dependent variable BI
5.4
UTAUT analysis Path analysis
[image:68.595.79.481.299.658.2]In addition to the linear regression analysis the path analysis was executed. In fig. 5.21 the model that was made in AMOS can be seen. Each construct is an collection of items, each item being a question of about the topic of the construct. The regression weights table the regression weights, the standard error and the probability values are shown (see fig. 5.22). The probabilities of the regression weights between the constructs and the dependent variable BI are to high to be of significant value. The last column in the assessment of normality (see fig. 5.23 confirms that the significance is too low because the critical values are negative.PEP
5.5
UTAUT results per construct
Figure 5.24: Results of the UTAUT survey regarding the Performance Expectancy construct
Figure 5.25: Results of the UTAUT survey regarding the Effort Expectancy construct
Figure 5.27: Results of the UTAUT survey regarding the Facilitating Conditions construct
Figure 5.28: Results of the UTAUT survey regarding the Self-efficacy construct
Figure 5.30: Results of the UTAUT survey regarding the Anxiety construct
Figure 5.31: Results of the UTAUT survey regarding the Behavioral intention construct


![Figure 5.2: Results of the color connotation for the orange color [53]](https://thumb-us.123doks.com/thumbv2/123dok_us/9739761.474895/56.595.65.508.86.304/figure-results-color-connotation-orange-color.webp)
![Figure 5.4: Results of the color connotation for the yellow-green color [53]](https://thumb-us.123doks.com/thumbv2/123dok_us/9739761.474895/57.595.93.536.86.307/figure-results-color-connotation-yellow-green-color.webp)
![Figure 5.5: Results of the color connotation for the green color [53]](https://thumb-us.123doks.com/thumbv2/123dok_us/9739761.474895/58.595.64.507.193.411/figure-results-color-connotation-green-color.webp)
![Figure 5.7: Results of the color connotation for the purple-blue color [53]](https://thumb-us.123doks.com/thumbv2/123dok_us/9739761.474895/59.595.93.535.87.304/figure-results-color-connotation-purple-blue-color.webp)
![Figure 5.8: Results of the color connotation for the purple color [53]](https://thumb-us.123doks.com/thumbv2/123dok_us/9739761.474895/60.595.63.508.496.714/figure-results-color-connotation-purple-color.webp)
