Neurophysiological support for enhanced
attentional processing through the practice of
mindfulness
Masterthesis Yuna van den Adel
University of Twente
Enschede
2015
First supervisor:
R.H.J. van der Lubbe
Second supervisor: M. Tjepkema Cloostermans
Studentnr:
s1384988
2
Abstract
In this study it is examined whether participating in the Mindfulness Bases Stress Reduction (MBSR)
training enhances attention processing. The electroencephalogram of 32 participants was measured
before and after the training and analyzed through the Lateralized Power Spectra. Both between- and
within group results have been analyzed. It was expected that the enhanced attentional processing
would be revealed by increased ipsilateral α and θ power compared to contralateral power. Results on
the α-bands revealed increased ipsilateral α-power compared to contralateral α-power in both analyses.
In the within group analysis on the θ2-band unexpected decrease of ipsilateral power compared to
contralateral power was found. On the θ3-band increased ipsilateral power has been visible in the
between group analysis. These results indicate a positive effect of mindfulness on attentional
processing. The significance of the results is elucidated in the discussion and recommendations for
3
Table of Contents
Abstract ... 2
1. Introduction ... 4
1.1. Support for effects of mindfulness ... 4
1.2. Attentional processes involved in mindfulness ... 4
1.3. Research method Lateralized Power Spectra ... 5
1.4. Supramodal attention control ... 6
1.5. Design of the study: between- and within group comparisons ... 7
1.6. Hypothesis: lateral differences on the α-band and the θ-band with cross-modal interaction ... 8
2. Method ... 8
2.1. Participants ... 8
2.2 Inclusion and exclusion criteria ... 8
2.3. Design ... 9
2.4. MBSR-training ... 9
2.5. Procedure ... 9
2.6. Stimuli and task ... 9
2.7. Recordings and data processing ... 11
2.8. Data analyses ... 11
2.8.1. Questionnaire data ... 11
2.8.2. Statistical approach ... 11
3. Results ... 12
3.1. Questionnaire data ... 12
3.2. EEG analyses of the cue-target interval ... 12
3.3.1. Overall between group effects ... 13
3.3.2. Between group differences ... 17
3.3.3. Overall effects for the within group analyses ... 18
3.3.4. Within group differences ... 22
4. Discussion ... 23
4.1. Within- and between group results ... 23
4.2. Top down modulation ... 24
4.3. Supramodal attention control ... 25
4.4. Critical notes ... 26
4.5. Conclusion ... 27
4
1. Introduction
1.1. Support for effects of mindfulness
Meditation is a strong emerging phenomenon in the west, in which mindfulness is one of the widest
spread techniques. Mindfulness is defined as “paying attention in a particular way: on purpose, in the
present moment, and non-judgmentally” (Kabat-Zinn, 1994, p. 4). Nowadays this form of meditation
is often used in clinical settings as a health care intervention. The first developed and most cited of
these mindfulness programs is Mindfulness Based Stress Reduction (MBSR; Kabat-Zinn, 1982; Baer,
2003). This program is widely implemented for treating chronic pain, depression, anxiety, stress and
chronic somatic diseases. Also the clinical effectiveness of this program is repeatedly reported (Baer,
2003; Bohlmeijer, Prenger, Taal & Cuijpers, 2010; Carlson, Speca, Patel & Faris, 2007; Miller,
Fletcher & Kabat-Zinn, 1995).
Mindfulness, as practiced in the MBSR program, is thought to improve the mental- and physical
health by means of focusing on somatic sensations in a neutral non-judgmental way. Furthermore,
MBSR is suggested to improve the control of attention (i.e. self-regulation; Bishop et al., 2004;
Chiesa, Serretti, & Jakobsen, 2013). The fundament of mindfulness therefore may be seen as a
modification of attentional processing. However, the support for this claim is still limited. Partly this is
due to the fact that most studies on mindfulness are evaluating the efficacy based on the subjective
support of self-reports. Self-reports are limited in providing strong support as there are many potential
problems with errors on the parts of the respondents. Secondly, the support is still not very strong due
to the fact that studies focussing on objective outcomes, such as electroencephalogram (EEG), often
shortfall in the application of standardized designs (Shapiro, Carlson, Astin, & Freeman, 2006; Cahn,
& Polich, 2006, Chiesa et al., 2013). To overcome these shortcomings in this study a randomised
design will be used. Both between- and within group results will be analysed in order to gain more
thorough support for the modification of attentional processing by means of mindfulness. When
similar effects are visible in both analysis then this will provide stronger evidence for the effects of
mindfulness.
1.2. Attentional processes involved in mindfulness
The basic concept in mindfulness is to attend to objects of observations, such as breathing and bodily
sensations, in a neutral and non-judgmental mode. By changing the attentional processes participants
learn to self-regulate their focus of attention on somatic sensations (Kerr, Sacchet, Lazar, Moore &
Jones, 2013). Mindfulness is thought to appeal to higher order of attention in which attention is
consciously and intentionally aimed at relevant information for the current cognitive goal (Shapiro et
al., 2006). As the direction of attention towards an object of the environment is guided by higher
5
Bishop et al. (2004) have suggested that mindfulness increases both the efficiency of sustained
attention as the switching of attention. The first, sustained attention, is to keep a state of alertness over
prolonged periods of time (Posner & Rothbart, 1992). According to Bishop and colleagues (2004) in
mindfulness meditation sustained attention is the maintenance of awareness of the current experience.
Previous research revealed a reduction in the P3 component after participating in an MBSR program
when presented with a nociceptive stimuli (Van der Lubbe, De Kleine, Blom, Schreurs & Bohlmeijer,
2013). The P3 component is suggested in a review by Polich (2007) to indicate a decrease in the ‘call for attention’ which would reflect an increase in the efficiency of sustained attention. As the P3 is
observed to be more reduced when higher intensity stimuli is delivered at the to-be ignored side, it is
proposed to indicate suppression (Van der Lubbe et al., 2013). These results suggest that mindfulness
indeed improves the self-regulation of sustained attention. Comparable effects might be present for the
efficacy of transient attention (i.e. switching of attention). This is a flexible state of attention in which
the focus shifts from one object to another (Posner, 1980). One of the main exercises in the MBSR
training is the body-scan practice of: “moving a focused spotlight of attention from one part of the body to another” (Kerr et al., 2013, p 2). This can be seen as transient attention as the participants are
switching their attention between body parts. Also Bishop and colleagues (2004) have proposed that
the switching of attention is necessary in order to bring attention back to the object of observation
when being distracted. Switching of attention is important in every mindfulness practice. Therefore, in
this study the transient attentional modifications through the practice of mindfulness are examined.
1.3. Research method Lateralized Power Spectra
The neurophysiological mechanisms underlying attentional processes might be revealed by changes in
the different frequency bands. Oscillation in the α-band (̴8 – 13 Hz; known since Berger, 1929) has
been associated with attentional processes, and the relation with mindfulness has been frequently
reported (Chiesa & Serretti, 2010; see also Cahn & Polich, 2006). Whereas previously α-power has
been seen as a cortical idling state (Pfurtscheller, Stancak & Neuper, 1996), more recent theories claim
that modulation of α-power reflects the suppression and inhibition of task-irrelevant information. Also
oscillations in the θ-band (̴4 – 8 Hz) are frequently reported to correlate with attentional processes, as
well as to relate with mindfulness (Chiesa & Serretti, 2010; see also Cahn & Polich, 2006). This
θ-power is seen as a process that: “brings together activity of sensory- and/or memory activated neurons in time, thereby affection behavioral output and plasticity” (Buzsáki, 2002, p 336). It is argued that
θ-power reflects enhanced encoding and retrieval of new information (Staudigl & Hanslmayr, 2013).
However, the problem in research on modulation in the frequency bands is that the changes that are
found might be due to hemispherical changes. It is stated that lateral differences are highly relevant in
attentional processes (Posner & Petersen, 1989; Vallar & Perani, 1986). To gain further inside into
these hemispherical differences in attentional regulation a new method is developed: the so called
6
Abrahamse, 2014). The LPS method is developed as an alternative to Event Related Lateralizations
(ERLs; De Kleine & Van der Lubbe, 2011; Oostenveld, Stegeman, Praamstra & van Oosterom, 2003;
Van der Lubbe & Utzerath, 2013). ERLs show the relevant hemispherical differences as a reaction to a
specific event, the so called evoked activity. However, the averaging over trials in ERPs and ERLs
might exclude relevant information of the variation that takes place over trials and between individuals
(Buzsáki, 2006). As for the calculation of LPS the raw EEG data is used, the LPS includes information
of the variation, therefore providing more thorough insight into attentional processes (Van der Lubbe
& Utzerath, 2013). First examination of the LPS method showed activity in the LPS that wasn’t visible
in the ERLs (see Van der Lubbe & Utzerath, 2013). This suggests that effects have indeed been
cancelled out in the ERLs due to phase differences between trials and participants. As this makes the
LPS highly relevant for examining lateral differences in this study the LPS method will be used to
examine the modulation of attentional processing. In this study the following ten symmetrical
electrode pairs will be analyzed: FC5/FC6, C3/C4, CP3/CP4, CP5/CP6, P3/P4, P5/P6, P7/P8,
PO3/PO4, PO7/PO8 and O1/O2. To a large extent these electrode pairs are comparable to LPS
analyses done by Van der Lubbe and colleagues (2014) on spatial attention. These electrode pairs
overlay the potentially relevant brain areas like the hand motor areas, parietal areas, occipito-parietal
areas, and occipito-temporal areas. As the focus of this study is on α-power and the θ-power the
frequency bands that will be are analyzed are: θ1 (3.2 – 4.8 Hz),θ2 (4.2 – 6.3 Hz), θ3 (5.5 – 8.2 Hz), α1
(7.2 – 10.7 Hz) and α2 (9.4 – 14.0 Hz).
1.4. Supramodal attention control
In spatial attention often several sensory modalities are involved as information comes from different
sensory modalities. It is thought that integration of different sensory modalities is required for adaptive
control of behavior (Eimer, Van Velzen & Driver, 2002; Spence & Driver, 1997; Ward, McDonald &
Golestani, 1998). This integration is called cross-modal interaction.
Spence, Pavani and Driver (2000) presented participants with visual targets on the left or right
side, and tactile targets on the left or right hand. In various blocks, one of these target modality was
more likely to occur than the other, and targets within this primary modality were highly likely to
occur on one side. The targets in the secondary modality were somewhat more likely on the other side.
For stimuli presented on the side attended in the primary modality the reaction times (RTs) were
faster. This was for both within that modality and also in the secondary modality, revealing
cross-modal interaction. Another research of Eimer and Driver (2000) showed similar effects. Endogenous
attention on the left or right side within either touch or vision was instructed, while ignoring the
task-irrelevant modality. On the visually attended side the attentional modulation of the P1 and N1
components were observed, which were also found when attending to tactile stimuli. For tactile stimuli
7
in touch. The same modulations of somatosensory ERPs were observed when endogenous attention on
the left or right side within vision was instructed.
Furthermore, it is claimed that there is supramodal attention control independently of which
modality is attended to. Supramodal attention is thought to be a kind of spatial presentation related to
the visual modality. Research with a somatosensory modality task quite similar to the one used in this
study is done by Eimer, Van Velzen, Forster & Driver (2003). They have given participants the
instruction to detect infrequent tactile targets delivered to the cued hand while ignoring visual stimuli.
Even when the room was darkened processing of task-irrelevant visual events was still modulated by
spatial attention for the tactile task. The conclusion was made that the crossmodal attention control is
independent on selection being guided by ambient visible information in a lit environment. According
to the authors this suggests that spatial shifts of attention are controlled supramodally (Eimer et al.,
2003). For the task used in this study in which subjects are instructed to attend to their hands
supramodel attention control can be expected. Even though subjects are in a dark room and instructed
not to look at their hands, it is possible they are directing attention to either the left or right space
where the to-be-attented hand is.
1.5. Design of the study: between- and within group comparisons
In order to test the hypothesis two groups of randomly assigned healthy young adults concurrently
received an MBSR training. First the between group effects will be analyzed, and next the within
group effects. The results of both the between and within group analysis will be compared in order to
give more thorough support for the effect of MBSR on transient attention. When the expected effects
are present in both the between- and in the within group analysis this will provide strong support for
the hypothesis that MBSR increases the efficacy of transient attention. Both analyses consist of an
exploratory t-test, to see whether there are effects of lateralization present. For the bands, electrodes
and time windows where lateralization is visible, further analyses will be done to see if these effects
are representing differences between / within the groups.
The between group results consist of measures of group 1 prior to the MBSR training and group 2
direct after the MBSR training. In the second analysis the within group results of group 1 prior the
MBSR training and the same group direct after the MBSR training will be examined. For both
analyses EEG data, of the 1-s cue target interval, derived from an endogenous Posner cuing paradigm
(Posner, 1980) will be used. In this paradigm, which is often used to research spatial attention, a cue is
provided that indicates with some validity the location of the target. In this study the cued location is
either the left or right forearm, where nociceptive stimuli are given intracutaneously. If the cue
indicates pseudo randomly the to-be attended sides from trial to trial this is considered as a transient
attention paradigm. This study will focus on these transient attentional mechanisms underlying
8
to the left or right forearm is reflecting the mean practice of MBSR where the attention is focused on
somatic sensations (Kerr et al., 2013).
1.6. Hypothesis: lateral differences on the α-band and the θ-band with cross-modal interaction
In this study it is expected that the efficiency of transient attention is enhanced by practicing
mindfulness. This modulation of attentional processing is expected to be visible in the α- and θ bands.
In previous research increased ipsilateral α-power was present when covert attention was directed to one visual field. This increased ipsilateral α-power is thought to reflect an inhibition of the task-irrelevant side, whereas decreased α-power in the contralateral hemisphere is reflecting disinhibition
of the task-relevant side (Handel, Haarmeier & Jensen, 2011; Kelly, Gomez-Ramirez & Foxe, 2009;
Rihs, Michel & Thut, 2007; Thut, Nietzel, Brandt & Pascual-Leone, 2006; Van Gerven & Jensen,
2009; Worden et al., 2000). In line with these findings, it is expected to find on the α–band increased
ipsilateral power compared to contralateral power, as an indication of enhanced efficacy of focussing
of attention. Similarly, increased ipsilateral power on the θ-band is expected.
Furthermore, supramodal attention control is assumed to be involved. Therefore, the
hypothesis it is expected to find activity in the occipito-parietal cortex and the somatosensory cortex
(involved in attending to a part of the body).
2. Method
2.1. Participants
In this experiment 34 students, 5 male and 29 female, from the Faculty of Behavioral Science of the
University of Twente participated, and in exchange were given the Mindfulness Based Stress
Reduction training free of any costs. The age of the participants varied between 20 and 34 years, with
a mean age of 23.7 years (SD: 3.3). One participant was left-handed, one ambidexter and 32 right handed, as assessed with Annet’ handedness inventory (Annet, 1970). All participants had a normal or corrected to normal vision, were free of pain and didn’t use painkillers before the experiment. Prior to
the experiment all participants signed an informed consent, and agreed to participate in two EEG
sessions, with each a duration of three hours. For each participant the Five Facet Mindfulness
Questionnaire – short form (FFMQ – SF; Bohlmeijer, Ten Klooster, Fledderus, Veehof & Baer, 2011)
was administered before each session, assessing the degree of mindfulness. The study was approved
by the medical ethical commission of the ‘Medisch Spectrum Twente’ (NL 37791.044.11).
2.2 Inclusion and exclusion criteria
The participants had to be aged between 18 and 65 years. Participants were not to consume any
9
physical- or mental disorders, neurological illness, motor skill problems, physical complaints of pain
and poor visual capacity where exclusion criteria. Using these criteria one participant was excluded,
because of reported to be dyslectic.
2.3. Design
Participants were randomly assigned to group 1 or group 2. Both groups concurrently received an
MBSR training, and participated in an EEG experiment consisting of two EEG sessions. The first
session for group 1 was before the MBSR training and the second session was right after the training.
The first session for group 2 was right after the training and the second session was eight weeks after
the training. In this study a between group comparison is made for which the first session of group 1 is
compared with the first session of group 2. Next, a within group comparison is made for which the
first and second session of group 1 are compared.
2.4. MBSR-training
The Mindfulness Based Stress Reduction training had a duration of eight weeks, in which the
participants took part in weekly group sessions of 2.5 hours. Besides these sessions the participants
had homework assignments which took about 45 minutes for 5 days a week. Participants kept a log of
their practice at home, which indicated the range of practice at home was between 17 and 53 days (M:
40, SD: 9.0). The content of the training was according to the standard of the MBSR protocol. Except
in this study the full-day session at the end of the training was excluded. According to the protocol the
training also was conducted by an experienced teacher of meditation and yoga. The training existed of
the body scan, mindfulness meditation, meditative walking, yoga and mindful-communication (for
more details see Hulsbergen, 2009). The aim of the training was to improve attention during daily
activities and to becoming more aware in the present moment.
2.5. Procedure
Each EEG session had a duration of approximately three hours and was held at the University of
Twente. In the EEG session participants perceived eight random presented stimuli: four on the right-
and four on the left forearm, and each side were delivered two low intensity and two high intensity
stimuli. The EEG session started with applying the EEG electrodes and stimulation electrodes on the
right and left forearm at the dorsal wrist. At the start of the Posner task the room was darkened.
2.6. Stimuli and task
The participants were seated at approximately 60 cm of the computer screen during the experiment.
10
The instruction was given to gaze at the center of the computer screen. First a white fixation cross
(1.05° x 1.05°) was shown for 1200 ms in a black background after which it was replaced by a cue for
400 ms. The cue, a rhomb (5.15° x 2.20°) consisted of a red and green triangle pointing to opposite
directions (left and right). At the beginning of each block of trials, the relevant color was given.
Participants were instructed to attend to the forearm indicated by the relevant colored triangle of the
cue. The cue alternated between blocks. This true/false rate of the cue was 50%. After the cue the
fixation cross was shown for 4600 ms. During this interval, 600 ms after rhomb offset, an
intracutaneous stimulus was delivered. The nociceptive stimuli were randomly presented on the left or
the right forearm and given either as a high intensity of five pulses or as a low intensity of two pulses.
Half of the participants were told only to react on high intensity stimuli, while the other half of the
participants were told to react only on low intensity stimuli. The instruction was to react by pressing
the foot pedal when the relevant intensity of nociceptive stimuli was presented at the attended hand,
which was the case in 25% of the times. The individual participant’s sensation-, pain- and pain
tolerance threshold was identified in a pretest by increasing the amplitude from zero with steps of 0.1
mA. The sensation threshold was explained to the participants as the first amplitude they could detect;
the pain threshold was described as a somewhat painful prickling sensation, and the pain tolerance
threshold as the maximal amplitude the participants allows to apply during the experiment. The
experiment consisted of four blocks, each consisting of 96 trials. Two blocks contained a sustained
attention version in which the cue indicated one to be attended hand for the first half of the block, and
the second half of the block the other to be attended hand. Whereas the other two blocks consisted of a
transient attention version, pseudo randomly alternating cue sides from trial to trial. The latter is used
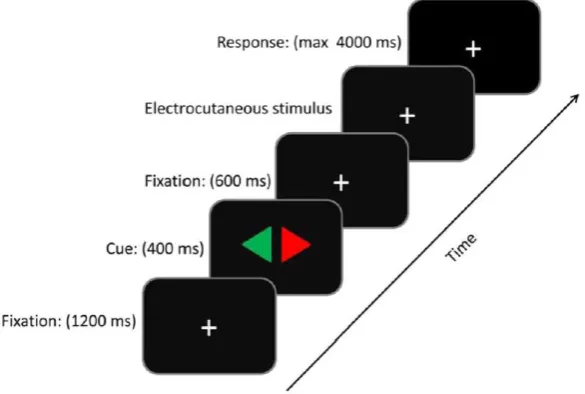
[image:10.595.77.370.491.688.2]in this study.
Figure 1. The sequence of event on a trial. At the start of a trial a fixation cross was shown for 1200
ms. Thereafter a cue was presented for 400 ms. Next, the fixation cross was shown again. The
electrocutaneous stimulus followed 600 ms after the cue. Participants had 4000 ms time to give a
11
2.7. Recordings and data processing
Stimulus presentation, response registration and production of external triggers were controlled by
E-Prime Software (version 2.0). The EEG and EOG were amplified with a Quick-Amp amplifier (72
channels, DC) and were recorded with Brain Vision Recorder (version 1.05). EEG was recorded from
61 Ag/AgCl ring electrodes located at standard positions of the extended 10/20 system. An online
average reference was employed. EOG was recorded bipolarly, vertically from above and below the
left eye and horizontally from the outer canthi of both eyes. Electrode impedance was kept below 5kΩ.
The EEG and EOG were sampled at a rate of 500Hz, and digitally filtered online (low-pass 140 Hz,
DC). For the behavioral analysis, pedal presses and digital codes related to stimulus events were
recorded and registered. The statistical tests were conducted with SPSS (statistical package of the
social sciences, version 21.
2.8. Data analyses 2.8.1. Questionnaire data
The Related-Samples Wilcoxon Signed Rank Test was used to analyze the FFMQ-SF scores for the
within group results. The Independent-Samples Wilcoxon Signed Rank Test was used to analyze the
FFMQ-SF scores for the between group results.
2.8.2. Statistical approach
Analyzing of the EEG data was carried out with Brain Vision Analyzer 2.0.4 (Brain Products GmbH,
2012). The data was first segmented in -500 ms to 2500 ms intervals relative to the markers that
signaled the cue with a baseline set from -100 ms to 0 ms. Trials with horizontal and vertical eye
movements were removed when amplitudes on the hEOG en vEOG channels exceeded the values
+/-60 µV and +/- 120 µV, respectively. The value of +/- +/-60 µV is approximately corresponding with 3
degrees horizontal eye movement. Even though participants were instructed not to look at their
attended side (i.e., the left or right forearm), mistakenly eye movements to the attended side are
excluded with this procedure. Furthermore, trials were removed in which eye movements were
detected from 0 ms to 1000 ms relative to stimulus, which left on average 85% of the trials.
Subsequently, EEG channels containing artifacts were removed by using individual channel mode
(gradient criterion: 100µV per 1 ms, low activity criterion: 0.5 µV for 100 ms and when exceeding the
values +/- 200 µV for frontal electrodes, +/- 150 µV for central electrodes, and +/- 100 µV for parietal
electrodes). On average the number of trials removed varied from .008% to 8.90%.
Next, time windows of 50 ms were segmented to evaluate the time range from 200 – 1000 ms after
cue onset time. The activity for ten electrode pairs was explored: FC5/FC6, C3/C4, CP3/CP4,
CP5/CP6, P3/P4, P5/P6, P7/P8, PO3/PO4, PO7/PO8, O1/O2. For this the power of different frequency
12
steps, by performing a wavelet analysis on the raw EEG. A complex Morlet wavelet was chosen with
Gabor normalization. The five frequency bands (see table 1) were specified: θ1 (3.2 – 4.8 Hz), θ2 (4.2 –
6.3 Hz), θ3 (5.5 – 8.2 Hz), α1 (7.2 – 10.7 Hz) and α2 (9.4 – 14.0 Hz).
Individual averages of these estimates were computed, per side of the relevant condition. Next,
normalized lateralization indices ([ipsilateral – contralateral] / [ipsilateral + contralateral]) were
calculated for the different frequency bands, both for the left and right relevant side. These power
indices were computed for all symmetrical electrode pairs. Furthermore, an average was computed
across the indices for both relevant sides, thereby constructing the LPS through the following formula:
(see Van der Lubbe & Utzerath, 2013). Values of the LPS vary from -1 to +1. A positive sign indicates
that the power within a specific frequency band was larger above the hemisphere ipsilateral to the cued
side than contralateral, whereas a negative sign indicates the opposite pattern. A value of zero signifies
the absence of hemispherical differences.
The analyses for both the between- and the within group comparisons consisted of a t-test
followed by a One Way Anova. To reduce the possibility of a Type 1 error, a strict significance
criteria of ρ < .005 was used for four consecutive time windows. The One Way Anova was carried out for those effects that were visible on the t-test. It was felt that for this second procedure a less strict
criteria was needed, therefore a significant level of ρ < .05 was used.
3. Results
3.1. Questionnaire data
The FFMQ-SF was presented to all the participants to assess the self-reported mindfulness at the start
of the study and immediately after the MBSR training. The MBSR training led to increased
self-reported mindfulness for participants in the within group analyses (Z = -2.0, p = .047) and for the between group results (Z = -3.9, p < .001). The subscales Conscious-acting (Z = -2.0, p = .048), and Non-reactive (Z = -2.2, p = .025) were improved for the within group analyses. The subscales Observing (Z=-3.1, p = .002), Conscious-acting (Z=-2.3, p = .019) and Non-reactive (Z=-3.6, p < .001). Overall this suggests that both groups increased in their self-reported mindfulness.
3.2. EEG analyses of the cue-target interval
The overall between group results that fulfilled the significance criteria (four consecutive time
windows, p < .005) are depicted in Table 2. These are the t-test results, revealing all electrode pairs that are significantly deviating from zero. Results for the group differences that fulfilled the
13
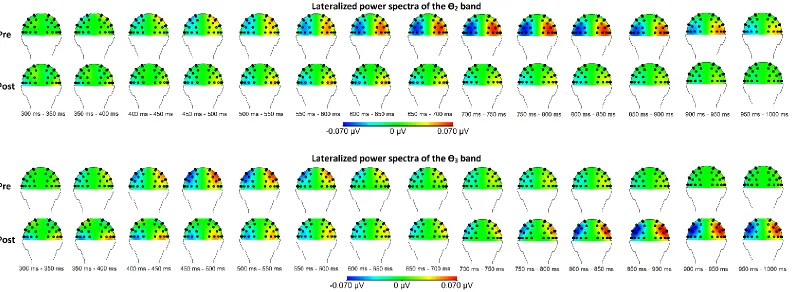
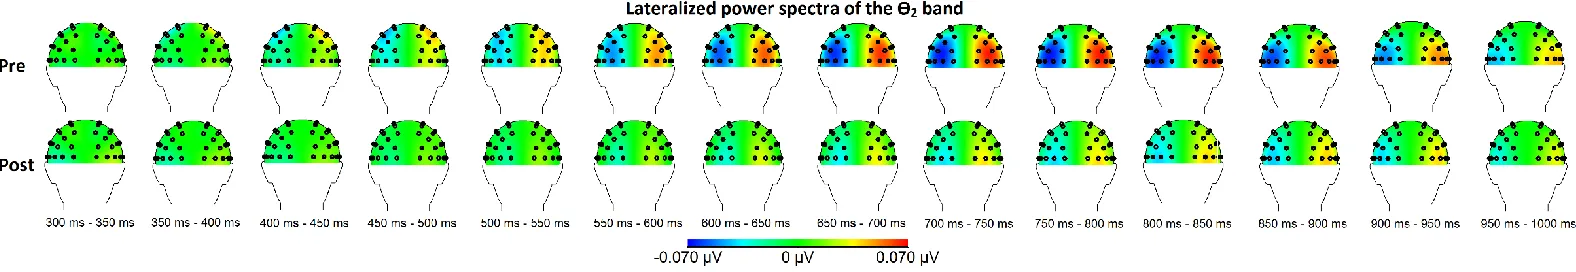
and post-condition (i.e. before and right after the MBSR training). Topographical maps of the relevant
frequency bands for the between group comparison are shown in Figure 2 for the θ-bands and Figure 3
for the α-bands. The overall within group results that fulfilled the significance criteria (four
consecutive time windows, p < .005) are depicted in Table 4. In the within analyses only the four frequency bands that revealed significant between group differences have been analyzed (θ2, θ3, α1 and α2). Results for the group differences that fulfilled the significance criteria (p < .05; only for those effects that were visible in the overall results) are depicted in Table 5. The topographical maps of the
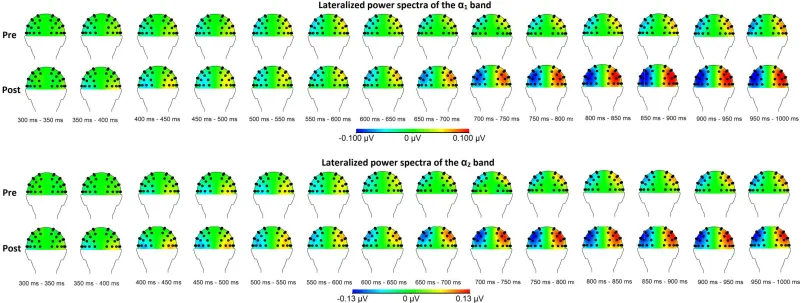
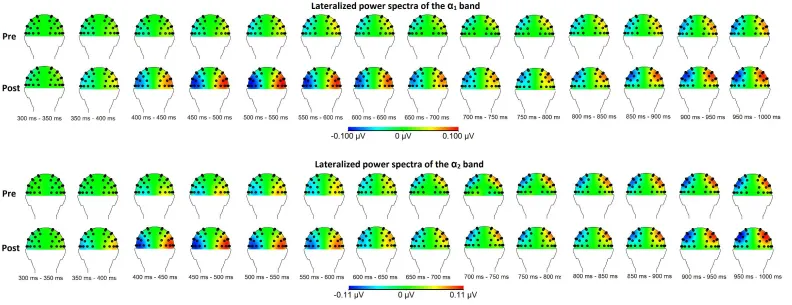
frequency bands for the within group comparison are shown in Figure 4 for the θ-bands and Figure 5 for the α-bands.
3.3.1. Overall between group effects
The overall LPS results for both groups revealed significant deviation from zero in all five frequency
bands (θ1, θ2, θ3, α1 and α2; see Table 2). For the lowest θ1 band a significant deviation from zero was
visible at parietal-, occipital- and occipito-parietal sites starting at 200 ms to 550 ms after cue onset.
The most pronounced and most significant at the P3/P4 electrode pair (from 200 – 450, t(33) > -3.45,
ρ < .0015). This negative t-value indicates that the contralateral power was higher compared to the ipsilateral power in the θ1 band. For the θ2 band a significant deviation from zero was visible at
parietal, occipito-parietal- and parito-central sites from 450 – 1000 ms after cue onset. All effects were
higher ipsilateral power compared to the contralateral power. The longest, most pronounced and most
significant at the PO7/PO8 electrode pair (from 450 to 1000 ms, t(33) > 2.98, ρ < .0015). For the higher θ3 band a significant deviation from zero was visible at parietal, occipito-parietal and
parito-central sites from 300 to 1000 ms after cue onset. All effects were higher ipsilateral power compared
to the contralateral power. The longest, most pronounced and most significant at the CP5/CP6
electrode pair (from 450 to 650 ms and from 750 – 1000 ms, t(33) > 2.98, ρ < .0025). For the lower α1 band a significant deviation from zero was visible at parietal, occipito-parietal-, central- and
parito-central sites from 350 to 1000 ms after cue onset. All effects contained of a higher ipsilateral power
compared to the contralateral power. The most pronounced and most significant at the P5/P6 electrode
pair (from 500 to 1000 ms, t(33) > 3.54, ρ < .001). For the upper α2 band a significant deviation from zero was visible at parietal, occipito-parietal-, central- and parieto-central sites from 350 to 1000 ms
after cue onset. The most pronounced and most significant at the P5/P6 electrode pair (from 400 to
14
Table 2: Overall Between Group Effects for Electrode Pairs When the Significant Criterion was Crossed for at Least Four Successive Time Windows.
Wavelets LPS
Band Windows (ms) Maxima t(33)
θ1 200 - 450 P4 -3.45* - -4.16*** 250 - 550 PO4 -2.98* - -3.95*** θ2 450 - 950 P6 3.10* - 4.85***
450 - 1000 PO8 2.98* - 5.00*** 500 - 950 P8 2.88* - 4.35*** 500 - 850 P4 2.77* - 3.22* 500 - 900 O2 2.81* - 3.88*** 650 - 850 CP6 3.13* - 3.72** 700 - 950 PO4 3.21* - 3.88*** θ3 300 - 600 P8 2.94* - 3.89*** 350 - 600 P08 2.81* - 4.78*** 400 - 700 P6 2.82* - 4.27*** 450 - 650 CP6 3.05* - 4.00*** 450 - 650 P4 2.86* - 3.24* 500 - 700 CP4 2.78* - 3.28* 700 - 1000 P4 2.93* - 4.21*** 750 - 1000 CP6 3.00* - 4.27*** 750 - 1000 P6 2.97* - 3.66** α1 350 - 1000 CP6 2.77* - 6.00***
400 - 600 PO8 3.13* - 3.68** 400 - 500 PO4 2.85* - 2.78** 500 - 1000 CP4 3.04* - 5.39*** 500 - 1000 C4 3.70** - 4.42*** 500 - 700 P8 2.95* - 3.54** 500 - 1000 P6 3.54** - 6.03*** 600 - 1000 P4 3.02* - 4.75*** 800 - 1000 PO8 3.59** - 4.34*** 850 - 1000 PO4 2.78* - 3.50** α2 350 - 1000 P8 2.74* - 4.49***
350 - 600 PO8 2.89* - 5.26*** 400 - 1000 CP6 3.10* - 7.35*** 400 - 1000 P6 3.32* - 5.33*** 500 - 1000 C4 3.04* - 5.18*** 500 - 1000 CP4 2.88* - 7.04*** 500 - 1000 P4 2,87* - 6,01***
Note: Effects are described in terms of ipsi-contralateral differences (therefore P4, PO4 etc.). Positive
outcomes = ipsilateral power higher than the contralateral power; negative outcomes = contralateral
15
Figure 2: Topographical maps of the between group results for the relevant θ-bands before and after the MBSR training. Here, the left hemisphere reflects
contra vs. ipsilateral power, whereas the right hemisphere reflects ipsi vs. contralateral power. Thus negativity at the left hemisphere means that the power in a
specific frequency band (e.g., the θ2 band) was higher above ipsilateral than above contralateral sites. Pre = before the MBSR training; post = after the MBSR
16
17
3.3.2. Between group differences
Separate analyses of the group differences showed significant lateral differences between groups in the
bands θ2, θ3, α1 and α2 (see Table 3). For the lowest θ1 band no significant differences between the
groups were obtained. For the θ2 band differences between the groups were visible at parietal- and
occipital sites from 650 ms to 800 ms after cue onset. At the P3/P4 electrode pair (from 650 to 750 ms,
F(1,32) > 4.34, ρ < .05) the mean of group 1 (M = .06, SD < .08) is significantly higher than the mean of group 2 (M = .01, SD < ,05). This difference between groups is indicating more ipsilateral power in
group 1 compared to group 2, thus a decrease of ipsilateral power in the θ2 band after receiving a
MBSR training. At the P5/P6 electrode pair a similar effect of decreased ipsilateral power is visible
(from 750 to 800 ms, F(1,32) = 4.24, ρ < .05) with the mean of group 1 (M = .07, SD = .06) higher than group 2 (M = .03, SD = .01). Comparable, at the O1/O2 electrode pair an effect is visible (from 750 to 950 ms, F (1,32) > 4.49, ρ < .05) with a mean group 1 (M > .04, SD < .05) higher than group 2
(M = .01, SD < .05). As for the higher θ3 band a reverse effect is found, namely the increase of
ipsilateral power after receiving the MBSR training. At the CP5/CP6 electrode pair (from 850 – 1000
ms, F(1,32) > 4.94, ρ < .05) the mean of group 2 (M = .07, SD = .06) is higher than group 1 (M = .02, SD < .06). This is indicating more ipsilateral power in group 2 compared to group 1, thus an increase
of ipsilateral power in the θ3 band after the MBSR training. The same is visible at the P3/P4 electrode
pair (from 850 to 1000, F(1,32) > 5.66, ρ < .05) with the mean of group 2 higher (M > .06, SD < .07) than group 1 (M < .02, SD < .05), as well as at the P5/P6 electrode pair (from 900 to 1000 ms, F(1,32)
> 6.46, ρ < .05) with the mean of group 2 (M > .06, SD < .08) higher as the mean of group 1(M < .02, SD < .05). Next, in the lower α1 band the same increased ipsilateral power after the MBSR training is
found at parietal- and occipito-parietal sites. At the P5/P6 electrode pair an effect was visible (from
700 to 750 ms, F(1,32) = 4,18, ρ < .05) with the mean of group 2 (M = .08, SD = .08 ) higher than the mean of group 1 (M = .03, SD = .09). Similarly, an increased ipsilateral power after the MBSR
training was revealed at the PO3/PO4 electrode pairs (from 850 to 900 ms and from 950 to 1000 ms,
F(1,32) > 4.41, ρ < .05) with the mean of group 2 (M = .08, SD = .10) higher than the mean of group 1 (M < .02, SD = .07). At last, in the upper α2 band increased ipsilateral power after the MBSR training
is found as well at parietal sites. At the P5/P6 electrode pair (from 650 to 750 ms, F(1,32) > 4.17, ρ < .05) with the mean of group 2 (M > .09, SD < .09) higher than the mean of group 1 (M = .01, SD <
.09). Similarly, at the P7/P8 electrode pair an effect was visible from 700 to 700 ms after cue onset (F
18
Table 3: Between Group Differences for Electrode Pairs When the Significant Criterion was Crossed.
LPS band Time window (ms)
Maxima Mpre Mpost F(32)
θ2 650 - 750 P4 .06 .01 4.34* - 4.86*
750 - 800 P6 .07 .03 4.24*
750 - 950 02 .04 - .05 .01 4.49* - 6.00*
θ3 850 - 1000 CP6 .02 .07 4.94* - 7.63**
850 - 1000 P4 .01 - .02 .06 - .07 5.66* - 7.85** 900 - 1000 P6 .01 - .02 .06 - .07 6.46* - 8.67**
α1 700 - 750 P6 .03 .09 4.18*
850 - 900 PO4 .01 .08 4.41*
950 - 1000 PO4 .02 .08 4.49*
α2 650 - 750 P6 .03 .09 - .11 4.17* - 6.19*
700 - 750 P8 .01 .08 4.43*
* ρ < .05. ** ρ < .01. *** ρ < .005 **** ρ < .001 (two tailed). LPS = the lateralized power spectra.
3.3.3. Overall effects for the within group analyses
The overall LPS results for the within group analyses revealed significant deviation from zero in all
four frequency bands (θ2, θ3, α1 and α2) indicating higher ipsilateral power compared to contralateral
power (see Table 4). For the θ2 band a significant deviation from zero was visible at parietal,
occipito-parietal, occipital and central sites from 350 – 1000 ms after cue onset. The longest, most pronounced
and most significant effect were at the PO7/PO8 electrode pair (from 650 to 1000 ms, t(33) > 3.15, ρ < .004). For the higher θ3 band a significant deviation from zero was visible at central and parito-central
sites from 350 to 600 ms after cue onset. The longest, most pronounced and most significant effect
were at the C3/C4 electrode pair (from 350 to 600 ms, t(33) > 3.90, ρ < .001). For the lower α1 band a significant deviation from zero was visible at parietal, occipito-parietal, occipital and parito-central
sites from 400 to 1000 ms after cue onset. The longest, most pronounced and most significant effects
were at the P7/P8 electrode pair (from 400 to 750 ms, t(33) > 3.07, ρ < .003). For the upper α2 band a significant deviation from zero was visible at parietal, occipito-parietal, occipital, central and
parito-central sites from 350 to 1000 ms after cue onset. The most pronounced and most significant effect
19
Table 4: Overall Within Group Effects for Electrode Pairs When the Significant Criterion was Crossed for at Least Four Successive Time Windows.
Wavelets LPS
Band Windows (ms) Maxima t(33)
θ2 300 - 500 C4 3.03* - 3.99** 650 - 1000 P6 3.13* - 4.53*** 650 - 1000 PO8 3.15* - 5.04*** 700 - 1000 P8 3.01* - 4.37** 700 - 950 P4 3.15* - 3.50* 700 - 950 O2 3.05* - 5.93*** 750 - 1000 PO4 3.29* - 3.50* θ3 350 - 600 C4 3.90* - 6.24***
450 - 600 CP6 3.06* - 3.59* α1 400 - 700 CP6 3.05* - 4.32**
400 - 750 P8 3.07* - 4.94*** 400 - 750 P6 3.20* - 3.94** 400 - 600 PO8 3.35* - 3.98** 400 - 600 02 3.10* - 4.37** 900 - 1000 P4 3.12* - 3.21* α2 350 - 1000 CP6 2.99* - 4.84***
350 - 600 P8 3.85* - 5.69*** 400 - 700 P6 327* - 4.65*** 400 - 600 PO4 3.40* - 4.33** 400 - 600 02 3.27* - 3.60* 650 - 1000 CP4 3.20* - 4.38** 700 - 950 C4 3.01* - 3.56*
Note: Effects are described in terms of ipsi-contralateral differences (therefore P4, PO4 etc.). Positive
outcomes = ipsilateral power higher than the contralateral power; negative outcomes = contralateral
20
21
3.3.4. Within group differences
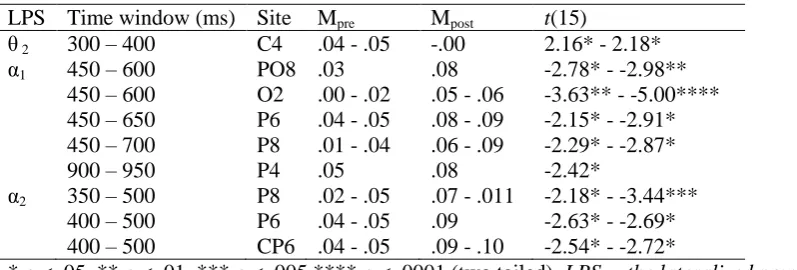
Separate analyses of the group differences showed significant lateral differences in the bands θ2, α1
and α2 (see Table 5). For the θ3 band no significant differences were obtained. For the θ2 band effects
were visible at central sites from 300 to 400 ms after cue onset. At the C3/C4 electrode pair (from 300
to 400 ms, t(15) > 2.16, ρ < .05) the mean of group 1 (M > .04, SD = .05 ) is significantly higher than the mean of group 2 (M = -.00, SD = .06 ). This difference between groups is indicating more
ipsilateral power in group 1 compared to group 2, thus a decrease of ipsilateral power in the θ2 band
after receiving a MBSR training. This is equivalent to the result in the between group analyses, where
a decrease of ipsilateral power in the θ2 band was found. As for the higher θ3 band no effect is found.
Next, in the lower α1 band comparable results as in the between group analyses on the α1 band are
visible. An increased ipsilateral power after the MBSR training is found at parietal-, occipito-parietal
and occipital sites from 450 to 950 ms after cue onset. At the PO7/PO8 electrode pair an effect was
visible (from 450 to 600 ms, t(15) = -2.78, ρ < .05) with the mean of group 2 (M = .08, SD < .09) higher than the mean of group 1 (M = .03, SD < .08). Similar an increased ipsilateral power after the
MBSR training was revealed at the O1/O2 electrode pairs (from 450 to 600 ms, t(15) > -3.63, ρ < .01) with the mean of group 2 (M < .05, SD < .07) higher than the mean of group 1 (M < .02, SD < .06).
Similar effects are found at the electrode pair P5/P6 (from 450 to 650 ms, t(15) > -2.15, ρ < .05) with the mean of group 2 (M < .08, SD < .09 ) higher than the mean of group 1 (M < .05, SD = .07). Also at
the P7/P8 electrode pair this increased ipsilateral power was found (from 450 to 700 ms, t(15) > -2.29,
ρ < .05) with the mean of group 2 (M < .06, SD = .08) higher than the mean of group 1 (M < .04, SD = .08). As well as at the P3/P4 electrode pair (from 900 to 950, t(15) = -2.24, ρ < .05) with the mean of group 2 (M = .08, SD < .10 ) higher than the mean of group 1 (M = .05, SD = .09). At last, in the
upper α2 band increased ipsilateral power after the MBSR training is found as well, at parietal and
parito-central sites from 350 to 500 ms after cue onset. At the P7/P8 electrode pair (from 350 to 500
ms, t(15) > -2.18, ρ < .05) with the mean of group 2 (M > .07, SD < .07 ) higher than the mean of group 1 (M = .05, SD < .09). Similar at the P5/P6 electrode pair an effect was visible from 400 to 500
ms after cue onset (t(15) > -2.63, ρ < .05) with a mean of group 2 (M = .09, SD = .08) higher than the mean of group 1 (M < .05, SD < .10). As well as at the CP5/CP6 electrode pair an effect of ipsilateral
23
Table 5: Within Group Differences for Electrode Pairs When the Significant Criterion was Crossed.
LPS Time window (ms) Site Mpre Mpost t(15)
θ 2 300 – 400 C4 .04 - .05 -.00 2.16* - 2.18* α1 450 – 600 PO8 .03 .08 -2.78* - -2.98**
450 – 600 O2 .00 - .02 .05 - .06 -3.63** - -5.00**** 450 – 650 P6 .04 - .05 .08 - .09 -2.15* - -2.91* 450 – 700 P8 .01 - .04 .06 - .09 -2.29* - -2.87* 900 – 950 P4 .05 .08 -2.42*
α2 350 – 500 P8 .02 - .05 .07 - .011 -2.18* - -3.44*** 400 – 500 P6 .04 - .05 .09 -2.63* - -2.69* 400 – 500 CP6 .04 - .05 .09 - .10 -2.54* - -2.72*
* ρ < .05. ** ρ < .01. *** ρ < .005 **** ρ < .0001 (two tailed). LPS = the lateralized power spectra.
Positive outcomes = power higher prior the training than after the training; negative outcomes = power
higher after the training than before the training.
4. Discussion
Mindfulness seems to have a positive effect on mental- and physical health (Baer, 2003; Bohlmeijer et
al., 2010; Carlson et al., 2007; Miller et al., 1995). However, as was argued in the introduction more
research on the efficiency of mindfulness is needed. As mindfulness is suggested to increase the
efficiency of attentional processes (Bishop et al., 2004; Chiesa et al., 2013) this study focused on the
modulation of attentional processing after an 8-weeks MBSR training. This has been examined with
an endogenous transient Posner task by analyzing and comparing between- and within group results. It
was expected that participating in the MBSR program would result in enhanced efficiency of
endogenous transient attention, and that this would be visible in an increase of ipsilateral α-power and
an similar increase of θ-power.
4.1. Within- and between group results
The subjective effects found showed that the MBSR training had the intended effect. Increased
self-reported mindfulness was present after the training both between groups and within the same group.
This is replicating results of previous studies that are showing enhanced mindfulness on self-reports
(e.g. Cohen-Katz, Wiley. Capuano, Baker & Shapiro, 2005; Shapiro, Brown & Biegel, 2007).
Furthermore, both the between- and within group LPS results provided support for the claim that
mindfulness is enhancing attentional processing. The between group results revealed the expected
increase of ipsilateral power compared to contralateral power in the lower α1 and in the upper α2 band
after the MBSR training. This is comparable with previous reports on attentional processing in which
increased ipsilateral α-power in task-irrelevant locations were revealed (Handel et al., 2011; Kelly et
al., 2009; Rihs et al., 2007; Thut et al., 2006; Van Gerven & Jensen, 2009; Worden et al., 2000). In
this study on the lower α1 band increased ipsilateral power compared to contralateral power was
24
similar results were found from 650 to 750 ms after cue onset on parietal sites. Also the within group
results revealed increased ipsilateral compared to contralateral α-power after the MBSR training.
These effects were visible both in the lower α1 as in the upper α2 band. On the lower α1 band effects
were present from 450 to 700 ms after cue onset at occipito-parietal, occipital and parietal sites, and
from 900 to 950 ms at parietal sites. In the upper α2 band these effects were present from 350 to 500
ms after cue onset at parietal and parito-central sites. These results reflect an increase of α-power for
the participants after they have received the MBSR training, compared to before the training.. Van der
Lubbe and Utzerath (2013; see also Van der Lubbe et al., 2014) have found higher ipsilateral power
compared to contralateral power on the α1 band in comparable sites and time windows, during an
attention demanding task. The effects on the α-bands are assumed by Van der Lubbe et al. (2014) to
reflect the inhibition of task-irrelevant sites and enhanced modulation of attentional processing. This
supports the hypothesis that mindfulness is modulating attentional processing, and this modulation
might take place through more effectively noise inhibition.
On the θ3 bands similar expected effects are found on the θ3 band. After the training increased ipsilateral θ-power compared to contralateral power was found from 850 to 1000 ms after cue onset at
parietal sites and parito-central sites. This effect on the θ3 band was only visible in the between group
analysis, but not in the within group analysis. Similar to the results on the α-bands this may reflect the
enhanced attentional processing due to increased mindfulness. On the θ2 band an unexpected effect of
decreased ipsilateral power compared to contralateral power after participating in the training was
found. In other words: before the training the ipsilateral θ-power on this band was higher compared to
contralateral power, and this effect was no longer present after the training. This effect was found in
both the between- as in the within group analyses before the training. In the between group analysis
this effect was visible from 650 to 800 ms after cue onset at parietal sites, and at posterior sites from
750 to 950 ms after cue onset. In the within group analysis this effect was visible from 300 to 400 ms
after cue onset at central sites. This higher ipsilateral θ2 power before the training may reflect that
participants find it more difficult to focus their attention before the MBSR training than after. Before
the training participants might need more effort to focus their attention on the cued hand. This effort
could be reflected as the higher ipsilateral power compared to contralateral power. At last, the effects
in the within group analyses were slightly more early visible than effects found in the between group
analyses. Both analyses revealed effects on parietal and occipito-parietal sites.
4.2. Top down modulation
In this study it was aimed to provide objective support for the modulation of attentional processing
through the practice of mindfulness. The presented results of increased ipsilateral α1, α2 and θ3 power
are suggested to reflect the inhibition of task-irrelevant sides. This may give more insight into how
mindfulness training in sensory attention to the breath and body sensations used in the MBSR program
25
such as the breath, seems to enhance the ability to suppress irrelevant sensory inputs in an endogenous
manner. Self-regulation of the focus of attention seems to be enhanced as participants are better to
suppress irrelevant input and attend to relevant input. This idea is also suggested by Kerr and his
colleagues (2013). These authors based on findings of enhanced α-power in previous studies (Kerr et
al., 2011b; Kerr, Josyula & Littenberg, 2011a). They argue that mindfulness results in top-down
modulation of α-power which facilitates enhanced sensitive filtering of sensory information. More specifically they suggest that: “Learning to control alpha oscillations in the primary somatosensory
cortex may be a key gateway mechanism for learning to use thalamocortical alpha regulation to
suppress irrelevant sensory inputs across sensory neocortex in an internally directed, top down manner, for forms of regulation such as selective attention and working memory” (Kerr et al., 2013, p
12). This study provides of even more thorough evidence for the modulation of attentional processing visible in changes in the α-power. The effects of increased ipsilateral α-power is strong support for the
idea that mindfulness results in better regulation of suppressing irrelevant information, thereby
enhancing the efficacy of the focus of attention.
4.3. Supramodal attention control
Previous results of changes in the primary somatosensory cortex (Kerr et al., 2011a; Kerr et al., 2011b;
Kerr et al., 2013) have been partly replicated in this study. In this study some effects have been
revealed at central and parito-central sites, which can be assumed to reflect the endogenous attending
to a part of the body. However, it was argued in the introduction that supramodal attention control
would result in more than one modality to be involved. In this study most of the effects have been
revealed on the occipito-parietal cortex, which is strongly related to visuospatial attentional processing
(Foxe et al., 1998; Van der Lubbe & Utzerath, 2013; Van der Lubbe et al., 2014). These results can be
understood as supramodal attention control, in which a spatial presentation related to the visual
modality is involved in processing information of other modalities. Previous results of supramodal
attention control found in attentional processing supports this idea (Eimer et al., 2002; Seiss et al.,
2007)
Although in this study ERLs were not examined, these results may be similar to findings of
studies comparing the LPS and ERL effects in a similar 1-s cue target interval (see Van der Lubbe &
Utzerath, 2013; and Van der Lubbe et al., 2014). In these studies comparable ipsilateral α-power have
been related to the ERL components: the late directing attention positivity (LDAP) and the biasing
related positivity (BRP). These components are thought to reflect the final stage in which modulation
along the ventral processing stream takes place (Hopf & Mangun, 2000; Van der Lubbe & Utzerath,
2013). Furthermore, the LDAP have been visible in auditory spatial attention tasks as well and is
suggested to be related to cross-modal interaction in attentional processes (Seiss et al, 2007).
Therefore, the results of this study seem to indicate that the modulation of attentional processing is
26
4.4. Critical notes
There are several points that need to be addressed on further understanding the significance, but also
the limitations of the results of this study. First, it is possible that some of the effects in the between
group analyses are missed because of the choice in criteria. It was chosen to further analyze only those
effects that already revealed significant deviation from zero on the overall results (indicating lateral
differences). In the overall within group analyses the means before and after the training were
analyzed separately. This means that any effects of lateral differences before the training and after the
training were further analyzed. However, in the overall between group results the means before and
after the training were averaged. As participants before and after the training were different groups,
this way effects of both groups were taken into account together. It is possible that by averaging over
the groups, some effects that were only present in one of the groups have been missed. Yet, the
between group analyses revealed more effects compared to the within group analyses. Also most of
the effects that are found on both analysis are comparable. Therefore it is assumed that the main
effects are revealed. However, it cannot be ruled out that some effects might have been missed.
Second, it could be argued that the effects as described above are reflecting the expectancy of pain,
as nociceptive stimuli have been given right after the cue-target interval. Previous research have given
many support that nociceptive cortical areas are more active not only during the experience of pain,
but also during the expectancy of pain stimuli (e.g. see Petrovic, Petersson, Ghatan, Stone-Elander &
Ingvar, 2000). It may be assumed that in this study the expectancy of pain is also influencing the
neural activity. However, as the cue has no predictable value for the location in which the nociceptive
stimuli is given, this activity would not be visible in the hemispherical differences. Therefore, the
lateralization results as been presented in this paper are not related to the expectancy of pain, but to the
more specific lateral differences in attentional processes as measured with the LPS. As many results of
the between- and within analyses are quite similar, it seems like the expectancy of nociceptive stimuli
is of no influence on the results. It is expected that replicating this study without the nociceptive
stimuli would reveal comparable results.
Finally, it could be argued that the results of this study are not the specific effects of mindfulness.
In this study only a waitlist control group has been used, but not a no-treatment control group such as a
relaxation training. Therefore it is possible that the results of this study are not specific for
mindfulness. Previous studies have revealed that some of the effects of mindfulness are found in
no-treatment control groups as well. A randomized control trial using subjective outcomes on mindfulness
(self-reports i.e. on daily emotions) compared both a mindfulness- and a relaxation group with a
control group (Jain et al., 2007). Both in the mindfulness- and in the relaxation group increased
positive mood stated and decrease in distress have been found, compared to a control group. Specific
for the mindfulness group was a decrease in distractive and ruminative thoughts and behaviors. The
authors suggest that the mechanism of reducing distractive and ruminative thoughts and behavior may
27
physical exercise of a wait-list control group (McMillan, Robertson, Brock & Chorlton, 2002). In this
research with 145 participants with traumatic brain injuries no significant differences were found
between the two active groups. These results are replicated in another research testing mindfulness as
an active ingredient while using an active control group, who perceived a Health Enhancement
Program (HEP; MacCoon et al., 2012). This active control matched with MBSR in non-specific
factors such as structure, but without the training of mindfulness. This research found MBSR, but not HEP, to result in a decrease in the participant’s pain rating, suggesting a specific effect for
mindfulness in the regulation of pain. Furthermore, self-reports on mental- and physical effects
revealed a reduction of symptoms for both MBSR as HEP, therefore no specific effect of mindfulness
is shown. Surprisingly, mental distress and depression decreased with HEP, but increased with MBSR.
These three studies (Jain et al., 2007; McMillan et al., 2002; MacCoon et al., 2012) replicate previous
findings on the positive influence on mental- and physical health of mindfulness, but shows that some
of these effects are found in an active control group as well (or even more). This indicates that not all
effects as revealed in self-reports are specific for mindfulness. Similarly, this might be relevant for
objective support of the modulation in brain activity through the practice of mindfulness. In this study
it therefore cannot be ruled out that the objective effects found are not specific for mindfulness.
Further research on objective support for the modulation of attentional processing through the practice
of mindfulness is needed that uses both a waiting-list control group and an active control group. As the
HEP is specifically designed to control for non-specific factors of MBSR this program could be
recommended for a follow-up study. Details on this program and additional recommendations can be
found in MacCoon and colleagues (2012).
4.5. Conclusion
The results reveal increased ipsilateral power compared to contralateral power in the lower α1, α2 and θ3 bands after participating in an 8-weeks MBSR training. This is strong support that practicing
mindfulness improves attentional processing. Specifically, the efficiency of endogenous spatial
attention. Together with results of previous studies, these effects found in this study are suggested to
reflect the inhibition of noise in task irrelevant locations. Furthermore, this study gives support for the
involvement of supramodal attention control and improved top-down modulation.
Practicing mindfulness seems to improve the ability to focus one’s attention. This enhanced
attentional processing is likely related to the mental- and physical health that is improved through
28
References
Annet, M. (1970). A classification of hand preference by association analysis. British Journal of Psychology, 61, 303-321.
Baer, R.A. (2003). Mindfulness training as clinical intervention: a conceptual and empirical review.
American Psychological Association, 10, 2, 125 – 43.
Berger, H. (1929). Über das elektrenkephalogramm des menschen. European Archives of Psychiatry and Clinical Neuroscience, 87, 1, 527-570.
Bishop, S. R., Lau, M., Shapiro, S., Carlson, L., Anderson, N. D., Carmody, J., ... & Devins, G.
(2004). Mindfulness: A proposed operational definition. Clinical psychology: Science and practice, 11, 3, 230-241.
Bohlmeijer, E., Prenger, R., Taal, E., & Cuijpers, P. (2010). The effects of mindfulness-based stress
reduction therapy on mental health of adults with a chronic medical disease: A meta- analysis.
Journal of Psychosomatic Research, 68, 539–544.
Bohlmeijer, E., ten Klooster, P.M., Fledderus, M., Veehof, M.M., & Baer, R. (2011). Psychometric
properties of the Five Facet Mindfulness Questionnaire in depressed adults and development of a
short form. Assessment, 8, 308-20.
Buzsáki, G. (2002). Theta oscillations in the hippocampus. Neuron, 33, 3, 325-340.
Buzsáki, G. (2006). Rhythms of the brain. New York: Oxford University Press.
Cahn, B. R., & Polich, J. (2006). Meditation states and traits: EEG, ERP, and neuroimaging
studies. Psychological bulletin, 132, 2, 180.
Carlson, L.E., Speca, M., Patel, K.D., & Faris, P. (2007) One year pre–post intervention follow-up of
psychological, immune, endocrine and blood pressure outcomes of mindfulness-based stress
reduction (MBSR) in breast and prostate cancer outpatients. Brain, Behavior, and Immunity, 21,
1038–1049.
Chiesa, A., & Serretti, A. (2010). A systematic review of neurobiological and clinical features of
29
Chiesa, A., Serretti, A., & Jakobsen, J. C. (2013). Mindfulness: Top–down or bottom–up emotion
regulation strategy? Clinical psychology review, 33, 1, 82-96.
Cohen-Katz, J., Wiley. S.D., Capuano, T., Baker, D.M., & Shapiro, S. (2005). The effects of
mindfulness-based stress reduction on nurse stress and burnout: a qualitative and quantitative
study. Holistic Nursing Practice, 19, 26–35.
De Kleine, E., & Van der Lubbe, R. H. (2011). Decreased load on general motor preparation and
visual-working memory while preparing familiar as compared to unfamiliar movement
sequences. Brain and cognition, 75, 2, 126-134.
Eimer, M., & Driver, J. (2000). An event-related brain potential study of cross-modal links in spatial
attention between vision and touch. Psychophysiology, 37, 05, 697-705.
Eimer, M., Van Velzen, J., & Driver, J. (2002). Cross-modal interactions between audition, touch, and
vision in endogenous spatial attention: ERP evidence on preparatory states and sensory
modulations. Journal of Cognitive Neuroscience, 14, 2, 254-271.
Eimer, M., van Velzen, J., Forster, B., & Driver, J. (2003). Shifts of attention in light and in darkness:
an ERP study of supramodal attentional control and crossmodal links in spatial attention. Cognitive Brain Research, 15, 3, 308-323.
Foxe, J. J., Simpson, G. V., & Ahlfors, S. P. (1998). Parieto-occipital ̴10 Hz activity reflects
anticipatory state of visual attention mechanisms. NeuroReport, 9, 17, 3929-3933.
Händel, B. F., Haarmeier, T., & Jensen, O. (2011). Alpha oscillations correlate with the successful
inhibition of unattended stimuli. Journal of cognitive neuroscience, 23, 9, 2494-2502.
Hopf, J. M., & Mangun, G. R. (2000). Shifting visual attention in space: an electrophysiological
analysis using high spatial resolution mapping. Clinical neurophysiology, 111, 7, 1241-1257.
Hulsbergen M (2009) Mindfulness, de aandachtsvolle therapeut. Amsterdam: Boom.
Jain, S., Shapiro, S.L., Swanick, S., Roesch, S.C., Mills, P.J., Bell, I., & Schwartz, G.E.R. (2007). A
30
distress, positive states of mind, rumination, and distraction. Annals of Behavioral Medicine, 33, 1, 11-21.
Kabat-Zinn, J. (1982). An outpatient program in behavioral medicine for chronic pain patients based
on the practice of mindfulness mediation: Theoretical Considerations and preliminary results.
General Hospital Psychiatry, 4, 33–47.
Kabat-Zinn, J. (1994). Wherever you go, there you are: Mindfulness meditation in everyday life.
New York: Hyperion.
Kelly, S. P., Gomez‐Ramirez, M., & Foxe, J. J. (2009). The strength of anticipatory spatial biasing
predicts target discrimination at attended locations: a high‐density EEG study. European Journal of Neuroscience, 30, 11, 2224-2234.
Kerr, C. E., Josyula, K., & Littenberg, R. (2011a). Developing an observing attitude: an analysis of
meditation diaries in an MBSR clinical trial. Clinical psychology & psychotherapy, 18, 1, 80-93.
Kerr, C. E., Jones, S. R., Wan, Q., Pritchett, D. L., Wasserman, R. H., Wexler, A., ... & Moore, C. I.
(2011b). Effects of mindfulness meditation training on anticipatory alpha modulation in
primary somatosensory cortex. Brain research bulletin, 85, 3, 96-103.
Kerr, C. E., Sacchet, M. D., Lazar, S. W., Moore, C. I., & Jones, S. R. (2013). Mindfulness starts with
the body: somatosensory attention and top-down modulation of cortical alpha rhythms in
mindfulness meditation. Frontiers in human neuroscience, 7.
MacCoon, D. G., Imel, Z. E., Rosenkranz, M. A., Sheftel, J. G., Weng, H. Y., Sullivan, J. C., ... &
Lutz, A. (2012). The validation of an active control intervention for Mindfulness Based Stress
Reduction (MBSR). Behaviour research and therapy, 50, 1, 3-12.
McMillan, T., Robertson, I. H., Brock, D., & Chorlton, L. (2002). Brief mindfulness training for
attentional problems after traumatic brain injury: A randomised control treatment
trial. Neuropsychological rehabilitation, 12, 2, 117-125.
Miller J.J., Fletcher, K., Kabat-Zinn, J. (1995). Three-year follow-up and clinical implications of a
mindfulness meditation-based stress reduction intervention in the treatment of anxiety
31
Oostenveld, R., Stegeman, D. F., Praamstra, P., & van Oosterom, A. (2003). Brain symmetry and
topographic analysis of lateralized event-related potentials. Clinical neurophysiology, 114, 7, 1194-1202.
Petrovic, P., Petersson, K. M., Ghatan, P. H., Stone-Elander, S., & Ingvar, M. (2000). Pain-related
cerebral activation is altered by a distracting cognitive task. Pain, 85, 1, 19-30
Pfurtscheller, G., Stancak Jr, A., & Neuper, C. (1996). Event-related synchronization (ERS) in the
alpha band - an electrophysiological correlate of cortical idling: a review. International Journal of Psychophysiology, 24, 1, 39-46.
Polich, J. (2007). Updating P300: an integrative theory of P3a and P3b. Clinical neurophysiology, 118, 10, 2128-2148.
Posner, M. I. (1980). Orienting of attention. Quarterly journal of experimental psychology, 32, 1, 3-25.
Posner, M. I., & Petersen, S. E. (1989). The attention system of the human brain (No. TR-89-1). Washington University, department of neurology.
Posner, M. I., & Rothbart, M. K. (1992). Attentional mechanisms and conscious experience.
Rihs, T. A., Michel, C. M., & Thut, G. (2007). Mechanisms of selective inhibition in visual spatial attention are indexed by α‐band EEG synchronization. European Journal of Neuroscience, 25, 2, 603-610.
Seiss, E., Gherri, E., Eardley, A. F., & Eimer, M. (2007). Do ERP components triggered during
attentional orienting represent supramodal attentional control? Psychophysiology, 44, 6, 987- 990.
Shapiro, S. L., Carlson, L. E., Astin, J. A., & Freedman, B. (2006). Mechanisms of
mindfulness. Journal of clinical psychology, 62, 3, 373-386.
Shapiro, S. L., Brown, K. W., & Biegel, G. M. (2007). Teaching self-care to caregivers: effects of