The Influence of Team-level Cognitive Styles on
Internal and External Collaboration in the
Context of New Product Development Projects
Author: Auke van Rijkom
University of Twente P.O. Box 217, 7500AE Enschede
The Netherlands
ABSTRACT
Prior studies already examined the relationships between cognitive styles on the
individual level. This study adds to the team-level innovation literature, by examining
the effect of team-level cognitive style on internal and external collaboration in the
context of new product development projects. The goal of this research is to closely
examine the relationship between team-level cognitive style and internal and external
relationship by using the cognitive style index developed by Allinson and Hayes.
Based on the survey data of 63 NPD teams, gathered in one Turkish and four Dutch
organizations in high technology driven industries, hypotheses on the relationship
between internal and external collaboration and team-level cognitive style are tested.
Results of hierarchical linear regression analysis and independent samples t-tests
suggest that team’s level of analytical thinking styles might negatively influence
external collaboration. The contribution of this research to existing scientific literature
lies in the fact that next to the variables cross-functionality, team size and company
experience, team-level cognitive style significantly influences external collaboration.
Supervisors:
First supervisor: Dr. Matthias de Visser
Second supervisor: Dr. Michel Ehrenhard
Keywords
cognitive styles, internal collaboration, external collaboration, NPD teams, innovation, communication, analytical, intuitive
Permission to make digital or hard copies of all or part of this work for personal or classroom use is granted without fee provided that copies are not made or distributed for profit or commercial advantage and that copies bear this notice and the full citation on the first page. To copy otherwise, or republish, to post on servers or to redistribute to lists, requires prior specific permission and/or a fee.
6th IBA Bachelor Thesis Conference, November 5th, 2015, Enschede, The Netherlands.
INTRODUCTION
The importance of innovation has been long since established, the continuous output of new products binds consumers to the organization and determines innovation to be fundamental for long term survival of organizations1. As product life cycle time shortens and competition increases through globalization, innovation has become the cornerstone of organizational success. The importance of innovation to organizations spurred scholars and social scientists to conduct research on this subject. Especially the last two decades the number of studies surged2. The research on innovation performance predictors distinguishes between organizational, individual and team-level predictors3. Research on organizational and individual level is well documented. Research on team-level respectively, is only just gaining momentum4.
Within the team-level studies the vast majority focuses on team members’ demographic characteristics and functional backgrounds5. Team longevity and tenure have proven to impact NPD performance, primarily through the increased or decreased intensity of communication of the NPD team6. The research on cognitive styles in the context of NPD teams however is largely lacking. Interestingly, evidence provided by several scholars indicates that deep psychological variables are essential for determining the performance of teams over longer periods of time7. The importance of cognitive styles in organizations was established by Hayes and Allinson. In their research several dimensions of cognitive styles were analyzed and managerial implications are discussed8. Cognitive style is defined as ‘the way a person acquires, stores, and uses knowledge’9
. Additionally the study of Keller and Holland showed that internal communication is primarily predicted by personality variables10. This study will combine the insights of NPD research, cognitive styles and collaboration and focuses on the impact of cognitive styles of teams on internal and external collaboration.
Collaboration is said to enable the sharing of ideas and vision which are vital for successful NPD projects. Especially in high uncertainty projects, typically radical NPD projects, the interchange of experience is valuable to generate new ideas11. Through the meta-analysis of Hulzinger et al it was shown that internal and external collaboration is generalizable and significantly related with innovation performance. This means these variables have a proven effect on NPD performance. The contribution of internal and external collaboration to NPD project performance lies in the fact that team members are exposed to more and diverse knowledge and views12. These broaden the options of the NPD team to come up with a more creative and suitable solution to their innovation endeavors. Following the theory of Perry-smith and Shally, weak ties (communication channels from outside the project group) generate the most fruitful ideas. External collaboration is
1
(Ancona & Caldwell, 1986)
2 (Hülsheger, Anderson, & Salgado, 2009) 3
(Hülsheger et al., 2009)
4 (Armstrong, Cools, & Sadler-Smith, 2012) 5
(de Visser, Faems, Visscher, & de Weerd-Nederhof, 2014) 6
(Katz, 1982) 7
(Harrison et al., 2015) 8 (Hayes & Allinson, 1994) 9
(Hayes & Allinson, 1994) 10
(Keller & Holland, 1978) 11
(Ven, 1986) 12
(Hülsheger et al., 2009)
therefore rich in diverse information which will contribute to the success of NPD projects13.
As internal and external collaboration is such an importance to NPD project performance, these variables will form the subject of this research. The goal of this study is to examine how the cognitive styles of NPD teams influence internal and external collaboration. Several scholars have identified the influence of cognitive styles on thinking styles of individuals. The distinctive preference of a person’s thinking style influence the way information is gathered and processed14. This indicates that cognitive styles could influence collaboration efforts of individuals.
In order to test the hypotheses data was collected from team members who contributed to NPD projects. The final data set contained 63 NPD projects from one Turkish and four Dutch manufacturing companies. The results of this research shows that teams with an analytical preference might score less on the external collaboration scale.
These findings contribute to existing literature as research on team-level cognitive styles within the context of NPD is limited. The relationship between collaboration and team-level cognitive style has in fact, never been examined. The results suggest that cognitive styles influence communication and collaboration and thus NPD performance. The findings also have a managerial implication. By paying close attention to cognitive styles the external collaboration intensity can be predicted. The project context and its collaboration needs can therefore be used to determine optimum NPD team composition to increase project performance.
1.
THEORETICAL FRAMEWORK
1.1
Cognitive Style
Although many scholars have defined different concepts of cognitive styles15, some consensus has been reached that cognitive styles can be divided in two distinct ways of processing information16. This study follows the distinction made by Allinson and Hayes, of intuitive thinking style and analytical thinking style17. It is said that the functioning of these styles are important to understand the reciprocity of information processing of individuals. Furthermore intuitive style thinkers are said to benefit from appeals to emotion, personal experience and concrete examples. Individuals who are prone to primarily use the analytical style thinking respond better to facts and logical arguments18.
As people have a tendency to use one or the other thinking style predominantly, they do however influence behavior19. Building further on these results, consecutive research showed that intuitive thinking is characterized by being, fast, automatic, unconscious and associative 20 . Analytical thinking is characterized by being, slow, conscious, rules based and controlled21. The description of Allison and Hayes suggests that intuitive thinking occurs immediately and is based on feelings22. Analytical thinking is based on logical reasoning and focus on detail. Furthermore they describe intuitivists as
13
(Perry-Smith & Shalley, 2003) 14 (Allinson & Hayes, 1996) 15
(Hayes & Allinson, 1994) 16
(de Visser et al., 2014) 17
(Allinson & Hayes, 1996) 18 (Epstein et al., 1996) 19
(Allinson & Hayes, 1996) 20
(Evans, 2008) 21
(Evans, 2008) 22
people desiring open ended questions and rely on random methods of exploring problems and desire ideas requiring a more general assessment. Analysists are more compliant, prefer structured approaches and are most in their element when presented with ideas that require a step by step analysis23. These preferences influence the way individual’s process information and which information sources they prefer. An individual’s innovation performance is determined by the fit between task environment and the intuitive or analytic thinking style24. As said relatively new is analysis of cognitive styles on team-level. The limited studies that are present show that the dominant intuitive or analytical thinking style of a new member of a team either strengthens or weakens the pooled intuitive or analytical thinking style preference of the whole team25.
1.2
Communication and Collaboration
The importance of communication and collaboration in the NPD teams is commonly known26. Several studies have proven the collaboration needs of teams in different types of NPD projects27. Furthermore, studies have proven the positive effect of psychological safety and demographic diversity on communication and innovation performance28, 29. The impacts of cognitive styles on communication and collaboration is however relatively unknown. In fact, the relationship between team-level cognitive style and collaboration has not been the subject of any research conducted. This is surprising, as many studies have proven the importance of cognitive style in the context of innovation30.
What is known in the context of cognitive styles and communication and collaboration, when we take the analogy of T-shaped skills is that, intuitive thinkers are more likely to have a broad set of interests, large contact base and a diverse set of personal and professional experiences31.
When we examine the adaptors as established by Kirton et al, we find that adaptors prefer solutions that fit their current framework. Their focus on the current framework however inhibits the creation of innovative ideas32. The way they solve problems is by taking existing sources and methodologies. By taking consistently the common route the solutions generated are often far from novel33.
Innovators take on a vastly different approach to solve problems. By trying to reframe the problem instead of finding a fitting solution, they generally come up with novel solutions34. By consistently trying to reframe problems, innovators tend to divert from the common chosen route of solving problems35. Interestingly research has shown that the innovative performance of innovators peaks in closed networked conditions, as their strengths offset the weakness of the conditions. For adaptors this relationship is mirrored. The individual innovation performance of adaptors is boosted in open networks. This relationship can be explained by the fact
23
(Allinson & Hayes, 1996) 24
(Payne, Lane, & Jabri, 1990) 25 (de Visser et al., 2014) 26
(Barczak, Griffin, & Kahn, 2009) 27 (Clark & Wheelwright, 1993) 28
(Keller & Holland, 1978) 29
(Edmonson, 1990) 30
(Armstrong et al., 2012) 31 (Keller & Holland, 1978) 32
(Kirton & De Ciantis, 1986) 33
(Carnabuci & Oszegi, 2015) 34
(Kirton & De Ciantis, 1986) 35
(Carnabuci & Oszegi, 2015)
that intuitive thinkers can mobilize closed networks more efficiently to see their ideas make it to implementation. Adaptors can structure open networks and the various information streams to align them with current organizational needs36.
2.
HYPOTHESES
Individuals in teams have a hard time to pay attention to new ideas. This is a psychological limitation of human beings37. In fact, the more a person is constraint by routine, isolated and specialized tasks, the harder it is for this person to recognize the value of new ideas or identify the need to change38. In light of cognitive styles, team members prone to have a preference for analytical thinking fit this description nicely. As NPD projects are tackled the same way by teams with an analytical preference, team members know the information needs from each other. Collaboration is streamlined and highly efficient. High intensity collaboration is thus not needed. As these teams follow common structures, high intensity external collaboration is not likely. Therefore it is hypothesized that teams with a preference for analytical thinking will collaborate less internally and externally as the barrier for recognizing, the need for and value of, new information is high. Furthermore it is hypothesized the reliance on existing methods of analytical teams lessens the need collaboration and communication. For intuitive thinkers the communication and collaboration strategy is somewhat different. They lack attention to existing rules and boundaries. By processing multiple domains of thoughts simultaneously, intuitive thinkers come up with more novel ideas and information39. NPD teams with a preference for intuitive thinking style like to reframe each project. In order to do so they collect different views from a wide variety of sources. This means collaborating internally and externally with a high intensity. The fact that these intuitive preferenced NPD teams like to bend existing rules and cross boundaries forms the basis of the hypothesis that NPD teams who are more prone to intuitive thinking, collaborate more internally as well as externally. As information is gathered from alternative sources, it is hypothesized that some internal collaboration is needed to funnel the new solutions through the organizational context in order to successfully implement the new solutions. Based on these insights, this study hypothesizes;
Hypothesis 1a: The preference of analytical information processing of NPD teams negatively influences the intensity of internal collaboration.
Hypothesis 1b: The preference of analytical information processing of NPD teams negatively influences the intensity of external collaboration.
As this article follows the principle of cognitive style as a scale on one continuum, the evidence of these hypotheses will also prove the hypotheses of the intuitive information processing teams.
Hypothesis 2a: The preference of intuitive processing of NPD teams positively influences the intensity of internal collaboration.
Hypothesis 2b: The preference of intuitive processing of NPD teams positively influences the intensity of external collaboration.
36
(Carnabuci & Oszegi, 2015) 37
(Ven, 1986) 38
(Ven, 1986) 39
3.
METHODOLOGY
3.1
Sample
In order to test these hypotheses, data on cognitive style and communication and collaboration intensity is needed. The data used in this study was collected for an earlier study40 and was made available by the authors. The dataset contained organizations which met the following criteria; a) they had a broad portfolio of NPD projects in their R&D department, b) they were willing and able to provide access to their project documentation and c), the companies were in a technology intensive manufacturing sector. Five companies decided to participate in the study from several industries, rubber ties, sensors and controls, membrane technologies, plastic pipes and textile41. From these five companies, 135 NPD projects were identified that were initiated in the past five years.
These 135 NPD projects were further examined to identify the teams working on these projects and individuals were identified who had contributed at least 100 working hours to the NPD projects42. Further verification was needed to make sure these individuals were part of the team and who had made a significant contribution to the project. The NPD team was defined as ‘group of organizational members that was responsible for developing the product or product component in a particular project’43.
After the identification of individuals and teams, surveys were distributed to measure cognitive styles and project characteristics.
261 questionnaires of the 352 were returned44. The procedure of Post (2012) was used to add teams of which at least two thirds of the members returned the questionnaire45. This led to a final sample of 63 project teams. The average team size was determined to be 3.19 individuals. The average individual contributed to 3.095 NPD projects.
The number of individuals in a team differed between eight and two. The teams of two individuals accounted for 39,68% of the sample, the remaining 60,32% of the teams had more than two individuals contributing to the NPD project. In the sample the average age was 41 years and 97% of the individuals were male. The R&D department was with 79% the main department where individuals of the team resided. The other departments as manufacturing and marketing accounted for the remaining 21%.
3.2
Dependent Variable; Internal and
External Collaboration
The dependent variable is the intensity of collaboration internally and externally. For internal collaboration, respondents were asked if internal collaboration had taken place within the company. If so, they were asked to rate the intensity of the collaboration on a five point scale where, a (1) indicated a very intensive collaboration and a (5) indicated the collaboration to be not intensive. External collaboration was indicated through the question if such collaboration had taken place with other organizations in the project framework. If so, the respondents were asked to rate the external collaboration on a five point scale, (1) indicating an intensive collaboration and (5) the collaboration was determined not to be intensive.
40
(de Visser et al., 2014) 41 (de Visser et al., 2014) 42
(de Visser et al., 2014) 43
(de Visser et al., 2014, p. 1171) 44
(de Visser et al., 2014) 45
(Post, 2012)
To cope with the differences within the teams ratings of internal collaboration, internal collaboration was then further defined as the mean of the ratings individuals gave the collaboration in their team. This smoothens out extreme values and increases reliability. This variable was called average internal collaboration.
The dependent variable of external collaboration on team-level was determined as the maximum value which individuals rated their external collaboration intensity. This follows the theory of gatekeepers where certain individuals relay information acquired from external contacts within their own social circle, to the team46. This means not all individuals of a team will collaborate as intensive with external partners as other individuals in the team. Individuals who do collaborate with external partners will make sure information will flow from and to the team. These individuals provide thus a key role and can more accurately determine the level of collaboration with external partners47. This variable was called gatekeeper external collaboration.
In order to examine the effects of average external collaboration the variable average external collaboration was created. This variable does not follow the gatekeeper theory and is created by taking the mean of the external collaboration scores of the individuals that comprised a team. This variable serves as a check to see if the same conclusions can be drawn if individuals do not follow the gatekeeper theory or when gatekeepers are solely intuitive individuals.
3.3
Independent Variable; Team-level
Cognitive Style
To determine intuitive and analytical information processing in teams, the Cognitive Style Index (CSI), as constructed by Allinson and Hayes48, was used. This questionnaire is composed of 38 items which can be scored from zero to two and contains a unitary scale where intuitive thinking and analytical thinking are on opposing ends of the continuum49. The higher the score, the more analytical a person is. To aggregate this measure to team-level the mean was taken of the individual scores within a team. This variable was called team-level cognitive style. The Cronbach’s alpha of this measure for cognitive style was determined at 0.828. This is well above the threshold of 0.7.
3.4
Control Variables
The control variables in this research are primarily used to accurately determine the individual effects of the predictor variables. If these control variables were left out, a significant result could be found caused by a third spurious variable. This variable influences the dependent and independent variable. Furthermore the control variables serve as a check to determine if relationship between the independent variables and dependent variable is linear. Meaning that in hierarchical linear regression analysis, these independent control variables in a model should significantly predict the dependent variable and provide a significant contribution to the model. Furthermore adding control variables limits the omitted variables bias, where important predictor variables are absent from the model.
46
(Ancona & Caldwell, 1986) 47
(Ancona & Caldwell, 1986) 48
(Allinson & Hayes, 1996) 49
3.4.1
Team Size
Team size has shown to be a significant predictor of NPD performance50, quite possibly through increased communication and coordination. Therefore the variable team size should significantly contribute to the linear regression model. Team size was measured by counting the number of individuals within a team that contributed at least 100 hours to the NPD project.
3.4.2
Cross-Functionality
Cross-functionality has shown to foster the exchange of knowledge and views which positively influences the creation of innovative ideas51. The variable of cross-functionality was measured by asking respondents if collaboration with other departments within the organization had taken place.
3.4.3
Average Company Experience
Katz showed that long tenured teams communicate less with inter and intra organizational sources52. This is not desired as this inhibits the influence of new insights and increases group think. Innovation however desires creative problem solving which requires various viewpoints. To measure company experience the variable average company experience was created. This is the mean of the number of years of company tenure of each individual in NPD teams.
3.5
Statistical Tests
3.5.1
Independent Samples t-test
In order to test the hypotheses stated some statistical testing needs to be done. First of all independent t-tests can measure if the mean collaboration internally and externally of a NPD team differs between teams which score under or above 38 on the team-level cognitive style index score. As the maximum score of cognitive style index is 76 and is labeled analytical. The centre is our zero point. So below a score of 38 teams can be labeled as teams that have a preference for intuitive information processing, above a score of 38 teams can be labeled as NPD teams that have a thinking style which is analytically preferenced. An independent samples t-test is used as the two groups are independent. Additionally we are not dealing with a retest situation which calls for a paired samples t-test. We should expect that the intuitive labeled teams should score significantly higher on the variables average internal collaboration, gatekeeper external collaboration and average external collaboration.
3.5.2
Hierarchical Linear Regression Analysis
To further analyze the direction and impact of the team-level cognitive style variable on the dependent variable, hierarchical linear regression analysis was executed. The hierarchical linear regression analysis allows for more easy comparison between the two models and examine if the test variable team-level cognitive style contributes to the model while controlling for the other variables. The first model comprises the independent control variables, the second model consists of the control variables and the test variable team-level cognitive style. There are some assumptions with linear regression that need to be fulfilled. First of all is linearity, the relation between dependent and independent variables should be linear. Second normality, the dependent variable should be normally distributed. The last assumption is multicollinearity. The independent variables should not significantly correlate. When
50
(Hülsheger et al., 2009) 51
(Perry-Smith & Shalley, 2003) 52
(Hülsheger et al., 2009)
they do, the explained variance might be falsely inflated as shared effects are individually added.
4.
RESULTS
4.1
Relation Team-level Cognitive Style and
Average Internal Collaboration
4.1.1
Independent Samples t-test
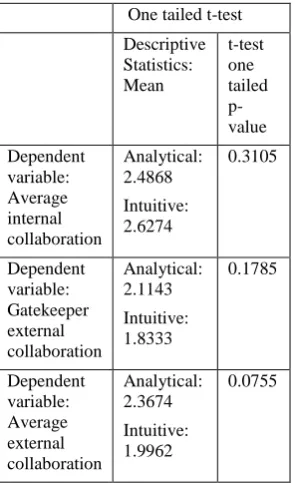
First of all the independent samples t-test was performed to examine if the average internal collaboration score is significantly higher with intuitive preferenced NPD teams. As seen in Error! Reference source not found., intuitive information processing preference teams score lower on average internal collaboration than teams with a preference for analytical information preference. These findings are surprising and in conflict with our hypothesis H1a.
[image:5.595.306.454.335.577.2]However as depicted in Table 2Table 1 Table 2: Hierarchical Linear Regression Analysisthis relation is far from significant. The one tailed significance is determined at 0.3105. This is far above the 5% cutoff point. Based on these conditions we can say there is no significant relationship between mean team score on CSI and average internal collaboration.
Table 1: Independent Samples t-test
One tailed t-test
Descriptive Statistics: Mean t-test one tailed p-value Dependent variable: Average internal collaboration Analytical: 2.4868 Intuitive: 2.6274 0.3105 Dependent variable: Gatekeeper external collaboration Analytical: 2.1143 Intuitive: 1.8333 0.1785 Dependent variable: Average external collaboration Analytical: 2.3674 Intuitive: 1.9962 0.0755
4.1.2
Hierarchical Linear Regression Analysis
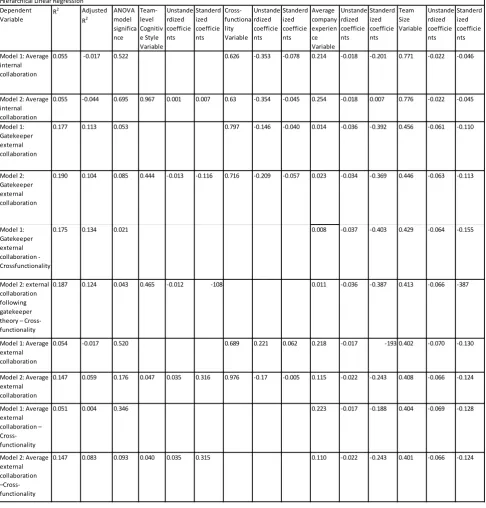
Linear regression can give a more comprehensive view of the model and provide a deeper understanding. Assumptions are tested and can be found in appendix 1. Some influential cases were found which surpassed the Cooks distance. After deleting those outliers a hierarchical linear regression analysis was preformed. When in the model summary the adjusted R square is examined in Table 2, as there are multiple independent variables. It can be seen that both models have a negative adjusted R square. This means the adjusted R square is effectively zero. Indicating that relationship between these variables is not linear.
When we look at the coefficients table in Table 2 we can also see that the predictor variable team-level cognitive style does not significantly contributes to the model. When we look at the unstanderdized coefficients we can see that the variable team-level cognitive style only accounts for 0.001 of the dependent variable. Indicating its influence is very limited. Also when the standardized coefficients are examined we see that the variable team-level cognitive style is the least important independent variable.
4.2
Relationship Team-level Cognitive Style
and External Collaboration
4.2.1
Independent Samples t-test
In order to examine if intuitive teams collaborate externally significantly higher than analytical teams, an independent samples t-test is needed. As it can be seen in Table 1, analytical information processing preferenced teams score lower on the external collaboration measure. However the independent samples t-test shows that analytical preferenced teams do not score significantly lower on the collaboration measure as the p value in Table 1 is 0.1785. Well above the threshold of 0.05.
4.2.2
Hierarchical Linear Regression Analysis
In order to fully understand the effect of team-level cognitive style on the dependent value external collaboration, hierarchical multiple regression is needed. Assumptions are tested in appendix 2. Some outliers were removed that surpassed the Cooks distance. When the adjusted R square is examined in Table 2 we can see that the explained variance decreases when the team-level cognitive style variable is added. Based on this result we would prefer model 1 as parsimony dictates that the most explained variance with the least amount of independent variables is better. Furthermore it can be seen in Table 2 that both models are not significant. Although model one comes close with a p-value of 0.053.
Table 2: Hierarchical Linear Regression Analysis
Dependent Variable
R2 Adjusted R2
ANOVA model significa nce
Team-level Cognitiv e Style Variable
Unstande rdized coefficie nts
Standerd ized coefficie nts
Cross-functiona lity Variable
Unstande rdized coefficie nts
Standerd ized coefficie nts
Average company experien ce Variable
Unstande rdized coefficie nts
Standerd ized coefficie nts
Team Size Variable
Unstande rdized coefficie nts
Standerd ized coefficie nts
Model 2: Average internal collaboration
0.055 -0.044 0.695 0.967 0.001 0.007 0.63 -0.354 -0.045 0.254 -0.018 0.007 0.776 -0.022 -0.045
Model 1: Gatekeeper external collaboration
0.177 0.113 0.053 0.797 -0.146 -0.040 0.014 -0.036 -0.392 0.456 -0.061 -0.110
Model 2: Gatekeeper external collaboration
0.190 0.104 0.085 0.444 -0.013 -0.116 0.716 -0.209 -0.057 0.023 -0.034 -0.369 0.446 -0.063 -0.113
Model 1: Gatekeeper external collaboration - Crossfunctionality
0.175 0.134 0.021 0.008 -0.037 -0.403 0.429 -0.064 -0.155
Model 2: external collaboration following gatekeeper theory – Cross-functionality
0.187 0.124 0.043 0.465 -0.012 -108 0.011 -0.036 -0.387 0.413 -0.066 -387
Model 1: Average external collaboration
0.054 -0.017 0.520 0.689 0.221 0.062 0.218 -0.017 -193 0.402 -0.070 -0.130
Model 2: Average external collaboration
0.147 0.059 0.176 0.047 0.035 0.316 0.976 -0.17 -0.005 0.115 -0.022 -0.243 0.408 -0.066 -0.124
Model 1: Average external collaboration – Cross-functionality
0.051 0.004 0.346 0.223 -0.017 -0.188 0.404 -0.069 -0.128
Model 2: Average external collaboration –Cross-functionality
0.147 0.083 0.093 0.040 0.035 0.315 0.110 -0.022 -0.243 0.401 -0.066 -0.124
0.771 -0.022 Hierarchical Linear Regression
Model 1: Average internal collaboration
5.
ROBUSTNESS CHECKS
5.1
Removing Cross-Functionality
As the variable cross-functionality did not contribute significantly to the model, cross-functionality was removed to improve the model. As expected the explained variance drops when comparing this model with the previous one as one variable is removed. The adjusted R square explains 0.124 of the variance compared with 0.104 explained variance in the previous model. Also it can be observed in Table 2 that including the variable team-level cognitive style in the model still does not increase the explained variance.
The ANOVA table shows that the two models significantly predict the dependent variable gatekeeper external collaboration. This can be concluded by examining the significance in Table 2.
Table 2 indicates Table 2: Hierarchical Linear Regression Analysisthat the team-level cognitive style measure is still not significant with a p-value of 0.2325. This means that there no presumption against the null hypothesis.
5.2
Average External Collaboration
In order to examine the relation external collaboration and team-level cognitive style even more, the variable average external collaboration is used. This variable is the mean collaboration of the individuals in a team and disregards the gatekeeper theory stated earlier.
5.2.1
Independent Samples t-test
Again it can be seen in Table 1 that analytical teams collaborate less externally than intuitive NPD teams. However Table 1 also shows this relation just falls short to being significant as the p-value is 0.0755. This means there is a low presumption against the null hypothesis.
5.2.2
Hierarchical linear Regression Analysis
Appendix 3 shows assumptions. Some influential cases were deleted as they surpassed the Cook’s distance. These are likely to be data entry faults.
As depicted in Table 2, including the variable team-level cognitive style significantly improves the explained variance. When the adjusted r square is examined, we can see that the inclusion of the cognitive style variable improves the explained variance with 0.0755.
However, when examining the significance of the models it can be concluded, from Table 2, that both models are not significant. Table 2 provides evidence that only the variable team-level cognitive style provide significantly to the dependent variable. It also seems to be that team-level cognitive style is the most important variable when we look at the standardized coefficients.
5.3
Average External Collaboration –
Cross-functionality
As cross-functionality did not significantly influence the dependent variable, this independent variable was removed in order to see if the model improves. When Table 2 is examined we can see that the adjusted R square between the model increases. Furthermore the adjusted R square of the variables average company experience, team size and team-level
cognitive style explain more variance than when the variable cross-functionality was included respectively 0.083 and 0.059.
When we examine Table 2 we see that the second model is just not significant in predicting the dependent variable. A p-value of 0.093 indicates a low presumption against the null hypotheses.
When the coefficient table is examined (Table 2), we see that the only variable significant in predicting the dependent variable is team-level cognitive style. Moreover it is the most important independent variable when looking at the standardized coefficients.
5.4
Control Variables
The models predicting average internal collaboration prove not to be significant and no model was found where the control variables significantly influence the model. In predicting gatekeeper external collaboration and average external collaboration the control variables also did not significantly influence the predictor variable. This indicates that the presumed relationship might not be linear.
5.5
Team-level Cognitive Style in Predicting
Internal and External Collaboration
Following the statistical tests we can safely say that hypothesis H1a and H2a are not supported by the data. Team-level cognitive style does not significantly influence the average collaboration intensity within a NPD team.
The relationship between external collaboration and team-level cognitive style is however proven to be leaning towards a significant one in this sample. The statistical tests provide some indications in support of hypotheses H1b and H2b. This means analytical preferenced NPD teams might display less external collaboration, intuitive teams might collaborate more externally. The independent samples t-test proves that there is an indication that analytical teams externally collaborate less. This relationship was further proven by the hierarchical multiple regression analysis where team-level cognitive style negatively influences external collaboration within NPD teams.
6.
DISCUSSION
6.1
Relation Average Internal Collaboration
and Team-level Cognitive Style
After statistical testing, the data suggests that there is no evidence to support hypotheses H1a and H2a. This means that the suggested arguments are not valid. The analytical thinking style of individuals does not limit the internal collaboration intensity, through the use of established structures.
Furthermore the notion that NPD teams with a preference for intuitive thinking collaborate less internally is in conflict with the reasoning behind the hypotheses. However it does fit with the evidence found by Carnabuchi53. In this study it was discovered that intuitive persons have a hard time mobilizing closed networks. This means that internal collaboration intensity is lowered as team members cannot be motivated by the novel ideas of the intuitive individuals.
The insignificant influence of the control variables on the dependent variable also indicates some problems with linearity. The control variables fail to explain the model and therefore the presumed linear relationship does not materialize. This means that other independent variables might better predict a linear relationship with the dependent variable.
53
This omitted variables problem of the low explained variance suggests a more important predictor variable is absent in the model. This could be the number of set meetings scheduled by the project leader. It is quite possible that internal collaboration is more regulated than emergent. The scheduled meetings effectively kill the incentive for team members to collaborate on their own initiative. The influence of cognitive styles thus is limited on the internal collaboration activities.
6.2
Relation Gatekeeper External
Collaboration, Average External
Collaboration and Team-level Cognitive
Style
The results, of the statistical testing of the average external collaboration and team-level cognitive style variables, prove that there might be a linear relationship. The independent samples t-test, where the mean of average external collaboration was examined between the two cognitive styles, just fell short of being significant with a p-value of 0.0755. The hierarchical linear regression models p-value was determined to be at 0.093. The variable team-level cognitive style in this model was found to be significant at a p-value of 0.04.
No evidence was found to support the assumption that external collaboration is influenced by gatekeepers. The statistical tests found no significant linear relationship and the t-test did not yield a significant difference between external collaboration through gatekeepers and the two groups of information processing styles.
The results suggest the relationship could be as previously hypothesized in hypothesis H1b and H2b. The p-values of the t-test and ANOVA model significance suggest that there is a low presumption to accept these hypotheses. Again however the control variables act in an unexpected way. Only average company experience contributed significantly to the model suggesting that the rest of the independent variables do not follow a linear relationship with the dependent variable. When we examine the explained variance of the adjusted R-square, we find a quite low explained variance of 0.083 in the best model. This means the variables used only explain 8% of the variability of the dependent variable average external collaboration. In this model however it was found that the variable team-level cognitive style is the most important variable, when the standardized coefficients are examined. These results suggest that analytical teams collaborate less externally than intuitive teams. The findings of this research add to existing research on cognitive styles and suggest that scores on the cognitive style index negatively influences external collaboration and thus innovation performance54.
To explain this relationship, signs can be sought in individual characteristics. As previously stated, analytical people do not deviate from existing routines and have a hard time recognizing the value of new information sources55. Individuals with a preference for intuitive thinking however are more likely to collaborate externally as they deviate from known routes and rely on different insights to reframe their innovation problems. Therefore teams with a preference for analytical thinking are less likely to collaborate externally and intuitive preferenced NPD teams collaborate more externally.
The fact that analytical preferenced teams have a hard time assessing the value of new information is in line with the findings of this research56. As teams with an analytical
54
(Hülsheger et al., 2009) 55
(Ven, 1986) 56
(Ven, 1986)
preference, collaborate less externally. This means these teams fail to see the value of external partners and miss the opportunities associated. Intuitive NPD teams do see the opportunities and therefore have an incentive to collaborate externally.
The fact that innovators are more likely to have t-shaped skills and a broad network makes it easier for these individuals to leverage their network57.
The need for individuals with a preference for the analytical thinking style to find solutions that fit their current mental framework inhibits external collaboration58. Solutions found in combination with external partners are more likely to be in conflict with their established framework. The incentive to further collaborate with the external partner is therefore limited.
6.3
Contribution to Theory
Although the literature on cognitive style is gaining momentum, the relationship collaboration and team-level cognitive style had not yet been examined. This study remedies this gap in existing literature and examines the relationship between aggregated cognitive styles and internal, and in particular, external collaboration.
7.
MANAGERIAL IMPLICATIONS
7.1
Contribution to Practice
Team-level cognitive style might explain external collaboration more than any other control variable used in this study. When a project dictates high external collaboration intensity, team-level cognitive style could be the most important variable to look at rather than the other control variables. Indicating that the same level of external collaboration, can be reached by constructing teams of two highly intuitive individuals, rather than three mediocre intuitive individuals. So projects that demand high intensity external collaboration are better suited to intuitive teams rather than analytical teams. This also eliminates the efficiency decrease when teams become larger. Time spent on coordination increases which otherwise could have been spent on the project.
However the as explained variance was limited and some control variables insignificantly contributed to the models, a better predicting variable is needed. Company structure or even industry structure could possibly better predict external collaboration. Industries that are characterized by open innovation are more likely to collaborate externally. When company culture recognizes the value of open innovation and networked organizations, they will foster internal and external communication, by building networks with other organizations, teams and departments59.
The relationship between internal collaboration and team-level cognitive style however has not been found to be significant. Existing literature on team size, cross-functionality and company experience still dictate the intensity in which teams internally collaborate60,61.
8.
LIMITATIONS
The data was collected using questionnaires. This means the data relies on subjective measures. The questionnaires make subjects aware that they are being examined as it is an intrusive data collection method. Here demand characteristics and social desirability are threats to the experimental construct validity.
57 (Madhavan & Grover, 1998) 58
(Kirton & De Ciantis, 1986) 59
(Hülsheger et al., 2009) 60
(Katz, 1982) 61
The subject may want to help the researcher and fill out the questionnaires biased so the researcher gets positive results rather than respondents fill the questionnaires out truthfully. Furthermore it is hard to check if the intended subject actually fills out the questionnaire or that a colleague fills out the questionnaire.
Additionally there might be some problems with construct validity. The measure external collaboration is rated on a five point scale dependent on the intensity of the external collaboration. This scale leaves room for biased answers. A score of three might mean two different things to two individuals. Collaboration might be distinguished between communication and actual physical collaboration. Furthermore these two constructs could be constructed of several well formulated items, in order to further enhance the validity. External validity might be low as the sample group is quite universal in its demographics. The sample comprises only organizations in high technological driven industries and the fast majority of the team members were men. Furthermore most organizations were situated in the Netherlands.
The quite low value of the adjusted R-square and therefore the low explained variance of the dependent variable average external collaboration, suggest the problem of omitted variables. Important predictor variables might be left out of the model which actually better predict the model.
The one-dimensional cognitive style measure of the cognitive style index is lately surpassed by the multidimensional measures of Epstein62. Epstein’s measure might better predict the dependent variable and have a higher external validity. Also the concept of cognitive style has been said to be stable63. Some scholars however are questioning this aspect of cognitive style. They have suggested individuals adapt their cognitive styles to their tasks6465.
This study presumes that, high intensity of internal and external collaboration, positively influences innovation performance. Many scholars have proven this relationship66. This is however not always the case. Improved collaboration also increases job stress which negatively influences innovation performance67. Furthermore high intensity collaboration is not always an indication for great processes. Failing to provide clear goals and vision could send teams a drift68. In order to refocus on the goals set, more collaboration needed. High intensity collaboration can thus be a construct for poorly designed and executed internal processes.
9.
SUGGESTIONS FOR FUTURE
RESEARCH
The reliance on questionnaires when doing research is mostly unavoidable. However to reduce bias some objectives measures should be added. To improve the measure of internal and external collaboration, data on hours spent in meetings and number ideas generated should improve the objectivity of the measure. These measures allow no room for interpretation bias as these are concrete measures. The addition of these measures will significantly improve the reliability and validity of the constructs and measures.
62
(Armstrong et al., 2012) 63
(de Visser et al., 2014) 64 (Hsee & Rottenstreich, 2004) 65
(Zhong, 2011) 66
(Hülsheger et al., 2009) 67
(Academy et al., 2001) 68
(Hülsheger et al., 2009)
The problems with control variables suggest the relationship between the variables is not linear. Further statistical testing can improve our understanding of the relationship between the team-level cognitive style and internal and external collaboration. Spearman’s rho could provide a helpful insight as its not affected as much by a bend in the scatter plot. By plotting the ranking of the dependent variable in a scatter plot a more linear relationship should emerge. Additional data gathering is needed to improve reliability. Furthermore this data should be collected from diverse demographic sources. The omitted variables problem suggests that there are other variables that are better able to predict the dependent variables. Additional research is needed to discover which variables are better in predicting the dependent variable.
The indication that cognitive style is better assessed through a multidimensional measure of Epstein, calls for replication of this study with Epstein’s measure of cognitive style69
. The use of this measure might increase the reliability of this study. It would also be interesting to see if the gatekeeper theory holds up when the sample size is increased. Also an analysis should uncover if gatekeepers are exclusively intuitive individuals or evenly distributed among analytical and intuitive individuals.
10.
ACKNOWLEDGEMENTS
This paper consumed large amount of work and challenged my academic abilities. However this paper would not have been possible without the help of my supervisor. I would like to sincerely thank my supervisor, dr. de Visser, for his helpful comments during meetings and his swift replies to any questions I had. Furthermore the data and articles provided by dr. de Visser proved very helpful and aided in delivering a quality paper.
69
11.
REFERENCES
1: Academy, K., Academy, K., Journal, M., Journal, M., Global, I., & Global, I. (2001). Cross-functional project groups in research and new product development: Div... Management, 44(3), 547–555.
2: Allinson, C. W., & Hayes, J. (1996). The cognitive style index: A measure of intuition- analysis for organizational research. Journal of Management Studies, 33(1), 119– 135. http://doi.org/http://dx.doi.org/10.1111/j.1467-6486.1996.tb00801.x
3: Ancona, D., & Caldwell, D. (1986). Management issues in new product teams in high technology companies. Vasa.
Retrieved from
http://medcontent.metapress.com/index/A65RM03P4874 243N.pdf\nhttp://dspace.mit.edu/handle/1721.1/48349
4: Armstrong, S. J., Cools, E., & Sadler-Smith, E. (2012). Role of Cognitive Styles in Business and Management: Reviewing 40 Years of Research. International Journal of Management Reviews, 14(3), 238–262. http://doi.org/10.1111/j.1468-2370.2011.00315.x
5: Barczak, G., Griffin, A., & Kahn, K. B. (2009). Perspective: Trends and drivers of success in NPD practices: Results of the 2003 PDMA best practices study. Journal of Product Innovation Management, 26(1), 3–23. http://doi.org/10.1111/j.1540-5885.2009.00331.x
6: Carnabuci, G., & Oszegi, D. I. (2015). Social Networks, Cognitive Style, and Innovative Performance: a Contingency Perspective. , 58(3), 881–905.
7: Clark, K. B., & Wheelwright, S. C. (1993). Organizing and leading “heavyweight” development teams. Long Range Planning, 26(1), 155. http://doi.org/10.1016/0024-6301(93)90321-6
8: de Visser, M., Faems, D., Visscher, K., & de Weerd-Nederhof, P. (2014). The Impact of Team Cognitive Styles on Performance of Radical and Incremental NPD Projects. Journal of Product Innovation Management, 31(6), 1167–1180. http://doi.org/10.1111/jpim.12247
9: Edmonson, A. (1990). Psychological Safety and Learning Bahavior in Work Teams. Adninistrative Science Quarterly, 44(2), 1–20.
10: Epstein, S., Pacini, R., Denes-Raj, V., & Heier, H. (1996). Individual differences in intuitive-experiential and analytical-rational thinking styles. Journal of Personality and Social Psychology, 71(2), 390–405. http://doi.org/10.1037/0022-3514.71.2.390
11: Evans, J. S. B. T. (2008). Dual-processing accounts of reasoning, judgment, and social cognition. Annual Review of Psychology, 59, 255–278. http://doi.org/10.1146/annurev.psych.59.103006.093629
12: Harrison, D. A., Price, K. H., Gavin, J. H., Florey, A. T., Harrison, D. A., Price, K. H., … Florey, A. T. (2015). TIME , TEAMS , AND TASK PERFORMANCE : CHANGING EFFECTS OF SURFACE- AND DEEP-LEVEL DIVERSITY ON GROUP FUNCTIONING, 45(5), 1029–1045.
13: Hayes, J., & Allinson, C. W. (1994). Cognitive Style and its Relevance for Management Practice. British Journal of Management. http://doi.org/10.1111/j.1467-8551.1994.tb00068.x
14 : Hsee, C. K., & Rottenstreich, Y. (2004). Music, Pandas, and Muggers: On the Affective Psychology of Value. Journal of Experimental Psychology: General, 133(1), 23–30. http://doi.org/10.1037/0096-3445.133.1.23
15: Hülsheger, U. R., Anderson, N., & Salgado, J. F. (2009). Team-level predictors of innovation at work: a comprehensive meta-analysis spanning three decades of research. The Journal of Applied Psychology, 94(5), 1128–1145. http://doi.org/10.1037/a0015978
16: Katz, R. (1982). The Effects of Group Longevity on Project Communication and Performance. Administrative Science Quarterly, 27(1), 81–104. http://doi.org/10.2307/2392547
17: Keller, R. T., & Holland, W. E. (1978). Individual characteristics of innovativeness and communication in research and development organizations. Journal of Applied Psychology, 63(6), 759–762. http://doi.org/10.1037/0021-9010.63.6.759
18: Kirton, M. J., & De Ciantis, S. M. (1986). Cognitive style and personality: The Kirton adaption-innovation and Cattell’s sixteen personality factor inventories. Personality and Individual Differences, 7(2), 141–146. http://doi.org/10.1016/0191-8869(86)90048-6
19: Madhavan, R., & Grover, R. (1998). From Embedded Knowledge to Embodied Knowledge : New Product Development as Knowledge Management University of Illinois ISBM Report 3-1996 Institute for the Study of Business Markets The Pennsylvania State University. The Journal of Marketing, 3004(814), 1–12.
20: Payne, R. L., Lane, D., & Jabri, M. (1990). A Two-Dimensional Person-Environment Fit Analysis of the Performance, Effort and Satisfaction of Research Scientists. British Journal of Management. Retrieved from http://onlinelibrary.wiley.com/doi/10.1111/j.1467-8551.1990.tb00155.x/abstract
21: Perry-Smith, J. E., & Shalley, C. E. (2003). the Social Side of Creativity: a Static and Dynamic Social Network Perspective. Academy of Management Review, 28(1), 89– 106. http://doi.org/10.5465/AMR.2003.8925236
Innovation: The Mediating Roles of Psychological Safety and Cooperative Learning. Group & Organization
Management, 37(5), 555–588.
http://doi.org/10.1177/1059601112456289
21: Ven, A. H. (1986). Central problems in the management of innovation. Management Science, 32(5), 590–607. Retrieved from http://www.jstor.org/stable/2631848
12.
APPENDIX
12.1
Appendix 1
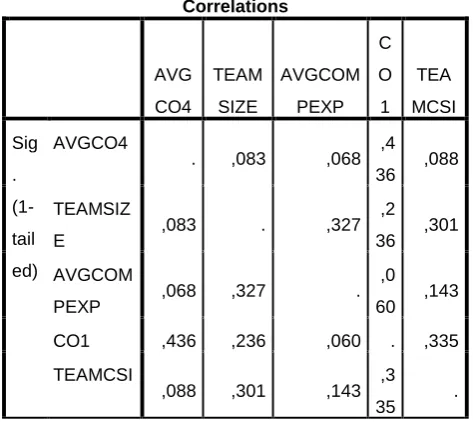
Multicollinearty can be assessed by examining the correlations as depicted in Table 3. Here no significant correlation was found between the independent variables, although the variable average company experience and team CSI come close at 0.054.
Table 3: Correlations independent and dependent variables
Correlations
AVG
CO2
TEAM
SIZE C
O
1
AVGCOM
PEXP TEA
MCSI
Sig
.
(1-tail
ed)
AVGCO2
. ,459
,4
85 ,047 ,133
TEAMSIZ
E ,459 .
,0
84 ,352 ,444
CO1 ,485 ,084 . ,172 ,115
AVGCOM
PEXP ,047 ,352
,1
72 . ,021
TEAMCSI
,133 ,444 ,1
[image:13.595.52.298.157.503.2]15 ,021 .
Table 4: Residual statistics
Residuals Statisticsa
Minimum Maximum Mean
Std.
Deviation N
Cook's
Distance ,000 ,433 ,035 ,077 49
a. Dependent Variable: AVGCO2
There are some outliers as Cooks distance D>4/n-k-1 = D>0,0930. When Table 4 is examined, the maximum is 0.4333 so there are some outliers.
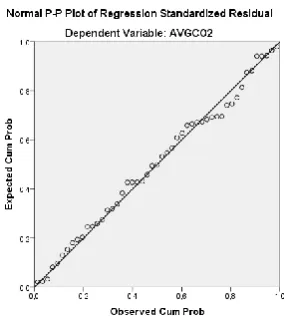
[image:13.595.44.541.167.516.2]
Figure 1: p-p plot average internal collaboration
When we look at the p-p- plot in Figure
1
, we can see that some points deviate from line somewhat so linearity of this model is questionable. [image:13.595.305.542.172.382.2]12.2
Appendix 2
Table 5: Correlation table gatekeeper external collaboration
Correlations
HIGH
CO4
TEAM
SIZE C
O
1
AVGCOM
PEXP TEA
MCSI
Sig
.
(1-tail
ed)
HIGHCO
4 . ,202
,3
35 ,011 ,374
TEAMSIZ
E ,202 .
,2
36 ,327 ,301
CO1 ,335 ,236 . ,060 ,335
AVGCOM
PEXP ,011 ,327
,0
60 . ,143
TEAMCSI
,374 ,301 ,3
35 ,143 .
[image:13.595.306.546.466.572.2]Table 5 depicts that correlations fall between measures although average company experience does correlate close to significant with team-level cognitive style.
Table 6: Residual statistics gatekeeper external collaboration
Residuals Statisticsa
Minimum Maximum Mean
Std.
Deviation N
Cook's
Distance ,000 ,181 ,023 ,041 47
a. Dependent Variable: HIGHCO4
Table 6 depicts that there are some outliers as Cooks distance
[image:13.595.88.233.553.712.2]Figure 2: p-p plot gatekeeper external collaboration
Again it can be seen in Figure 2 the deviation from the straight
line suggest problems with linearity and normality.
12.3
Appendix 3
Table 7: Correlation table average external collaboration
Correlations
AVG
CO4
TEAM
SIZE
AVGCOM
PEXP C
O
1 TEA
MCSI
Sig
.
(1-tail
ed)
AVGCO4
. ,083 ,068 ,4
36 ,088
TEAMSIZ
E ,083 . ,327
,2
36 ,301
AVGCOM
PEXP ,068 ,327 .
,0
60 ,143
CO1 ,436 ,236 ,060 . ,335
TEAMCSI
,088 ,301 ,143 ,3
35 .
[image:14.595.310.543.92.185.2]Correlations are not significant as depicted in Table 7.
Table 8: Residual statistics average external collaboration
Residuals Statisticsa
Minimum Maximum Mean
Std.
Deviation N
Cook's
Distance ,000 ,209 ,024 ,043 47
a. Dependent Variable: AVGCO4
There are some outliers as cooks distance of 0.09756 is
surpassed in Table 8.
Figure 3: p-p plot average external collaboration
Deviation from line suggests problem with linearity and
normality as can be seen in Figure 3: p-p plot average external
collaboration.
[image:14.595.339.460.247.382.2] [image:14.595.52.289.385.596.2]