3D Point Cloud Reconstruction Based on the Finger Vascular Pattern
Sebastian Bunda (s1701290)
1Abstract— In the last few years the principle of having finger vein recognition for biometric identification has gained in popularity. Unfortunately, this procedure is very sensitive to the orientation of the finger. At the Biometric Pattern Recognition chair at the University of Twente a device has been designed to be able to capture three images of the finger veins. This paper is the first attempt to try to solve this orientation problem by creating a three-dimensional model of the finger veins using the device. A 3D point cloud of the finger veins of an index finger has been created using stereo reconstruction. Utilizing the camera parameters obtained by camera calibration, the images of two different angles can be processed. The 3D model could be reconstructed by creating a disparity map using the knowledge obtained by an algorithm that can isolate the finger. Two known test models that simulated the finger vein structure were created to estimate the accuracy of the 3D model. By reconstructing the models, it is shown that there is still improvement possible for future research. The method shown in this paper shows that it is in fact possible to get 3D models of the vascular system of the finger. The method still needs improvements in terms of speed and accuracy. This paper also provides several recommendations concerning the 3D model acquisition and improvements of the finger vein scanner used in this work.
Index Terms— Finger veins, 3D point cloud reconstruction, camera calibration, disparity map.
I. INTRODUCTION
In a lot of consumer devices, such as phones and laptops, fingerprint recognition is a common authentication proce-dure. However, fingerprints are easy to forge, as they can easily be obtained from smooth surfaces. As an alternative for fingerprint recognition, finger vein recognition has been proposed. Since the finger veins form by a natural process, the position and shape are different for each person. Finger veins can be detected with the use of infra-red light since hemoglobin absorbs wavelengths between 800 nm and 1000 nm [1]. This results in the veins to appear dark on the images. There is a lot of light scattering inside the finger, which causes the camera only to capture the finger veins at the surface and make the rest of the finger light up. This unfortunately results in a significant change in the vascular pattern captured by the camera if the finger is rotated over the longitudinal axis. Hypothetically, by creating a three-dimensional structure of the finger veins, these kind of rotations should have less impact.
At the Biometric Pattern Recognition (BPR) chair at the University of Twente, a finger vein scanner has been designed that enables the finger veins to be captured from three
1Sebastian Bunda is a Bachelor student at the Faculty of Electrical
[image:1.595.316.566.149.267.2]Engineering, Mathematics and Computer Science, University of Twente, 7500 AE Enschede, The Netherlands
Fig. 1. The 3D finger vein scanner of the BPR group[2]
different angles. The research of this paper is the first attempt at creating a three dimensional structure of the finger vascular system utilizing this device. The goal of this paper is to show whether it is possible to create a 3D point cloud of the finger veins based on the three camera angles of this device. And subsequently give an indication of the accuracy of the 3D model and to show primary findings on the effect of the rotation of the 3D model.
In the next section, all related work which is used for this research will be described, including a summary of the current setup. In Section III, this paper will go into detail of the acquisition system and how the system is calibrated to make 3D reconstruction possible. In Section IV, the method of obtaining a 3D point cloud will be explained. Next, in Section V, the evaluation method will be discussed that will be used to test the system. After that in Section VI, the results will be shown from the experiments. In Section VII and VIII, the results will be discussed, and a conclusion will be drawn. Finally, Section IX will list the recommendations for future research.
II. RELATED WORK
A. The current setup
B. The finger vein scanner of B. Ton
Fig. 2. The old finger vein scanner of the SCS group[1]
The current device is mainly based on the finger vein scanner of B. Ton. This device, which be seen in figure 2, was developed at the Services Cybersecurity and Safety chair at the University of Twente in 2012. It was not designed for 3D finger vein recognition, instead its focus lied at the finger vein recognition. The methods to obtain the finger vein patterns are very helpful for this paper.
C. 3D finger vein point cloud matching
Fig. 3. The 3D finger vein scanner of University of Electronic Science and Technology of China[3]
There exists a similar finger vein scanner to the finger vein scanner made at the DMB group. This device has been built at the University of Electronic Science and Technology of China, see figure 3. This device uses two cameras in the length of the finger to obtain a stereo image. Since the objective of this paper is to show the effectiveness of the 3D point cloud against rotation of the finger, having two cameras in the length of the finger will be less interesting. Nevertheless, the approach of obtaining the point cloud of the finger veins is similar to the approach in this paper.
D. Augmented 3D vein scanner
[image:2.595.88.256.90.185.2]The three-dimensional reconstruction of veins is a prac-tice which is not limited to biometric authentication. The Beijing Engineering Research Center of Mixed Reality and Advanced Display created a vein scanner which should help medical practitioners with finding veins used for intravenous injections. By creating a stereo image of the veins using near
Fig. 4. The 3D stereo camera created by Beijing Engineering Research Center of Mixed Reality and Advanced Display. The stereo camera setup without cover (left). The projection of the veins on the fists (top right) and the 3D models (bottom right).[4]
infrared (NIR) light vein structures could be obtained that were processed further to create a 3D model. With the use of augmented reality these veins could then be projected back onto the skin to be used for finding the veins. The scanner and the results can be seen in figure4. Despite the fact that the purpose and the region is different from this research, the approach of obtaining the structures is very interesting and were useful to this paper.
III. FINGER VEIN AQUISITION SYSTEM AND CALIBRATION
Fig. 5. The finger vein acquisition system with dimensions. The back-ground image is made from a SOLIDWORKS design of the finger vein scanner [2]
[image:2.595.55.304.337.482.2] [image:2.595.330.536.346.568.2]design featured an IR pass filter to block the visible light. As the finger is placed on this filter, the filter had become dirty which also affected the images.
The left, middle and right camera will from now on be referred to as cam1, cam2 and cam3 respectively. Cam1 and cam3 are both placed under an angle 22.5◦ with respect to cam2.
Note, for the experiments in sectionVthe objects will be placed closer to the cameras which will change the viewing angles.
A. Camera Calibration
In order to use the images captured by the acquisition system, the system has to be calibrated. This means that all the parameters of all the cameras should be known and most distortion should be removed.
As mentioned before the current camera setup uses fish eye lenses to have a large field of view. The drawback is however, that there is some radial, ”barrel”, distortion which causes straight lines to increasingly bend as they move further away from the center. This effect actually describes a 3D parabola [5]. Theoretically, if the parabola coefficients are known, the behaviour of such a lens can be corrected. Matlab [6] has a tool calledCameraCalibratorwhich is based on the principle proposed by Zhang[7]. This tool requires the user to make 10-20 images of a checkerboard pattern. A checkerboard pattern is a well-defined object in the sense that it has straight lines and has equal sized squares. By detecting the corners of the squares, the intrinsic parameters of the camera can be computed. These parameters include the focal length in x and y direction expressed in pixels, skew rate, and the coordinates of the principal point. The tool also removes the radial distortion caused by the fish eye lens.
B. Camera calibration in this study
In order to calibrate the finger vein scanner, a series of images were taken for each camera independently. Since the focus distance of the camera was very small, the checker-board pattern had to be close to the scanner. To make sure that there were enough images of the checkerboard pattern that were good enough for the calibration, 50 images were taken. For cam1, cam2 and cam3, 38, 31 and 32 images were used respectively to have an mean estimated error below half a pixel. The size of each square was 7.9259 mm. The tool needed such high accuracy of the size for the scene reconstruction, which is done later in this paper. Knowing the exact parameters of the camera can be helpful to make an accurate 3D point cloud. In figure6, it can be seen that the fish-eye effect distortion has a heavy effect on the images.
C. Stereo camera calibration
Once all the cameras were calibrated individually, the
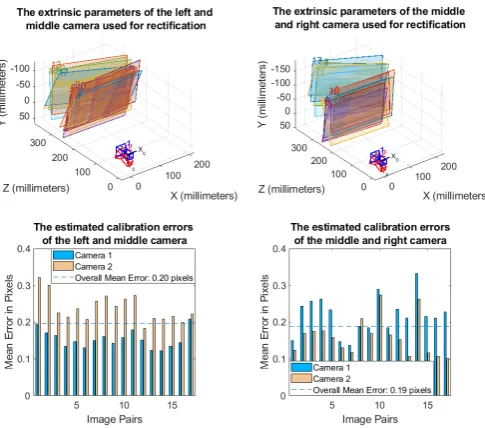
[image:3.595.313.566.51.127.2]StereoCalibrationtool of Matlab was used to determine the relative extrinsic parameters of the cameras. Since this tool is only capable of determining the relative distance between two cameras, the calibration was done two times: for cam1-cam2 and cam1-cam2-cam3, as can be seen in figure 7. The
Fig. 6. The distorted and corrected image from the middle camera.
viewing distance was limited, resulting in the fact that it was not possible to do a calibration session for the three cameras at the same time. Thus, the checkerboard positions are not the same for both calibration sessions.
Fig. 7. The extrinsic parameters of the finger vein scanner cameras generated by Matlab
IV. FINGER VEIN STRUCTURE RECONSTRUCTION
Due to time restrictions, only stereo reconstruction is done using the stereo calibration parameters. Since the goal is to create a 3D structure of the finger veins, in the next step the structure of the finger veins will be extracted from the images.
A. Finger vein acquisition
[image:3.595.318.561.223.437.2]Fig. 8. The system overview
1) Cropping the image:
Most of the image is not necessary for the 3D reconstruction and would only increase the computation time and add noise. The images are thus cropped in such a way that most fingers would fit inside that frame. However, for the 3D reconstruction later, the images should have the original size. The cropped images will then be placed in a matrix filled with zeros in the original position.
2) Adaptive histogram equalization:
From the original image it is still relatively difficult to see all the veins. A common method to increase the contrast is to equalize the histogram. Histogram equalization is the method to equally distribute the light levels of an image over the whole brightness scale [9]. This causes very dark areas to become lighter and very bright areas to become darker. Since the image is not equally bright everywhere, an adaptive histogram equalization is preferred. Contrast limited adaptive histogram equalization (CLAHE) is used to reduce the overall noise of the image [10].
3) Gaussian Filter:
Since there is still a lot of noise that is picked up by the next steps, a Gaussian filter with a sigma of 1 is applied over the image [11].
4) Bordering the image and removing the background:
In order to remove the background for the finger vein reconstruction software, some steps had to be taken. First, a Gaussian filter is applied (with sigma = 2) in order to smoothen out all the transitions. The edges of the finger are found using the assumption that the edges have a large gradient. Considering the finger has edges at both sides, the image is cut along the vertical axis. Unfortunately, the edge is not always a connected line and may jump around in the image. So, in order to reduce this effect, the moving mean is taken over this line with a window size of 50 pixels.
After this algorithm the two images are concatenated together again.
5) Vein acquisition using Bram Tons code:
[image:4.595.360.510.186.335.2]Looking at the paper and the code of Bram Ton [12][8], there are several methods that could be used for finger vein extraction. In the end, the finger vein acquisition was based on the repeated line tracking method since it proved to clearly show all the veins. One disadvantage of this method is that it is based on iterations which caused the vascular image to change slightly every time the program was ran.
Fig. 9. The finger vein structures of cam2 a) is the processed image up until step 3
b) is the vascular pattern of an index finger using the the repeated line tracking algorithm
c) is the combination of a) and b) for visualization purposes
B. Theory
In order to create a 3D model of the finger vein structure, the veins from cam1 should be matched with the veins of cam2. The theory behind the following method is mainly based on the book Computer Vision for Visual Effects by R.J. Radke [13].
Fig. 10. The rectified images of cam1 and cam2 showing the epipolar lines
’disparity’. A disparity map shows the distance between the pixels, so objects close to the camera have a higher disparity and objects further away have a lower disparity. Knowing the disparity and the camera parameters, the pixels can be mapped in a 3D-space and can thus be used to create a 3D point cloud. Since the goal is to obtain 3D images of the finger veins, first the structure of the finger veins will be obtained.
C. Rectification
Using the calibration methods in section III-C, the test images from the previous section could be rectified. Matlab had some problems with rectifying fish eye lens images, so in order to rectify the frame, the barrel distortion was removed from the original images before the stereo calibration. These images were then used for the stereo calibration in section III-C. The rectified images of cam1 and cam2 can be seen in figure10. The epipolar lines are also shown. From this it can be concluded that the images are parallel and properly rectified. Another remark that have to be made is that the rectification resulted in a 180◦turn between the cam1-cam2 rectification result and the cam2-cam3 rectification result. It would appear that the different position of the epipoles for both situations resulted in a different rectification. It should also be noted that it did not matter which camera was taken as the reference camera for the orientation of the rectified image.
D. Disparity
[image:5.595.113.240.51.213.2]Normally, disparity is used over the entire image. Ho-wever, since the goal of this paper is to reconstruct the finger veins in a three-dimensional way, the information about the position of the veins is used. Using the previous section, the finger veins can be obtained. The result is a binary image that is white on the location of the finger vein and black where the software was unable to detect the veins. The matching window was then obtained by using the position of a white pixel in the binary image in each row and relating that to a window of the size of 75x75 pixels on the original image. The window size is mainly based on the fact that a smaller window introduced a lot of noise in
Fig. 11. The SAD of a window of the image from cam1 compared with the row from the image from cam2. The disparity is defined as the pixel displacement from left to right
the reconstruction. This matching window is then compared with similar windows on the second image on the same row. In order to evaluate the best match, the sum of absolute differences (SAD) was calculated. The lowest number should correspond to the correct disparity. In order to speed up the algorithm, the function only looks within a specified disparity range, this was calculated for the finger images to be between 150 and 200 pixels. This was found by looking at a stereo anaglyph where by a measurement of distance in pixels was made. Steps have to be taken in the future to decrease the computation time, which was still significant but not timed. Figure 11shows a visual representation of determining the disparity using the SAD.
This method is relatively less complex than other methods, which is partly because the finger vein images had more constraints than normally. For example finger veins, are at the surface of the finger. The probability that the order of the veins is different is very slim. In future research this disparity method could be improved by comparing the disparities and SAD’s in both directions. Now the disparity map is obtained by comparing the two images with one vein image. To make the comparison between the two reconstructions easier, it is chosen for the first reconstruction to have the vascular structure of cam2 as the reference image. This means that for the cam1-cam2 disparity map, the disparity is take backwards. Or in other words, the disparity is defined as the pixel displacement from right to left, instead of what figure11might suggest, left to right.
E. Point Cloud Generation
[image:5.595.318.562.53.242.2]and the stereo camera parameters. These 3D points can be used to create a 3D point cloud. The difference in orientation of the rectified images, as discussed earlier, resulted in a similar difference in orientation in the 3D environment. In order to keep the appearance consistent, the point cloud generated from cam1-cam2, was rotated with 180◦along the y-axis. For figure 12, the point clouds were also translated to appear in the origin.
Fig. 12. The 3D point clouds created of an index finger using cam1-cam2 and cam2-cam3
Purple is first point cloud and Green is the second point cloud in the merged images
V. EVALUATION OF 3D FINGER VEINS RECONSTRUCTION
A series of experiments have to be performed in order to evaluate the performance the 3D reconstruction. The goal of this paper was to show whether it is possible to create a 3D point cloud of the finger veins based on the three camera angles of the acquisition device, to give an indication of the accuracy of the 3D model and to show primarily findings on the effect of the rotation of the 3D model. In order to evaluate the level of accuracy of the 3D point cloud, the 3D point cloud has to be compared with well-defined test objects and after that with real fingers. Here a well-defined object is an object which is measured in the real world and has known dimensions.
A. Real fingers
The first experiment will be based on the real 3D finger vein reconstruction. The reconstructed model will mostly be visually inspected and evaluated. The goal is to see whether the 3D model is a good representation of the finger veins and whether it looks realistic. In this section no real values will be measured or calculated.
B. Flat Test Object
For the second set of experiments, an object will be created and measured. This object has the form of a small sheet of paper with the same size as the IR-pass filter. The dimensions can be seen in figure13and tableI.e, is the distance to the camera. Since the object is flat, the 3D reconstruction should also be flat. The goal of these experiments is to estimate the accuracy of the calibration and to show the influence of the rectification on the camera viewing angle.
Fig. 13. The dimensions of the flat test object.
The first experiment will evaluate the effect of rotational transformations to the projection of the 3D model. The acquisition device uses two cameras which see the test object from a different angle, α. In order to find the disparity between the images, the images have to be rectified. This means that the views of the camera get transformed as if the cameras were parallel to each other. The question is whether the view of cam2 can be approximated by rotating the 3D world with half the angle α along the y-axis. If at that point the 3D model is at the origin of the x-axis, it would then mean that the object would be right above cam2. Since the object is closer to the cameras compared with the setup in figure 5, the new camera angles have to be calculated. The distance from cam1, cam2 and cam3 are 38.14mm, 40.63mm, 40.89mm respectively. These distances result in the angles of 29◦ between cam1 and cam2. Thus to approximate the viewing angle of cam2, the point cloud should be rotated with 14.5◦ along the y-axis. The model will be rotated from 0 to 30◦ and the average x-limit will be calculated. By plotting these values, the lowest value can found, which would mean the position where the 3D world would match the view of cam2.
[image:6.595.313.562.181.238.2]on 6 different positions to determine the average value. The error margin is also calculated using the standard deviation. The 3D model will be rotated in a way that it is parallel with XY plane. All these measurements will be shown in a table which will also show the error and the error in pixels. The error in pixels will be calculated by dividing the number of pixels by size of the 3D model. This value will then be multiplied with the error. The errors will be expected to fall within the error margins.
C. Round Test Object
To evaluate the accuracy of the depth perspective, a round object will be used. Using the same pattern as the flat test object, a cylinder shape will be folded from a sheet of paper. The circumference of the cylinder will be 70 mm.
To fix the position of the object, the cylinder will be attached to the scanner using double sided tape. This caused the object to be in a different position as the fingers or the flat object. The new distances are 44.7 mm and 47.09 mm respectively for cam1 and cam2. This results in an angle of 24.5◦. The estimation is that the 3D model also has to be rotated with 12.3◦ in order to approximate the viewing angle of cam2. The object will also be rotated in order to show whether the rotational impact is the same for a three-dimensional object. This relationship will be shown using a similar graph as in the previous section.
The measurements will be made similarly as in the pre-vious section and will also be shown using a table. For this measurement, however, different attributes will be measured. These attributes are chosen such that the focus is more on the horizontal displacement of the lines of the object.
VI. RESULTS
A. Real fingers
Figure12shows the 3D point clouds reconstructed using cam1-cam2 and cam2-cam3. For easier identification the point cloud reconstructed using cam1 and cam2 will be denoted as the first model and the other point cloud will be identified as the second model. The merged point cloud will be identified as the third model. The following points can immediately be noted about these models:
• The second model has some point clusters on odd locations.
• In the first and second model, some structures appear to be flat, of which it is unclear whether that is the case in the real world.
• In all models the veins appear to be in the shape of a real finger.
• The third model shows the overlap in both reconstruc-tions to be significant.
• The veins are easy to identify in all the models
• It can be seen with model 1 and model 2 that some of the veins are not continuous lines but rather detached clusters.
B. Flat Object
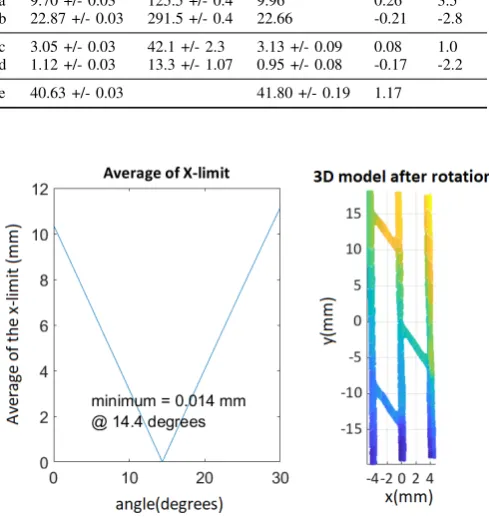
The results of the flat object experiments can be seen in figure14and tableI. The 3D model measurements have been done after rotating the model with 3.3◦along the x-axis and 14.4◦ along the y-axis to make the model parallel with the XY plane. The 3.3◦ was found via a similar method as in figure14.
TABLE I
THE REAL FLAT OBJECT VS.BINARY IMAGE VS.POINT CLOUD MODEL
Real world dimentions (mm)
Pixel dimensions (pixels)
3D model dimensions (mm)
Error (mm)
Error (pixels)
[image:7.595.314.559.230.489.2]a 9.70 +/- 0.03 125.5 +/- 0.4 9.96 0.26 3.5 b 22.87 +/- 0.03 291.5 +/- 0.4 22.66 -0.21 -2.8 c 3.05 +/- 0.03 42.1 +/- 2.3 3.13 +/- 0.09 0.08 1.0 d 1.12 +/- 0.03 13.3 +/- 1.07 0.95 +/- 0.08 -0.17 -2.2 e 40.63 +/- 0.03 41.80 +/- 0.19 1.17
Fig. 14. The average of the X-limit vs. the angle in the y-axis
C. Round object
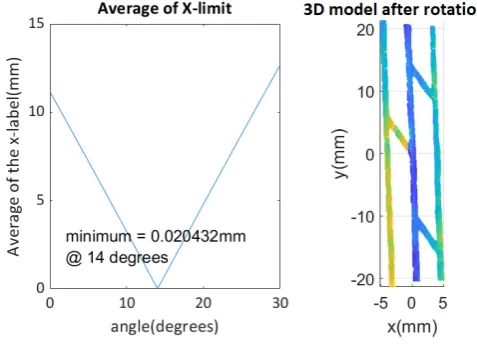
The results of the flat object experiments can be seen in figure15, figure16and tableII. The 3D model measurements were done after rotating the model with 3.3◦along the x-axis and 14◦ along the y-axis just like the flat test model. The following attributes were chosen:
• a = the distance between the first and second vertical line;
• b = the distance between the second and the third vertical line;
• c = the distance between the first and third vertical line;
• d = the width of the second vertical line;
• e = the distance of the camera to the first line;
• f = the distance of the camera to the second line;
Fig. 15. The cylindrical object and the 3D reconstructed image.
TABLE II
THE REAL CYLINDRICAL OBJECT VS.BINARY IMAGE VS.POINT CLOUD MODEL
Real world dimentions (mm)
Pixel dimensions (pixels)
3D model dimensions (mm)
Error (mm)
Error (pixels)
a 3.17 +/- 0.03 34.3 +/- 1.2 3.09 +/- 0.11 -0.08 0.9 b 3.11 +/- 0.03 38.1 +/- 0.6 3.06 +/- 0.11 -0.05 0.6 c 7.25 +/- 0.03 85.6 +/- 0.6 7.05 +/- 0.08 -0.20 2.4 d 1.07 +/- 0.03 12.7 +/- 0.9 0.92 +/- 0.07 -0.15 2.1 e 48.2 +/- 0.03 46.2 +/- 0.3 -2.0 f 47.1 +/- 0.03 45.5 +/- 0.1 -1.6 g 47.8 +/- 0.03 46.1 +/- 0.1 -1.7
VII. DISCUSSION
[image:8.595.59.295.292.398.2]The goal of this research is to show to whether it is possible to create a three-dimensional structure based on the vascular system of a finger. Figure12shows that it is indeed possible to create a 3D model based on two views of the finger. Unfortunately, the reconstruction is not flawless. The models appear to have some level of distortion that is likely to be caused by the disparity map. Since the disparity map is only based on the vascular structure of the view of cam2, some veins may not appear in the view of cam1. This could cause an error in the actual disparity. The point cloud of cam2-cam3 shows that the point cloud is still sensitive to noise. The merged point cloud shows that both point clouds are very similar, and indicates that a 3D reconstruction with 3 cameras should be feasible. In terms of realism, the point clouds both resemble the shape of the finger and the finger veins are clearly visible. This would suggest that the 3D reconstruction was successful in the sense that the models show the three-dimensional surface projection of the finger veins. What should be noted is that not all the veins are continuous lines, which would suggest a lack of information about the pattern. With a better disparity map and maybe some interpolation, the veins could be enhanced in the future. After the inspection of the finger vein reconstructions, two test models were created to estimate the performance numerically. At first models were rotated such that the model
Fig. 16. The cross-correspondence score vs. the angle in the y-axis
would be in the middle of the x-axis. Since the view of cam2 is directly below the test object, the 3D reconstruction should also be in the middle. The prediction was that the flat model and the curved model had to be rotated 14.5◦and 12.3◦respectively. Figure14shows that this prediction was indeed quite accurate, given that the best angle was 14.4◦. A possible explanation is that the object may not have been located exactly above the camera. Figure16shows a slightly different outcome. The difference between the best angle (14◦) and the predicted angle (12.3◦) shows that the distance was apparently not measured accurately, which would result in a wrong angle prediction. Another possibility is that the model may not have been attached correctly with the pattern not centered above cam2. Considering the object was round, it cannot be expected to be perfectly oriented above cam2. For more accurate results, the measurements should have been done multiple times. However due to time constraints, these were not executed.
which would also imply the relatively large deviation of the dimensions. Another thing that can be said about the results of the second test model, is that the 3D model seems to have less of a curvature than the measurements of the real object would suggest. Perhaps the measurements are slightly off, but alternatively the disparity calculation was not accurate enough. Further research of the cause these problems should be done in the future. Comparing the results with other work such as [3], the point cloud presented in this paper, clearly shows the curvature of the finger, something that was clearly not noticeable in the other work. This could indicate that the method presented in this paper, could be of better assistance battling the orientation problem. During the development of the method, it was also experimented with comparing point clouds with fingers that were orientated differently. Unfortunately, due to the lack of time and resources, this could not be tested in full extend and should be investigated upon in further research.
VIII. CONCLUSION
This paper proposes a method to obtain three-dimensional vascular patterns of the finger using an existing device developed at the BPR chair at the University of Twente. This method uses standard approaches such as camera calibration and rectification but also implements original ways to ob-tain a three-dimensional structure of only the finger veins. The three-dimensional model is evaluated with both visual inspection and with the use of a flat and a round test object. The point cloud reconstructions showed that the presented method is a good first attempt at creating 3D models of the finger vein patterns. This research also showed that the change in viewing orientation induced by rectification can be corrected to some extend when the change in orientation is known. The method described in this paper shows that it is possible to create a 3D model with the curvature of the finger veins. From the results it can be concluded that the testing method was not optimal and could have had a small influence on the test results.
IX. RECOMMENDATIONS
A. Recommendations acquisition device
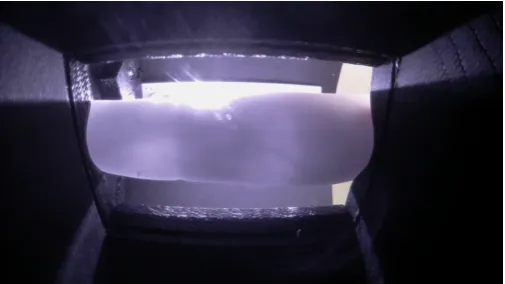
Considering this study was the first attempt at 3D-reconstruction of the finger veins with this setup, there are several points the device can be improved with. The major problem that was that the setup was unable to capture the finger from three angles without getting the image to experience overexposure (see appendix figure17) at the LED strip when the finger was placed in the default position. A simple improvement could be to move the light source closer to the finger. This could also be accompanied by the fact that at the moment the acquisition device was quite sensitive to external light sources (like the sun or lighting in a room). This is why, for this work, a paper cap was placed over the device. For another version of the device it should be considered to have a more durable solution. Another solution might be to use a black paint to reduce the reflective behaviour of the PCB of the LED strip. As
mentioned earlier, the original device used a IR-pass filter. The filter, although very successful in removing a lot of unwanted light, also became dirty. Preferably it should be placed closer to the cameras without the finger able to touch it. At the moment, the cameras use a default setting to obtain the images. It would be preferred if the camera settings could be optimized and fixed, such that every image has the same settings. The final goal would be to design an acquisition device that generates the 3D models in real time and automates the acquisition process.
B. Recommendations for the 3D reconstruction
First of all, the 3D-reconstruction process was not flawless. To start with, the calibration step could be optimized by using lower resolution images and the use of lossless file formats (such as PNG)for the images used for calibration. For the current calibration, lossy compression formats were used (JPEG), which could have introduced some calibration errors. Next, if smaller sized images were used, the 3D-reconstruction could be done faster since fewer pixels have to be processed. Moreover, the disparity algorithm currently implemented was relatively simple. Further improvements could include the comparison with the other direction and more advanced algorithms such as occlusion detection and uniqueness constraints. Furthermore, it is advisable to consider to move to a different coding environment such as C or C++. The current code is entirely written in Matlab, which has a lot of computer vision functions that could be used for 3D-reconstruction. The problem is however, that all these functions cannot be analyzed on how they operate. The result is that for specific purposes the functions have to be written manually, and can thus also be done in a different environment which could potentially increase the speed and performance. Finally, the ultimate goal is to be able to implement a finger vein recognition algorithm.
APPENDIX
[image:9.595.313.566.551.693.2]REFERENCES
[1] B. Ton, “Vascular pattern of the finger: Biometric of the future?” Master thesis, University of Twente, 2012.
[2] S. Rozendal, “Redesign of a finger vein scanner,” Bachelor thesis, University of Twente, 2018.
[3] Z. Ma, L. Fang, J. Duan, S. Xie, and Z. Wang, “Personal identification based on finger vein and contour point clouds matching,”2016 IEEE International Conference on Mechatronics and Automation, 2016. [4] D.Ai, J. Yang, J. Fan, Y. Zhao, X. Song, J. Shen, L. Shao, and
Y. Wang, “Augmented reality based real-time subcutaneous vein ima-ging system,”Biomedical Optics Express 7.7 (2016): 25652585., 2016, Available: https://www.ncbi.nlm.nih.gov/pmc/articles/PMC4948614/. [5] R. Radke,Computer Vision for Visual Effects. Cambridge University
Press, 2013, ch. 6. Matchmoving, pp. 214–215, [Online] Available: ftp://nozdr.ru/biblio/kolxo3/Cs/CsCg/Radke
[6] “Matlab Computer Vision System Toolbox,” Version R2018a, the MathWorks, Natick, MA, USA.
[7] Z. Zhang, “A flexible new technique for camera calibration,”IEEE Transactions on Pattern Analysis and Machine Intelligence (Volume: 22, Issue: 11, Nov 2000), 2000.
[8] B. Ton, “Miura et al. vein extraction me-thods,” [Online], Nov 2017, Available: https://nl.mathworks.com/matlabcentral/fileexchange/35716-miura-et-al-vein-extraction-methods.
[9] M. Sonka, V. Hlavac, and R. Boyle, Image Processing, Analy-sis, and Machine Vision. Cambridge University Press, 2015, ch. 5. Image pre-processing, pp. 118–119, [Online] Available: ftp://nozdr.ru/biblio/kolxo3/Cs/CsCg/Radke
[10] Mathworks, “Contrast-limited adaptive histogram equalization (CLA-HE) - MATLAB & Simulink - MathWorks Benelux.” [Online], Availa-ble: https://nl.mathworks.com/help/images/ref/adapthisteq.html. [11] ——, “2-D Gaussian filtering of images - MATLAB
& Simulink - MathWorks Benelux.” [Online], Available: https://nl.mathworks.com/help/images/ref/imgaussfilt.html.
[12] B. Ton, Vascular pattern of the finger: Biometric of the future?
University of Twente, 2012, ch. 6. Results, pp. 41–46.
[13] R. Radke,Computer Vision for Visual Effects. Cengage Learning, 2013, ch. 5. Dense Correspondence and Its Applications, pp. 168– 184.
[14] Digital Caliper BAHCO 1150D specifications.
![Fig. 1.The 3D finger vein scanner of the BPR group[2]](https://thumb-us.123doks.com/thumbv2/123dok_us/9669444.468804/1.595.316.566.149.267/fig-d-nger-vein-scanner-bpr-group.webp)
![Fig. 3.The 3D finger vein scanner of University of Electronic Scienceand Technology of China[3]](https://thumb-us.123doks.com/thumbv2/123dok_us/9669444.468804/2.595.314.563.52.143/fig-nger-scanner-university-electronic-scienceand-technology-china.webp)