The influence of Wi-Fi on the
operation of Bluetooth based
wireless sensor networks in the
Internet of Things
Jermain C. Horsman
B.Sc. Thesis
December 2015
Supervisors: Dr. ir. M.J. (Mark) Bentum D.J.G. (Niek) Moonen, M.Sc. G.S. (Stefan) van de Beek, M.Sc.
Telecommunication Engineering Group Faculty of Electrical Engineering, Mathematics and Computer Science University of Twente P.O. Box 217 7500 AE Enschede The Netherlands
The influence of Wi-Fi on the operation of
Bluetooth based wireless sensor networks
SUMMARY
TABLE OF CONTENTS
Introduction ... 5
Theory ... 6
Bluetooth ... 6
Wi-Fi ... 7
Experimental procedure ... 9
Demonstration model ... 9
Measurement setup ... 9
Data analysis methods ... 10
Results ... 11
Evaluation ... 17
Conclusions ... 17
Recommendations ... 17
Acknowledgements ... 18
References ... 19
Appendices ... 20
INTRODUCTION
THEORY
As stated in the introduction the influence of Wi-Fi on the operation of Bluetooth based wireless sensor networks is studied, so in the next sections both Wi-Fi and Bluetooth will be described and analysed.
Bluetooth
Bluetooth wireless technology is a short-range communications system and its key features are robustness, low power consumption, and low cost. Since Bluetooth Core version 4.0 there are two forms of Bluetooth wireless technology systems: Basic Rate (BR) and Low Energy (LE). LE was added with version 4.0 and it includes features to fabricate products that require lower current consumption, lower complexity and lower cost in comparison to BR. Which makes LE more useful in wireless sensor networks, because these wireless sensor networks are usually required to run a very long time on a small battery.
The Basic Rate system offers synchronous and asynchronous connections with data rates of 721.2 kb/s for Basic Rate and up to 2.1 Mb/s for Enhanced Data Rate (EDR). Whereas LE supports a bit rate of 1 Mb/s. Both forms of Bluetooth operate in the unlicensed 2.4 GHz ISM band. For LE this band is split into 40 channels with the centre frequencies located 2 MHz apart. The minimum 6 dB bandwidth for each channel is 500 kHz and the maximum allowed power at adjacent centre frequencies is -20 dB. The first Bluetooth channel has its centre frequency located at 2402 MHz. Three of the channels are used for advertising and 37 channels are used for data transmission, the advertising channels are located at the centre frequencies: 2402, 2426 and 2480 MHz. LE radio operation uses binary Gaussian Frequency Shift Keying (GFSK) as modulation. A binary one is represented by a positive frequency deviation and a binary zero is represented by a negative frequency deviation.
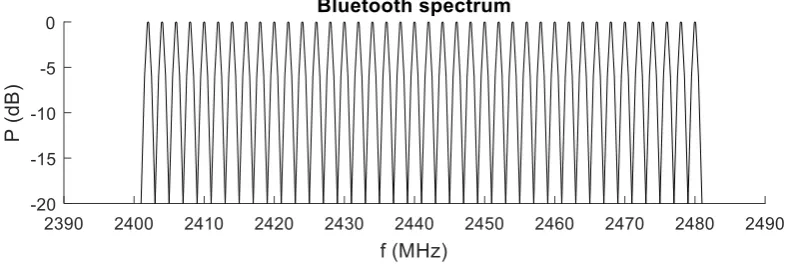
[image:6.595.98.492.501.633.2]All Bluetooth channels should be used equally likely (1), which is why a frequency hopping spread spectrum (FHSS) is used with the hopping pattern as a pseudo-random ordering of the data channels in the 2.4 GHz ISM band. With FHSS the signal is spread over the entire Bluetooth spectrum and just appears as an increase in background noise to narrowband receivers. Which results in a flat spectrum as sketched in Figure 1.
Figure 1: Sketch of expected theoretical Bluetooth spectrum.
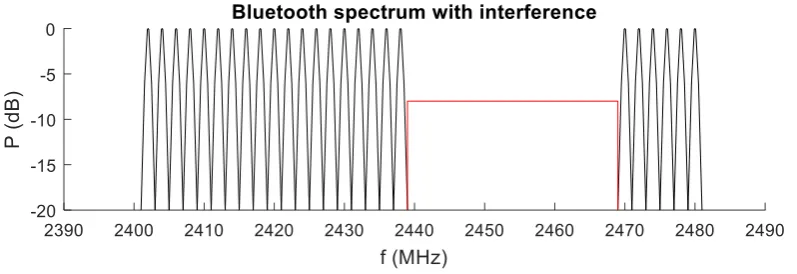
minimum number of used channels shall be two. With AFH the hopping pattern will only consist of channels that are classified as used (to be used by the Bluetooth connection), since channels that are classified as unused (not to be used by the Bluetooth connection) will be avoided. A Bluetooth device can take readings of channels and classify them, the master determines the hopping pattern, but the slave can report information about channel classifications to the master. A channel can be classified as unused, for example if it is already being used by other wireless sources which are transmitting. With AFH a possible spectrum would look like the sketch in Figure 2. (2)
Figure 2: Sketch of expected theoretical Bluetooth spectrum with interference from 2439 MHz to 2469 MHz (red).
Wi-Fi
Another widely used wireless communication system in the 2.4 GHz ISM band is Wi-Fi. The basis for wireless network products using Wi-Fi is IEEE 802.11. IEEE 802.11 is a set of Media Access Control (MAC) and physical layer (PHY) specifications for implementing a wireless local area network (WLAN). The latest published standard is 802.11-2012. Which includes the previous standard 802.11-2007 and amendments published between 2008 and 2011. Because it includes all previous standards and amendments, two different modulation techniques are defined. The first is direct sequence spread spectrum (DSSS) which provides a WLAN using a baseband modulation of differential binary or quadrature phase shift keying (DBPSK or DQPSK) and the second is orthogonal frequency division multiplexing (OFDM) using binary or quadrature phase shift keying (BPSK or QPSK) or using 16- or 64-quadrature amplitude modulation (16-QAM or 64-QAM). The OFDM systems are the most recent and allow for the highest data rates.
Figure 3: Spectrum mask for Wi-Fi channel 1 for both DSSS (red) and for OFDM (blue).
The spectral mask only gives the maximum allowed power levels whereas the typical signals will have lower power levels or a narrower bandwidth than the spectral mask. Though the spectral mask can be used to give an indication as to how many Wi-Fi routers it would take to occupy the entire Bluetooth bandwidth. This is illustrated in Figure 4 where the spectral masks of Wi-Fi channel 1, 5, 9 and 11 with OFDM modulation are displayed. Under the assumption that the routers would have equal power and fill the entire spectral mask, the entire Bluetooth band would be filled leaving no channel to be used for Bluetooth and thus preventing or disabling a Bluetooth connection.
[image:8.595.107.491.489.706.2]EXPERIMENTAL PROCEDURE
Demonstration model
To test the influence of Wi-Fi on the operation of Bluetooth based wireless sensor networks a demonstration model has to be made. The materials used to make the demonstration model used in this assignment are:
- Raspberry Pi 2 Model B V1.1
- Trust 18187 Bluetooth 4.0 USB adapter - Bluetooth wireless sensor ‘Abel’
Raspbian Wheezy, Kernel version 3.18, is installed on the Raspberry Pi. The Bluetooth USB adapter is plugged into one of the USB connections of the Raspberry Pi and Bluez 5.30 is installed on the Raspberry Pi. With the use of a tool called ‘gatttool’ it is possible for the Raspberry Pi to make a connection to the wireless sensor Abel. With this tool it is also possible to send and retrieve data from the Abel, and it is possible to set the notification handlers on the Abel so it will send a notification to the Raspberry Pi if e.g. the button is pressed or released.
Measurement setup
To do the measurements on this demonstration model there has to be additional equipment for the measurement setup, so the measurement setup will consist of:
- The previous mentioned demonstration model, consisting of a Raspberry Pi with Bluetooth USB adapter and Bluetooth wireless sensor Abel
- Wireless routers:
Netgear RangeMax Next Wireless-N router WNR834B v2 Linksys Wireless-N Broadband router WRT160N v3 LG G2
- Anritsu MS2712E Spectrum Master
On both the Netgear and Linksys routers DD-WRT firmware is installed, the LG G2 is an android based phone which can be set to act as a Wi-Fi hotspot and all these routers use the OFDM modulation technique.
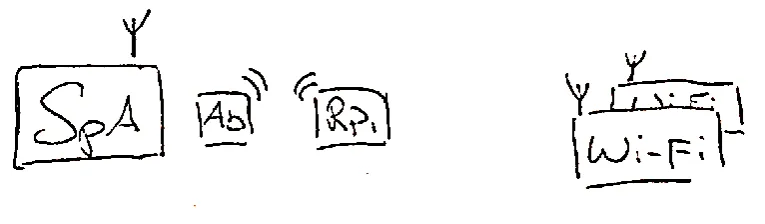
Figure 5: Sketch of the measurement setup consisting of a spectrum analyser (SpA), the wireless sensor Abel (Ab), the Raspberry Pi with Bluetooth adapter (RPi) and the Wi-Fi routers (Wi-Fi).
The first measurement will be done with all equipment turned off to measure the noise floor. Secondly the demonstration model with an active connection will be measured to determine the peak values of the Bluetooth spectrum. After this the first Wi-Fi router will be placed in such a way that its peak values as detected by the spectrum analyser will be below the peak values of the Bluetooth signal. With this setup the influence of one active Wi-Fi channel on the Bluetooth signal can be analysed.
The next step is to position the second Wi-Fi router the same way as the first and turn on both routers. If both routers are turned on the influence of two used Wi-Fi channels on the Bluetooth spectrum can be examined. After these measurements are done this step can be repeated for the third Wi-Fi router.
Data analysis methods
RESULTS
For the first measurement all equipment was turned off to examine the noise floor, the resulting spectrum is shown in black in Figure 6.
[image:11.595.108.487.266.507.2]For the second measurement a connection between the Raspberry Pi and Abel was made. During the measurement it proved quite difficult to capture the Bluetooth signal even if the button was pressed or data was send to the Abel, only some peaks were observed while sending this data. It is difficult to say whether or not the peaks that were detected came from the actual data which was send manually or from the connection updates between both Bluetooth devices. In the end it was decided to do the measurement with just the connection updates between both devices. So the spectrum analyser started a max-hold measurement for about 5 minutes and the resulting spectrum is displayed in blue in Figure 6.
Figure 6: Spectrum of the noise floor (black) and spectrum of the Bluetooth signal (blue).
From Figure 6 some observations can be made, first of all it can be seen that the noise floor is located at -80 dBm in the frequency range from 2400 MHz till 2475 MHz and -75 dBm from 2475 MHz till 2480 MHz.
Another thing that can be noted from Figure 6 is that the Bluetooth signal spreads across the entire spectrum, but it does not completely fill all channels. This is the result of the long time between the detection of different peaks. Since all channels should be used equally likely it can be assumed that over a longer time or with more frequently send detectable data peaks all channels in the band will fill up.
[image:12.595.107.488.223.460.2]For the next measurement the first router was turned on to Wi-Fi channel 1 while the Bluetooth connection was still active. The spectrum analyser did a max-hold measurement on the spectrum for about five minutes and the result is shown in Figure 7.
Figure 7: Spectrum of the noise floor (black) and spectrum consisting of Bluetooth and Wi-Fi channel 1 (blue).
The results shown in Figure 7 displays the band used by the router set to Wi-Fi channel 1 and the Bluetooth signal. The Wi-Fi signal power in this measurement is around -45 dBm, so by looking at the peaks above this line it can be seen that inside the Wi-Fi channel the gap between peaks is between 2404 MHz and 2416 MHz, resulting in a bandwidth of 12 MHz. The biggest gap outside the Wi-Fi frequency range is between 2459 MHz and 2467 MHz, which gives a bandwidth of only 8 MHz. Based on this observation it seems the AFH is avoiding the already used channels in the Wi-Fi frequency range. Figure 7 also shows the Bluetooth channels which are used inside the Wi-Fi channel are located in the side bands where the Wi-Fi signal has less power.
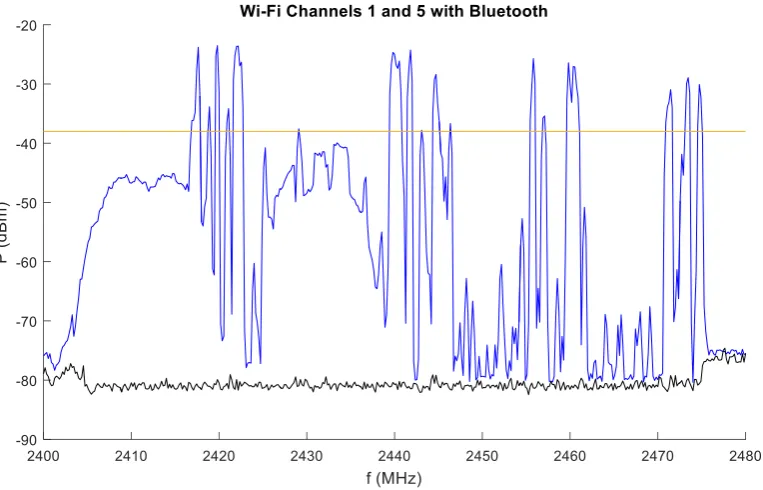
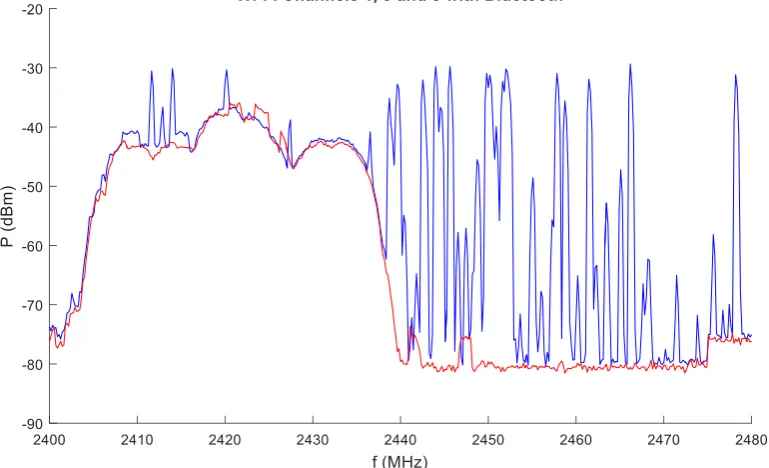
Figure 8: Spectrum of the noise floor (black) and spectrum consisting of Bluetooth and Wi-Fi channels 1 and 5 (blue).
From the spectrum of Figure 8 the frequency band used by the second router can be identified, though the spectrum is not as flat as the spectrum of the first router. It could be that this is caused due to some lower level Bluetooth peaks being present, though the shape of some of the peaks look wider compared to other Bluetooth peaks, so it could also be a disturbance in the Wi-Fi signal. So in this measurement the highest Wi-Fi power level is determined to be at -38 dBm. By examining the peaks above this level it can be seen that they are absent in the first 16 MHz of the spectrum and between 2423 MHz and 2439 MHz there is another 16 MHz gap for the high peaks in the frequency range of the Wi-Fi routers. In the other side of the spectrum the two biggest gaps are located between 2445 MHz and 2455 MHz and between 2461 MHz and 2471 MHz, thus having a bandwidth of 10 MHz. So based on this observation it seems the AFH is avoiding the Bluetooth channels inside the Wi-Fi channels during this measurement as well.
Figure 9: Spectrum of Wi-Fi channels 1 and 5 (blue) with the spectral masks (red).
Since the spectrum with two routers tuned to Wi-Fi channels 1 and 5 showed unused band between the routers the third router was set to Wi-Fi channel 3 to fill this band. With an active Bluetooth connection and after all three routers were turned on the spectrum analyser measured the spectrum again for about five minutes and the result is shown in Figure 10.
[image:14.595.106.489.467.701.2]From the spectrum of Figure 10 some observations can be made. First the spectrum of the router set to Wi-Fi channel 1 looks different compared to its spectrum during previous measurements show in Figure 7 and 8 and inside this channel some Bluetooth peaks can be detected, however the router set to Wi-Fi channel 5 shows a much more flat spectrum compared to its spectrum in Figure 8 and no Bluetooth peaks can be detected inside. Furthermore there is only one observable peak inside the frequency band of Wi-Fi channel 3 which is less compared to previous measurements. In this measurement most of the high peaks are located outside the frequency band used by the routers with a gap from 2466 MHz to 2478 MHz for a total of 12 MHz. Whereas the big gaps inside the frequency range of the Wi-Fi routers are the first 11 MHz up to 2412 MHz and a gap of 19 MHz between 2420 MHz and 2439 MHz. If the 10 dB bandwidth of the Wi-Fi routers is examined, which is located between 2405 MHz and 2438 MHz, resulting in a 33 MHz bandwidth, it can be seen that 3 peaks are present. If the remaining bandwidth inside the spectrum of Figure 10, a total of 47 MHz bandwidth, is examined 10 peaks can be detected. So the remaining bandwidth is about 1.4 times the 10 dB Wi-Fi bandwidth but there are more than 3 times as many detectable peaks. So the AFH still seems to be avoiding channels used by Wi-Fi most of the time, although it could be that due to a disturbance in the Wi-Fi signal of channel 1 this particular channel wasn’t avoided.
After this measurement the Bluetooth connection was terminated and both the Raspberry Pi and the Abel were turned off. This was done to measure the spectrum consisting only of the three routers, this spectrum is displayed in red in Figure 11.
[image:15.595.105.490.380.614.2]Figure 11: Spectrum consisting of Bluetooth and Wi-Fi channels 1, 3 and 5 (blue) and the spectrum of the Wi-Fi channels
1, 3 and 5 (red).
EVALUATION
Conclusions
From the results it can be seen that the Bluetooth connection uses channels outside the active Wi-Fi channels, since most of the peaks can be detected outside the bandwidth used by Wi-Fi and the biggest gaps occurred inside the Wi-Fi bandwidth. From this it can be concluded that the Bluetooth devices notice the used Wi-Fi channels and avoid the frequencies used by Wi-Fi most of the time. However in the sidebands of the Wi-Fi channels some Bluetooth peaks can be detected, meaning the Wi-Fi signal strength in these sidebands is not strong enough to completely prevent the Bluetooth connection from using channels inside a used Wi-Fi channel. Also some Bluetooth channels in the middle of the Wi-Fi channels seem to be used, which could be due to disturbance in the Wi-Fi signal.
Although the spectral masks of the Wi-Fi channel 1 and 5 span in theory the first 40 MHz, the first set of two routers did not fill this bandwidth entirely, leaving a band gap between both channels, which caused the Bluetooth connection to use channels in between both frequency bands. This is why the third router was tuned to Wi-Fi channel 3 instead of 9. As a result the combined bandwidth of 3 Wi-Fi routers was only the same as the theoretical bandwidth of two spectral masks. So the expectation, as stated in the theory, that the four Wi-Fi channels 1, 5, 9 and 13 with OFDM modulation together would span all Bluetooth channels is not correct in this case. To span the entire Bluetooth bandwidth the expectation is that besides these four channels also three routers tuned to the intermediate channels 3, 7 and 11 are needed, adding up to a total of 7 routers.
So with three routers set to cause interference between 2400 MHz and 2440 MHz, the first 40 MHz in the Bluetooth spectrum, the adaptive frequency hopping used channels which are located mostly outside this half of the Bluetooth spectrum. Since the AFH had more than two available Bluetooth channels the connection did not fail and remained functional.
Recommendations
In order to improve the measurements it would be recommended to use a spectrum analyser which can be operated from outside the anechoic chamber to prevent reflections from people inside during the measurements. Another improvement that can be made is the use of a demo which allows for a continuous data stream between both Bluetooth devices so the Bluetooth spectrum fill up more quickly and looks more like the expected theoretical spectrum.
Additionally since the Bluetooth connection did not fail once during any of these measurements the recommendations for future measurements are to use more routers to cause interference to all Bluetooth channels and examine whether this will prevent a Bluetooth connection. Based on the observations of this assignment, seven routers in total would be needed.
Also the power of the signals deserves to be studied more, in this assignment the power levels were taken practically to identify Bluetooth signals in the Wi-Fi frequency ranges. But this is one of the reasons that there were Bluetooth signals detected inside the Wi-Fi channels.
ACKNOWLEDGEMENTS
I would like to express my gratitude to my supervisor Niek Moonen for the useful comments, remarks and engagement throughout this bachelor thesis.
I would also want to thank Mark Bentum and Stefan van de Beek as a member of the examining committee.
Furthermore I would like to thank company Caveor for providing the Abel.
REFERENCES
1. The Federal Communications Commission. Electronic Code of Federal Regulations. [Online] December 3, 2015.
2. Bluetooth SIG Proprietary. Specifications of the Bluetooth System, Covered Core Package version 4.2. [Online] December 2, 2014.
APPENDICES
List of abbreviations
16-QAM - 16- quadrature amplitude modulation 64-QAM - 64-quadrature amplitude modulation AFH - Adaptive frequency hopping
BPSK - Binary phase shift keying BR - Basic rate
DBPSK - Differential binary phase shift keying DQPSK - Differential quadrature phase shift keying DSSS - Direct sequence spread spectrum
EDR - Enhanced data rate
FHSS - Frequency hopping spread spectrum GFSK - Gaussian frequency shift keying IoT - Internet of Things
LE - Low energy
MAC - Media Access Control
OFDM - Orthogonal frequency division multiplexing PHY - Physical layer