University of Warwick institutional repository: http://go.warwick.ac.uk/wrap
This paper is made available online in accordance with
publisher policies. Please scroll down to view the document
itself. Please refer to the repository record for this item and our
policy information available from the repository home page for
further information.
To see the final version of this paper please visit the publisher’s website.
Access to the published version may require a subscription.
Author(s): A. Aungwerojwit, B. T. Gänsicke, P. Rodríguez-Gil, H.-J.
Hagen, E. T. Harlaftis, C. Papadimitriou, H. Lehto, S. Araujo-Betancor,
U. Heber, R. E. Fried, D. Engels, and S. Katajainen
Article Title: HS 0139+0559, HS 0229+8016, HS 0506+7725, and HS
0642+5049: four new long-period cataclysmic variables
Year of publication: 2005
Link to published article:
http://dx.doi.org/10.1051/0004-6361:20042610
DOI: 10.1051/0004-6361:20042610
c
ESO 2005
Astrophysics
&
HS 0139+0559, HS 0229+8016, HS 0506+7725, and HS 0642+5049:
four new long-period cataclysmic variables
,
A. Aungwerojwit
1, B. T. Gänsicke
1, P. Rodríguez-Gil
1,2, H.-J. Hagen
3, E. T. Harlaftis
4, C. Papadimitriou
5,6,
H. Lehto
7,8, S. Araujo-Betancor
9, U. Heber
10, R. E. Fried
11, D. Engels
3, and S. Katajainen
81 Department of Physics, University of Warwick, Coventry CV4 7AL, UK
e-mail:A.Aungwerojwit@warwick.ac.uk
2 Instituto de Astrofísica de Canarias, 38200 La Laguna, Tenerife, Spain
3 Hamburger Sternwarte, Universität Hamburg, Gojenbergsweg 112, 21029 Hamburg, Germany
4 Institute of Space Applications and Remote Sensing, National Observatory of Athens, PO Box 20048, Athens 11810, Greece 5 Institute of Astronomy and Astrophysics, National Observatory of Athens, PO Box 20048, Athens 11810, Greece
6 Department of Astrophysics, Astronomy and Mechanics, University of Athens, 157 84 Zografos, Athens, Greece 7 Department of Physics, 20014 University of Turku, Finland
8 Tuorla Observatory, University of Turku, 21500 Piikkiö, Finland
9 Space Telescope Science Institute, 3700 San Martin Drive, Baltimore, MD21218, USA 10 Astronomisches Institut der Universität Erlangen, Germany
11 Braeside Observatory, PO Box906, Flagstaff, AZ 86002, USA
Received 23 December 2004/Accepted 3 July 2005
ABSTRACT
We present time-resolved optical spectroscopy and photometry of four relatively bright (V ∼14.0−15.5) long-period cataclysmic variables (CVs) discovered in the Hamburg Quasar Survey: HS 0139+0559, HS 0229+8016, HS 0506+7725, and HS 0642+5049. Their respective orbital periods, 243.69±0.49 min, 232.550±0.049 min, 212.7±0.2 min, and 225.90±0.23 min are determined from radial velocity and photometric variability studies. HS 0506+7725 is characterised by strong Balmer and He emission lines, short-period (∼10−20 min) flickering, and weak X-ray emission in the ROSAT All Sky Survey. The detection of a deep low state (B18.5) identifies HS 0506+7725 as a member of the VY Scl stars. HS 0139+0559, HS 0229+8016, and HS 0642+5049 display thick-disc like spectra and no or only weak flickering activity. HS 0139+0559 and HS 0229+8016 exhibit clean quasi-sinusoidal radial velocity variations of their emission lines but no or very little orbital photometric variability. In contrast, we detect no radial velocity variation in HS 0642+5049 but a noticeable orbital brightness variation. We identify all three systems either as UX UMa-type novalike variables or as Z Cam-type dwarf novae. Our identification of these four new systems underlines that the currently known sample of CVs is rather incomplete even for bright objects. The four new systems add to the clustering of orbital periods in the 3−4 h range found in the sample of HQS selected CVs, and we discuss the large incidence of magnetic CVs and VY Scl/SW Sex stars found in this period range among the known population of CVs.
Key words.stars: binaries: close – stars: individual: HS 0139+0559 – stars: individual: HS 0229+8016 – stars: dwarf novae – stars: individual: HS 0506+7725 – stars: individual: HS 0642+5049 – stars: novae, cataclysmic variables
1. Introduction
Standard models for the population of cataclysmic variables (CVs) predict that the vast majority of all CVs should have
Based on observations obtained at the German-Spanish
Astronomical Center, Calar Alto, operated by the Max-Planck-Institut für Astronomie, Heidelberg, jointly with the Spanish National Commission for Astronomy, on observations made at the 1.2 m telescope, located at Kryoneri Korinthias, and owned by the National Observatory of Athens, Greece, and on observations made with the OGS telescope, operated on the island of Tenerife by the European Space Agency, in the Spanish Observatorio del Teide of the IAC.
Table 1 is only available in electronic form at
http://www.edpsciences.org
short orbital periods, Porb < 2 h (e.g. Kolb 1993; Howell et al. 1997), and a space density of 2×10⁻⁵−2×10⁻⁴ pc−3 (Ritter & Burkert 1986; de Kool 1992; Politano 1996). These predictions contrast with the properties of the observed pop-ulation of galactic CVs, with an estimated space density of ∼6×10⁻⁶pc−3(Ringwald 1996; Araujo-Betancor et al. 2005b) and an apparent lack of short-period systems. Possible reasons for these discrepancies are uncertainties in the theory of CV evolution (e.g. King 1988; Schenker & King 2002; Andronov et al. 2003; Barker & Kolb 2003; Taam et al. 2003), but also observational selection effects in the known CV population (e.g Downes 1986; Ringwald 1996; Gänsicke 2005).
About 75% of all known CVs have been discovered either because of their variability or because of their X-ray emission,
with a strong dominance of dwarf novae and classical no-vae in the first group and magnetic CVs in the second group (Gänsicke 2005). It is therefore clear that CVs characterised by infrequent outbursts and/or low-amplitude variability, as well as lacking strong X-ray emission, will be underrepresented in the currently known CV population. Hypothetically, such ob-jects could make up for the large number of predicted short-period CVs with low mass transfer rates.
We are currently carrying out a spectroscopic survey of CV candidates with the aim to produce a homogeneously selected sample of CVs that overcomes the observational biases men-tioned above. In this paper, we describe the status of our sur-vey, the identification of four new CVs with periods close to 4 h, and discuss the nature of CVs in the 3−4 h period range.
2. CVs in the Hamburg Quasar Survey
The primary purpose of our project to identify new CVs in the Hamburg Quasar Survey (HQS) is to establish a large homo-geneously selected sample of systems that overcomes previ-ous observational biases and that can subsequently be used to test our understanding of CV evolution (Gänsicke et al. 2002b). The HQS, an objective-prism survey, was carried out with the 0.8 m Schmidt telescope at Calar Alto Observatory to search for bright quasars in the northern sky at high galactic lattitudes,
δ >0◦and|b|>20◦, covering≈13 600 deg2, with a dynamic range of 13<∼B<∼18.5 (Hagen et al. 1995). The photographic plates cover a spectral range of∼3400−5400 Å with a resolu-tion of∼45 Å at Hβ.
Our CV candidate selection made use of a property that has never been systematically exploited before: the spectroscopic hallmark of CVs, i.e. the presence of noticeable emission lines in most CVs. The CV candidate selection was carried out by visually inspecting 48 708 HQS prism spectra for the presence of Balmer emission lines. In order to test the efficiency of this method, we applied the same procedure to the subset of 84 pre-viously known CVs (Downes et al. 2001, as of July 2001) that are contained in the HQS spectral data base. We positively re-covered90% of the known short-period (Porb<2 h) CVs, in-cluding prominent dwarf novae such as SW UMa or T Leo (the latter one has a rather long outburst cycle of∼420 d), as well as magnetic CVs, such as AN UMa or ST LMi. The fraction of recovered systems drops to40% for long-period systems, with the largest fraction of missed identifications being nova-like variables with weak or no Balmer emission lines. In total, 62% of the previously known CVs with an HQS prism spec-trum were positively identified by our selection method. We concluded from this test that the HQS should be very efficient in finding CVs below the period gap, as long as they have sim-ilar spectroscopic properties to the previously known systems, i.e. Balmer emission lines with equivalent widths>10 Å in Hβ. The decrease in detection efficiency for long-period systems has been compensated to some extent by follow-up programs investigating hot stars in the HQS, delivering a number of new CVs with weak emission lines (Heber et al. 1991).
In total, 53 new CVs were identified within this project, and substantial observational effort was invested in determin-ing the properties of these systems. To date, 42 HQS CVs have
had their orbital period measured. Despite its good sensitivity for short-period CVs, only a small number of new short-period CVs have been found, and those that have been found fully con-firm the expected properties: low-amplitude variability and/or long outburst recurrence times, e.g. KV Dra (HS 1449+6415, Nogami et al. 2000), HS 2331+3905 (Araujo-Betancor et al. 2005a), DW Cnc (HS 0756+1624, Rodríguez-Gil et al. 2004a), or HS 2219+1824 (Rodríguez-Gil et al. 2005a). The ma-jority of the newly identified systems have orbital periods above the 2−3 h period gap, including rarely outbursting dwarf novae such as GY Cnc (HS 0907+1902, Gänsicke et al. 2000) or RX J0944.5+0357 (HS0941+0411, Mennickent et al. 2002); magnetic CVs with relatively weak X-ray emission, such as 1RXS J062518.2+733433 (HS0618+7336, Araujo-Betancor et al. 2003), RX J1554.2+2721 (HS 1552+2730, Thorstensen & Fenton 2002; Gänsicke et al. 2004b), and HS 0943+1404 (Rodríguez-Gil et al. 2005b); and half a dozen new SW Sextantis stars (Gänsicke et al. 2002c; Szkody et al. 2001; Rodríguez-Gil et al. 2004b; Rodríguez-Gil 2005).
While a full discussion of the implications that our search for CVs in the HQS has for our understanding of the galac-tic CV population has to await characterisation of the full HQS CV sample, an important preliminary statement that will not substantially change is: there is no large population of nearby short-period CVs that resemble the known template sys-tems. Phrased differently, if the large population of short period CVs predicted by theory exists, the majority of these systems must look different from the known short-period systems, i.e. have weak emission lines and/or substantially redder continua. Interestingly, the Sloan Digital Sky Survey (SDSS) is discov-ering a number of CVs with a steep Balmer decrement, in which the white dwarf dominates the optical emission, a clear sign of low mass transfer rates (Szkody et al. 2005, and refer-ences therein). However, most of these systems are very faint,
g19−20, implying that they are distant (d>100 pc) and not intrinsically numerous anywhere near the numbers predicted by theory.
An unexpected finding of our search for CVs in the HQS has been the identification of a large number of systems with orbital periods in the range 3−4 h. Here, we report the discov-ery of four additional CVs in that period range, HS 0139+0559, HS 0229+8016, HS 0506+7725, and HS 0642+5049. Despite being close in orbital period, these systems differ dramatically in their observed characteristic, and we discuss in detail the properties of the known CVs in the 3−4 h period range.
3. Observations and data reduction
3.1. Spectroscopy
HS0139+0559
N
E HS0229+8016 C1
N
E HS0506+7725
C2
N
E HS0642+5049
C3
[image:4.595.33.538.80.211.2]N E
[image:4.595.295.530.266.440.2]Fig. 1. 10×10finding charts for HS 0139+0559, HS 0229+8016, HS 0506+7725, and HS 0642+5049 obtained from the Digitized Sky Survey. The J2000 coordinates of the CVs are (α =01h41m40.0s,δ = +06◦1436.8), (α =02h35m58.3s,δ = +80◦2944.0), (α =05h13m36.4s, δ= +77◦2842.1), and (α=06h46m19.60s,δ= +50◦4548.0), respectively.
Fig. 2. Identification spectrum of HS 0139+0559 obtained at the Calar Alto 3.5 m telescope on January 22, 1989.
of ∼3500 km s−1. The cores of Hβ and Hγ broad absorp-tions show weak emission lines. No HeIIλ4686 is observed. Overall, the spectrum resembles that of a high-mass transfer rate accretion disc seen at a moderately low inclination, e.g. a dwarf nova in outburst or a novalike variable.
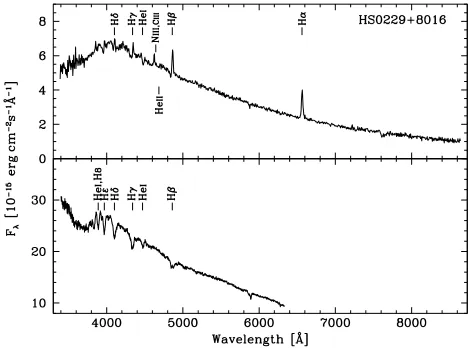
[image:4.595.40.268.266.440.2]HS 0229+8016 (Fig. 1) was first spectroscopically ob-served at the Calar Alto 2.2 m telescope on August 8, 1992, us-ing the Boller & Chivens spectrograph. The spectrum (Fig. 3, top panel) shows a blue continuum with the Balmer jump in emission, superimposed by moderately strong Balmer emis-sion lines. The higher Balmer line profiles show evidence of a P-Cygni like structure with blue absorption wings increasing in strength for the higher members of the series. HeIλ4471 is observed in absorption, and an emission line near 4630 Å is de-tected, which we tentatively identify as the N/C Bowen blend emission. Rather unusual is, however, the fact that HeIIλ4686 is not detected in emission along with the Bowen blend. HS 0229+8016 was observed again at the Calar Alto 2.2 m telescope on October 5, 1998, using the Calar Alto Faint Object Spectrograph (CAFOS), on this occasion looking nearly identi-cal to HS 0139+8016 (Fig. 3, bottom panel). The spectral char-acteristics and the variability clearly identify HS 0229+8016 as a CV.
Fig. 3. Identification spectra of HS 0229+8016 obtained at the Calar Alto 2.2 m telescope on August 8, 1992 (top panel) and February 2, 1998 (bottom panel).
Fig. 4. Identification spectrum of HS 0506+7725 obtained at the Calar Alto 2.2 m telescope on February 2, 1998.
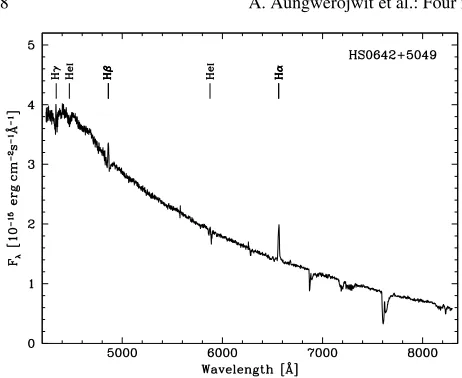
[image:4.595.299.528.492.665.2]Fig. 5. Average of the 17 CAFOS G-100 spectra of HS 0642+5049 obtained at the Calar Alto 2.2 m telescope on October 24, 2004.
The λλ4630−4650 N/C Bowen blend and the HeIIλ4686 emission lines are also detected. The strength of these high-ionisation lines is typical of novalike variables, magnetic CVs, or nova remnants.
HS 0642+5049 (Fig. 1) was spectroscopically identified as a CV on March 7, 1999, with CAFOS at the Calar Alto 2.2 m telescope. The spectrum of HS 0642+5049 (Fig. 5) contains a blue continuum with moderately strong Hαemission. The Hβ and Hγemission is embedded in broad absorption troughs, and weak HeI λ4471 absorption is also detected. No HeIIλ4686 andλλ4630−4650 N/C Bowen blend are detected.
In order to determine the orbital periods of HS 0139+0559, HS 0229+8016, HS 0506+7725, and HS 0642+5049, we ob-tained time-resolved spectroscopy at Calar Alto Observatory and Roche de los Muchachos Observatory throughout the pe-riod October 2002 to October 2004 (Table 1). At the Calar Alto 2.2 m telescope, we used the CAFOS spectrograph equipped with the G-100 grating and a 2k×2k pixel SITe CCD. This setup, in conjunction with a 1.2slit, provided a spectral reso-lution of∼4.1 Å (full width at half maximum, FWHM) cover-ing the range 4240−8300 Å. We used the double-armed TWIN spectrograph at the Calar Alto 3.5 m telescope equipped with the T05 grating in the blue and the T06 grating in the red, providing a spectral resolution of ∼1.2 Å (FWHM) in the ranges λλ3810−4940 andλλ6440−7510. At the 2.5 m Isaac Newton Telescope (INT), we used the Intermediate Dispersion Spectrograph (IDS) equipped with the R632V grating and the 2k×4k pixel EEV10a detector. Using a slit width of 1.5this setup provided a useful wavelength of∼4400−6800 Å and a spectral resolution of∼2.3 Å. Arc calibration spectra were in-terleaved with the target observations every∼40 min.
In total, we obtained 55 spectra of HS 0139+0559, 74 spec-tra of HS 0229+8016, 86 specspec-tra of HS 0506+7725, and 87 spectra of HS 0642+5049 (Table 1). Reduction of the follow-up spectroscopy consisting of bias and flat-field correc-tions and optimal extraction (Horne 1986) was carried out in
IRAF.1The wavelength calibration of the extracted spectra was 1 IRAF is distributed by the National Optical Astronomy
Observatories.
performed inMOLLY. The dispersion relation was obtained by fitting a low-order polynomial to the arc lines, with the rms less than one tenth of the dispersion in all cases. The flexure of the telescope was accounted for by interpolating between the two arc exposures bracketing the target spectra.
The time-resolved spectra of HS 0139+0559 and HS 0229+8016 are similar to the identification spectra shown in Figs. 2 and 3 (bottom panel), with Hβ and Hγ in absorption for most of the time and occasionally showing signs of emission cores. However, the G-100 spectra cover Hαas well, which is observed in emission throughout, with low equivalent widths in the range 3−6 Å. The time-resolved spectra of HS 0506+7725 are very similar to the identification spectrum shown in Fig. 4, with the difference of having no HeIIλ4686 emission. The Hα emission line has an average equivalent width of ∼15 Å. The time-resolved spectra of HS 0642+5049 show Hαin emission with an average equiva-lent width of∼5 Å, and weak Hβand Hγemission embedded in broad absorption lines (Fig. 5).
3.2. Photometry
The spectroscopy of the four new cataclysmic variables was supplemented by differential CCD photometry obtained at six different telescopes (Table 1). Brief descriptions of the instru-mentation used and the data reduction techniques are given below.
Braeside Observatory. Differential B and R photometry of HS 0139+0559 was obtained in December 1999/January 2000 at Braeside Observatory using the 0.41 m reflector together with an SITe 512×512 pixel CCD camera. The raw images were bias-subtracted, dark current-subtracted, and flat-fielded in a standard manner.
Kryoneri Observatory. We obtained differential R-band pho-tometry of HS 0229+8016 (September 19 and 20, 2002) and HS 0506+7725 (October 8, 2002) at Kryoneri Observatory us-ing the 1.2 m telescope equipped with a Photometrics SI-502 516×516 pixel CCD camera. The data were reduced using the pipeline described in Gänsicke et al. (2004a), which pre-processes the raw images inMIDASand extracts aperture pho-tometry using theSextractor(Bertin & Arnouts 1996). The instrumental magnitudes of HS 0229+8016 were converted into apparent magnitudes using the comparison star labelled “C1” in Fig. 1 (USNO-A2.0 1650-00512682, R = 12.6). We found a mean magnitude of R 14.3 during both nights. The apparent magnitudes of HS 0506+7725 were computed us-ing the comparison star “C2” (USNO-A2.0 1650-00942250, R=13.1), and an average magnitude of R15.2 was found.
2004). The reduction of the observations was carried out in the same way as described for the Kryoneri data. Using the same comparison stars as above, we found the mean magnitudes of HS 0229+8016 and HS 0506+7725 to be14.3 and15.8, re-spectively. The apparent magnitudes of HS 0642+5049 were extracted using the comparison star “C3” in Fig. 1 (USNO-A2.0 1350-06806656, R=12.4), and gave a mean magnitude of15.5.
Observatorio del Teide. At the Observatorio del Teide on Tenerife, we used the 1 m Optical Ground Station (OGS) and the 0.82 m IAC80 telescopes to obtain CCD photome-try of HS 0506+7725 and HS 0642+5049. The telescopes were equipped with Thomson 1k× 1k pixel CCD cameras. On November 15, 2003, the OGS was used to obtain differential photometry of HS 0506+7225 in white light. The data were taken using 2×2 binning and windowing to improve the time resolution. The images were bias and flat-field corrected and aligned withinIRAF. Instrumental magnitudes of the CV and the comparison star “C2” were then extracted using the point spread function (PSF) photometry tasks package withinIRAF. We found the mean magnitude of HS 0506+7725 during that night to be 14.6. On December 1, 6, 7, and 8, 2004, we used the IAC80 telescope to obtain filterless photometry of HS 0642+5049. In order to achieve a high time resolution, win-dowing and binning 2×2 were applied. The data were reduced usingMIDASin the same manner as described for the Kryoneri run. The apparent magnitudes were extracted using the com-parison star “C3”, resulting in a mean magnitude of15.3.
Calar Alto Observatory. During January 2003 and October 2004, we used CAFOS with the SITe 2k×2k pixel CCD cam-era on the 2.2 m telescope to obtain filterless differential pho-tometry of HS 0506+7725 and HS 0642+5049 when the atmo-spheric conditions were too poor for spectroscopy. Only a small part of the CCD was read out in order to improve the time res-olution. The data were reduced in an analogous fashion to the one described for the Kryoneri observations above. The mean magnitudes of HS 0506+7725 and HS 0642+5049 were found to be14.9 and15.6, respectively.
[image:6.595.299.527.82.263.2]Light curve morphology. The light curves of HS 0139+0559 (Fig. 6) and HS 0229+8016 (Fig. 7) display very little vari-ability on nightly time scales, with amplitudes <∼0.02 mag and∼0.05 mag, respectively. In the case of HS 0229+8016, a low-amplitude modulation with a period of ∼4 h is consistently detected during the two longest observations. HS 0506+7725 exhibits short-period variability with an am-plitude of∼0.2−0.4 mag, which appear to be quasi-periodic oscillations on time scales of ∼10−20 min (Fig. 8). No clearly repeating variation is detected on time scales of several hours (i.e. a putative orbital modulation). The light curves of HS 0642+5049 from the IAC80 (Fig. 9) show modulation with a period of∼3.5 h, which we interpret as the orbital period of the system. No substantial flickering activity is detected.
Fig. 6. Differential CCD R-band (top panel) and B-band (bottom
panel) photometry of HS 0139+0559 obtained at the Braeside obser-vatory.
Fig. 7. Sample light curves of HS 0229+8016. Top panel: R-band data obtained at the Kryoneri observatory. Bottom panel: filterless data ob-tained at the Tuorla observatory.
[image:6.595.299.527.324.507.2]Table 2. Sine fits to the Hαemission line radial velocities. The methods employed were a convolution with a single Gaussian (SG) or Schneider & Young’s (1980) double-Gaussian prescription (DG).
Object Method FWHM/Sep. (km s−1) T
0 Period (days) K (km s−1) γ(km s−1)
HS 0139+0559 SG 600 2452998.985±0.013 0.16923±0.00034 84.4±4.8 18.4±3.5 HS 0229+8016 SG 600 2452992.457±0.006 0.161493±0.000034 179.0±5.2 35.5±3.5 HS 0506+7725 DG 700/1500 2452990.679±0.022 0.14770±0.00014 42.6±4.4 −66.7±3.0
[image:7.595.73.330.121.375.2]Fig. 8. Sample light curves of HS 0506+7725. Top panel: R-band data obtained at the Kryoneri observatory. Bottom panel: filterless data ob-tained at the OGS telescope.
Fig. 9. Sample filterless light curves of HS 0642+5049 obtained at the IAC80 telescope.
4. Analysis
4.1. HS 0139+0559
In order to determine the orbital period of HS 0139+0559 we measured the radial velocity variations of Hα by convolving the observed line profiles with a single Gaussion of FWHM= 600 km s−1. The spectra were continuum-normalised prior to this analysis. A Scargle (1982) period analysis of the radial velocity measurements was performed using the MIDAS/TSA
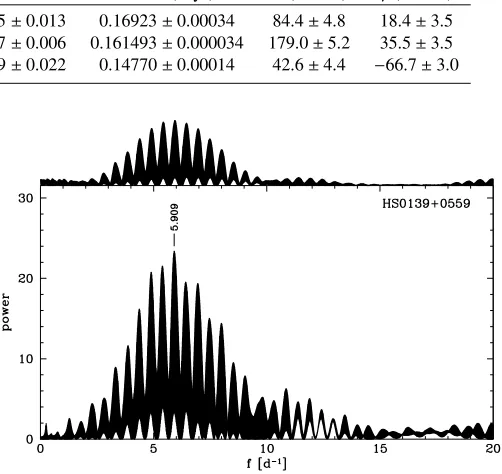
context. The resulting periodogram (Fig. 10) shows a strong signal at 5.909±0.012 d−1 surrounded by one-day aliases,
Fig. 10. The Scargle periodogram of the radial velocities of
HS 0139+0559 measured from the Hα emission line. The peri-odogram from a set of fake radial velocities is shown in the top panel.
where the error is determined from fitting a sine wave to the radial velocity variation (see Table 2 for the full fit parame-ter). In order to test the significance of the detected signal, we created a set of fake radial velocities by evaluating a sine func-tion with a frequency of 5.909 d−1 at the exact times of the observed spectroscopic data. The amplitude of the sine wave was adjusted to reflect the observed radial velocity amplitude, and the fake radial velocity measurements were randomly off -set from the computed sine wave using the observed errors. The periodogram of the fake data reproduces the alias struc-ture of the periodogram computed from the observations very well. We conclude that the orbital period of HS 0139+0559 is Porb = 243.69±0.49 min. Folding the radial velocity mea-surements over that period results in a quasi-sinusoidal radial velocity curve with an amplitude of 84.4±4.8 km s−1(Fig. 14, top panel).
For completeness, we also used the Braeside B and R band photometry for a period analysis. As suggested by the flat light curve (Fig. 6), no significant signal is detected in the Scargle periodogram.
4.2. HS 0229+8016
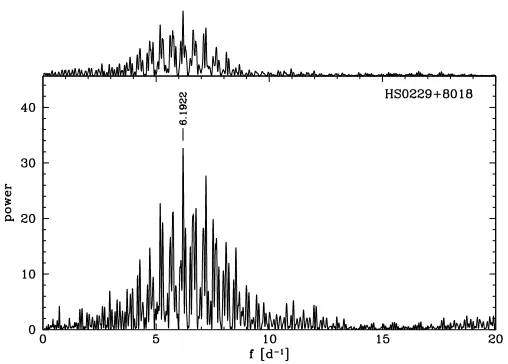
[image:7.595.317.568.134.371.2] [image:7.595.66.294.423.598.2]Fig. 11. The Scargle periodogram of the radial velocities of HS 0229+8016 measured from the Hα emission line. The peri-odogram from a set of fake radial velocities is shown in the top panel.
computed from a sine fit to the radial velocity data (Table 2), and a fake data set computed using this frequency repro-duces the overall alias structure well. We conclude that the most likely value for the orbital period of HS 0229+0559 is Porb =232.550±0.049 min. The phase-folded radial velocity curve shows quasi-sinusoidal modulation with an amplitude of 179.0±5.2 km s−1(Table 2).
Scargle periodograms computed from the two longest pho-tometry runs on HS 0229+0559 are dominated by a broad sig-nal near 5.2 d−1(Kryoneri data) and 6.2 d−1(Tuorla), which are consistent with the spectroscopic period or its one-day alias. While our photometric data is not sufficient to improve the pe-riod determination of HS 0229+0559, it suggests that the or-bital period of HS 0229+0559 can be refined by a sequence of sufficiently long photometric time-series.
4.3. HS 0506+7725
Our initial analysis of the HS 0506+7725 Hαradial velocity variation was carried out by applying a single-Gaussian con-volution on the continuum-normalised line profiles. However, the Scargle periodogram computed from the measured radial velocity variations turned out to be dominated by a variety of signals in the range ∼1−5 d−1, none of which resulted in a plausible phase-folded radial velocity curve. In a second at-tempt, we applied the double Gaussian method of Schneider & Young (1980), using a Gaussian FWHM=700 km s−1and a separation of 1500 km s−1to measure the radial velocity varia-tion of the line wings. The Scargle periodogram resulting from these radial velocity measurements includes several peaks in the range 5−9 d−1 (Fig. 12). The strongest signal is found at 6.7706±0.0065 d−1, which we identify as the likely orbital period of HS 0506+7725, Porb 212.7±0.2 min, where the error is determined from a sine fit to the radial velocity data (Table 2). The Scargle periodogram computed from a fake data set results in a much cleaner periodogram than the one ob-tained from the observed data, suggesting that the line wings are affected by additional velocity contributions apart from the
Fig. 12. The Scargle periodogram of the radial velocities of
HS 0506+7725 measured from the Hαemission line by using the dou-ble Gaussian method. The periodogram from a set of fake radial ve-locities is shown in the top panel.
orbital motion. The Hαradial velocities folded over the orbital period (Fig. 14) display a low amplitude of 42.6±4.4 km s−1 and a relatively large amount of scatter, again suggesting that the orbital motion measured from the line wings is contami-nated by another velocity component.
Our time-series analysis of the photometry of HS 0506+7725 did not lead to the detection of any sig-nificant signal, either at long (orbital) or at short (putative white dwarf spin) frequencies, making the observed short-term variability (Fig. 8) a nice example of non-coherent CV flickering.
4.4. HS 0642+5049
The 87 available spectra of HS 0642+5049 were subjected to radial velocity studies as outlined above, both using the single-Gaussian and double-Gaussion convolution techniques. None of the resulting Scargle periodograms contained any significant signal. Inspecting trailed spectra assembled from our data, we concluded that HS 0642+5049 does not show any radial veloc-ity variation at our spectral resolution.
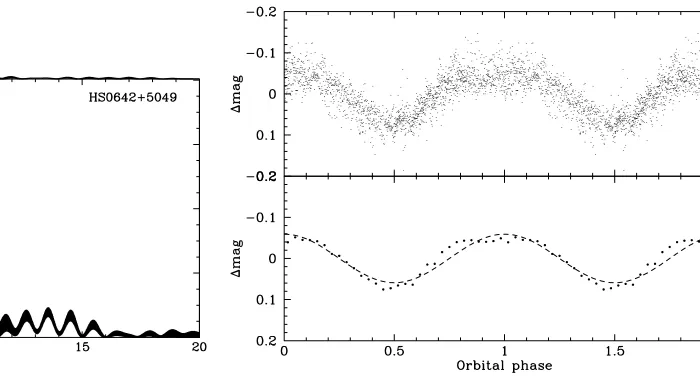
[image:8.595.287.536.90.263.2]Fig. 13. The Scargle periodogram of HS 0642+5049 computed from the three longest nights of differential photometry obtained at the Calar Alto (October 25, 2004) and the IAC80 (December 8 and 9, 2004). The periodogram from a fake data set assuming a period of 225.90 min is shown in the top panel.
Orbital phase
Fig. 14. Hα radial velocities of HS 0139+0559 (top panel),
HS 0229+8016 (middle panel), and HS 0506+7725 (bottom panel) folded on the period of 243.69 min, 232.550 min, and 212.7 min, respectively. The dashed lines are the best sine fits to the folded ve-locities.
Figure 15 shows the CAFOS and the IAC80 photometry folded on 225.90 min and averaged into 30 phase bins, which reflects the morphology of the individual light curves (Fig. 9).
5. Discussion
5.1. The inventory of the 3
−
4 h orbital period range [image:9.595.203.553.83.272.2]The primary aim of our search for CVs in the HQS is to establish the orbital periods and CV subtypes for a large
Fig. 15. HS 0642+5049 photometric data from the CAFOS (October
9, 2004) and the IAC80 (December 8 and 9, 2004) folded on Porb =
225.90 min (top panel). The average light curve, binned into 30 phase, is shown in the bottom panel along with a sine fit (dashed line).
sample of CVs that were selected in a homogeneous way based on their spectroscopic properties. The properties of this sample will then be compared with the predictions of CV evolution theory. Here, we report the spectroscopic iden-tification and detailed follow-up studies of HS 0139+0559, HS 0229+8016, HS 0506+7725, and HS 0642+5049, which have the orbital periods of 243.69 min, 232.550 min, 212.7 min, and 225.90 min, respectively. This follows the trend noticed by Gänsicke et al. (2002b) and, more recently, by Gänsicke (2004) and Rodríguez-Gil (2005) that the majority of the new CVs identified in the HQS have orbital periods above the pe-riod gap and the bulk of them are concentrated in the 3−4 h orbital period range. Currently, orbital periods have been de-termined for 42 systems out of a total of 53 new HQS CVs, and Fig. 16 compares the period distribution of these new HQS CVs with the period distribution of the CVs from the Ritter & Kolb catalogue (2003, V7.4). Even though the follow-up of the new HQS CVs is not yet complete, it is already now clear that our survey did not identify the large number of short-period CVs predicted by the population models (e.g. Kolb 1993; Howell et al. 1997), even though our selection method (=detection of Balmer emission lines) is best suited for the identification of low mass transfer systems that might be incon-spicuous in other ways (variability, X-rays), such as the short-period dwarf novae HS 1449+6415 (Nogami et al. 2000) and HS 2219+1824 (Rodríguez-Gil et al. 2005a), or the ultra-short period HS 2331+3905, which might be a WZ Sge-type dwarf novae with extremely long outburst recurrence times (Araujo-Betancor et al. 2005a). The (somewhat preliminary) conclusion is that, if a large number of short-period CVs does indeed exist, they must look different from the well-known examples such as WZ Sge.
[image:9.595.66.299.344.574.2]Table 3. Comparison of the observational characteristics of the four new CVs. The (non)detection of X-ray emission refers to the ROSAT All
Sky Survey (Voges et al. 2000). The CV subtypes are abbreviated as UX=UX UMa type novalike variable, ZC=Z Cam type dwarf nova, VY=VY Scl star.
Object Porb Radial velocity Photometric variability X-ray type
[min] variation Orbital Flickering Long-term
[image:10.595.36.270.225.368.2]HS 0139+0559 243.7 clean, moderate amplitude none none none no UX or ZC HS 0229+8016 232.6 clean, large amplitude very low amplitude none ∼1.3 mag no UX or ZC HS 0506+7725 212.7 scatter, low amplitude not obvious large amplitude ∼3 mag low state yes VY HS 0642+5049 225.9 very low amplitude moderate amplitude low amplitude none maybe UX or ZC
Fig. 16. The period distribution of 42 new CVs discovered in the HQS
(left panel) and of all known CVs (right panel, from Ritter & Kolb 2003, V7.4). The 2−3 h period gap is shaded in gray.
Fig. 17. The period distribution of the individual CV subtypes in the
3−4 h period range. From top to bottom: polars (am), intermediate polars (ip), VY Scl and SW Sex stars (vy), novalike variables and nova remnants that are neither VY Scl nor SW Sex stars (nl), U Gem type dwarf novae (ug), Z Cam type dwarf novae (zc), SU UMa type dwarf novae (su), and systems with undetermined CV subtype (xx).
new CVs presented in this paper. The majority of these new long-period CVs are weak or no X-ray emitters, and they display little long-term variability – in fact, only five con-firmed dwarf novae are among the 28 new systems found above the gap. Gänsicke (2004) and Rodríguez-Gil (2005) pointed out the large number of SW Sextantis stars among the new HQS CVs, which represent 25% of all newly identified CVs above the gap, and nearly half of all the new CVs in the 3−4 h period range. For comparison, we show in Fig. 17 the inventory of the 3−4 h orbital period range according to
Ritter & Kolb (2003, V7.4). We find that 114 CVs (20% of all CVs with known Porb) inhabit the 3−4 h period range, of which 27 (24%) are confirmed magnetic systems (intermediate po-lars, polars). 33 (29%) belong to the group of either VY Scl or SW Sex stars, which share similar properties, and are suspected to contain magnetic white dwarfs as well (e.g. Rodríguez-Gil et al. 2001; Hameury & Lasota 2002). While the ratio of defi-nite magnetic CVs in the 3−4 h period range (24%) is already very high compared to the incidence of magnetism in isolated white dwarfs (Liebert et al. 2003), confirmation of significant magnetism in the white dwarfs in VY Scl/SW Sex stars would raise the ratio of magnetic/non-magnetic CVs well above 50%, which conflicts with any of the current models of CV evolution. Whatever the verdict on the magnetic fields in VY Scl/SW Sex stars will be, the large number of CVs belonging to this type suggests that they represent an important phase of CV evolution rather than some unusual combination of their physical proper-ties. For completeness, 32 (28%) novalike variables that do not belong to either the VY Scl or SW Sex class populate the 3−4 h period range2. While a number of those systems definitely do not share any of the VY Scl/SW Sex properties, a fair fraction of these systems has been studied only in a very limited way, and hence some of them might well join the VY Scl/SW Sex class upon more detailed scrutiny. Finally, 16 (14%) dwarf no-vae are known in the 3−4 h period range, and the scarcity of systems undergoing thermal disc instabilities just above the pe-riod gap is a well-known fact (e.g. Shafter et al. 1986; Shafter 1992).
5.2. The nature of the four new CVs
Based on observational characteristics (summarised in Table 3) we discuss the likely nature of the four new CVs.
HS 0506+7725 shows short time scale flickering with quasi-periodic oscillations on time scales of ∼15 min. The relatively narrow emission lines and the low amplitude of the radial velocity variations suggest a low inclination. The system has been detected in the RASS (Voges et al. 2000) at 0.07 cts s−1 (1RXS J051336.1+772836) with a hard spec-trum, and has been previously detected as an X-ray source by EINSTEIN (2E 0506.1+7725). The presence of moderately 2 The classification of Ritter & Kolb (2003) is somewhat confusing,
[image:10.595.37.271.427.556.2]strong HeIIλ4686 emission in the identification spectrum in-dependently confirms the presence of ionising radiation in the system. The detection of a deep low state at B18.3 on one of the HQS prism plates clearly identifies the system as a VY Scl star. The system does not display evidence at face value of be-ing an SW Sex star; but as it is obviously a low-inclination bi-nary, a spectroscopic study at higher resolution would be useful to test for anomalous radial velocity behaviour in the emission lines.
The other three systems, HS 0139+0559, HS 0229+8016, and HS 0642+5049 are spectroscopically very similar, be-ing characterised by thick-disc absorption line spectra. The fact that we have observed them on various occasions and found them always at nearly the same magnitude and with the same spectral properties3 makes it very unlikely that these systems are U Gem-type dwarf novae observed dur-ing outburst. While HS 0139+0559 and HS 0229+8016 are not detected in the RASS, a faint X-ray source is found near HS 0642+5049 (1RXS J066618.4+504601, 0.02 cts s−1), which coincides within the 29position error of the RASS de-tection with the CV. The fact that there are no other nearby objects suggests that HS 0642+5049 is a weak X-ray emit-ter. None of the systems shows strong flickering activity. One puzzling difference among the three systems is that, whereas HS 0139+0559 and HS 0229+8016 show no or only very low-amplitude orbital photometric variability but exhibit clean quasi-sinusoidal radial velocity variations in their emis-sion lines, HS 0642+5049 does not display any radial velocity variation but shows a 0.2 mag photometric modulation. It is very difficult to reconcile this opposite difference in spectro-scopic/photometric behaviour in the simple picture of a high-mass transfer CV with a steady-state accretion disc. Based on our data, we identify all three systems either as UX UMa-type novalike variables or as Z Cam-type dwarf novae observed in periods of standstill. Optical long-term monitoring will be nec-essary to distinguish between these two possibilities.
6. Conclusions
We have identified HS 0139+0559, HS 0229+8016, HS 0506+7725, and HS 0642+5049 as long-period CVs with the orbital periods of 243.69±0.49 min, 232.550±0.049 min, 212.7±0.2 min, and 225.90±0.23, respectively. HS 0506+7725 is a VY Scl novalike variable characterised by a strong emission-line spectrum. HS 0139+0559, HS 0229+8016, and HS 0642+5049 have thick-disc spectra and are either UX UMa type novalike variables or Z Cam dwarf nova. None of the objects is a strong X-ray source or displays large-amplitude outbursts, which underlines the strength of CV surveys on spectroscopically selected candidates.
3 With one exception: HS 0229+8016 was observed in August 1992
in a somewhat fainter state, V15.0, compared to its typical bright-ness near 14 mag. On that occasion, the Balmer and HeIabsorption lines were absent/weak, and the strength of the emission lines had markedly increased.
Acknowledgements. A.A. thanks the Royal Thai Government for a
studentship. B.T.G. and P.R.G. were supported by a PPARC Advanced Fellowship and a PDRA grant, respectively. The HQS was supported by the Deutsche Forschungsgemeinschaft through grants Re 353/11 and Re 353/22. Tom Marsh is acknowledged for developing and shar-ing his reduction and analysis packageMOLLY. We thank the referee, Mike Shara, for his comments that lead to an improved presentation of the paper.
References
Andronov, N., Pinsonneault, M., & Sills, A. 2003, ApJ, 582, 358 Araujo-Betancor, S., Gänsicke, B. T., Hagen, H.-J., Rodríguez-Gil, P.,
& Engels, D. 2003, A&A, 406, 213
Araujo-Betancor, S., Gänsicke, B. T., Hagen, H.-J., et al. 2005a, A&A, 430, 629
Araujo-Betancor, S., Gänsicke, B. T., Long, K. S., et al. 2005b, ApJ, 622, 589
Barker, J., & Kolb, U. 2003, MNRAS, 340, 623 Bertin, E., & Arnouts, S. 1996, A&AS, 117, 393 de Kool, M. 1992, A&A, 261, 188
Downes, R. A. 1986, ApJ, 307, 170
Downes, R. A., Webbink, R. F., Shara, M. M., et al. 2001, PASP, 113, 764
Gänsicke, B. T. 2004, in Compact Binaries and Beyond, ed. G. Tovmassian & E. Sion, Rev. Mex. Astron. Astrofis., Ser. Conf., 20, 152
Gänsicke, B. T. 2005, in The Astrophysics of Cataclysmic Variables and Related Objects, ed. J.-M. Hameury & J.-P. Lasota, ASP Conf. Ser., 330
Gänsicke, B. T., Fried, R. E., Hagen, H.-J., et al. 2000, A&A, 356, L79 Gänsicke, B. T., Beuermann, K., & Reinsch, K. 2002a, The Physics of Cataclysmic Variables and Related Objects, ASP Conf. Ser., 261 Gänsicke, B. T., Hagen, H. J., & Engels, D. 2002b, in The Physics
of Cataclysmic Variables and Related Objects, ed. B. T. Gänsicke, K. Beuermann, & K. Reinsch, ASP Conf. Ser., 261, 190
Gänsicke, B. T., Hagen, H.-J., Kube, J., et al. 2002c, in The Physics of Cataclysmic Variables and Related Objects, ed. B. T. Gänsicke, K. Beuermann, & K. Reinsch, ASP Conf. Ser., 261, 623
Gänsicke, B. T., Araujo-Betancor, S., Hagen, H.-J., et al. 2004a, A&A, 418, 265
Gänsicke, B. T., Jordan, S., Beuermann, K., et al. 2004b, ApJ, 613, L141
Hagen, H. J., Groote, D., Engels, D., & Reimers, D. 1995, A&AS, 111, 195
Hameury, J. M., & Lasota, J. P. 2002, A&A, 394, 231
Hameury, J.-M., & Lasota, J.-P. (eds.) 2005, The Astrophysics of Cataclysmic Variables and Related Objects, ASP Conf. Ser., 330 Heber, U., Jordan, S., & Weidemann, V. 1991, in NATO ASIC Proc.,
336, White Dwarfs, 109 Horne, K. 1986, PASP, 98, 609
Howell, S. B., Rappaport, S., & Politano, M. 1997, MNRAS, 287, 929 King, A. R. 1988, QJRAS, 29, 1
Kolb, U. 1993, A&A, 271, 149
Liebert, J., Bergeron, P., & Holberg, J. B. 2003, AJ, 125, 348 Mennickent, R. E., Tovmassian, G., Zharikov, S. V., et al. 2002, A&A,
383, 933
Nogami, D., Engels, D., Gänsicke, B. T., et al. 2000, A&A, 364, 701
Politano, M. 1996, ApJ, 465, 338
Ritter, H., & Burkert, A. 1986, A&A, 158, 161 Ritter, H., & Kolb, U. 2003, A&A, 404, 301
Rodríguez-Gil, P. 2005, in The Astrophysics of Cataclysmic Variables and Related Objects, ed. J.-M. Hameury & J.-P. Lasota, ASP Conf. Ser., 330, 335
Rodríguez-Gil, P., Casares, J., Martínez-Pais, I. G., Hakala, P., & Steeghs, D. 2001, ApJ, 548, L49
Rodríguez-Gil, P., Gänsicke, B. T., Araujo-Betancor, S., & Casares, J. 2004a, MNRAS, 349, 367
Rodríguez-Gil, P., Gänsicke, B. T., Barwig, H., Hagen, H.-J., & Engels, D. 2004b, A&A, 424, 647
Rodríguez-Gil, P., Gänsicke, B. T., Hagen, H.-J., et al. 2005a, A&A, 431, 269
Rodríguez-Gil, P., Gänsicke, B. T., Hagen, H.-J., et al. 2005b, A&A, 440, 701
Scargle, J. D. 1982, ApJ, 263, 835
Schenker, K., & King, A. R. 2002, in The Physics of Cataclysmic Variables and Related Objects, ed. B. T. Gänsicke, K. Beuermann, & K. Reinsch, ASP Conf. Ser., 261, 242
Schneider, D. P., & Young, P. 1980, ApJ, 238, 946 Shafter, A. W. 1992, ApJ, 394, 268
Shafter, A. W., Wheeler, J. C., & Cannizzo, J. K. 1986, ApJ, 305, 261 Szkody, P., Gänsicke, B. T., Fried, R. E., Heber, U., & Erb, D. K. 2001,
PASP, 113, 1215
Szkody, P., Henden, A., Fraser, O. J., et al. 2005, AJ, 129, 2386 Taam, R. E., Sandquist, E. L., & Dubus, G. 2003, ApJ, 592, 1124 Thorstensen, J. R., & Fenton, W. H. 2002, PASP, 114, 74
Table 1. Log of the observations.
Date UT time Filter/ Exp. Frames Mean Grating (s) mag
HS 0139+0559 Spectroscopy: Calar Alto 3.5 m and B and C
1989 Jan. 22 19:21 120 Å/mm 900 1 –
Spectroscopy: Calar Alto 3.5 m and TWIN
2002 Oct. 28 23:53–00:03 T08/T01 300 1 – 2002 Oct. 29 22:36–03:21 T05/T06 600 16 –
Spectroscopy: Calar Alto 2.2 m and CAFOS
2003 Dec. 24 18:25–00:10 G-100 600 27 15.4 2003 Dec. 26 18:34–20:48 G-100 600 12 15.1
Spectroscopy: Hamburg-Schmidt telescope at Calar Alto
1981 Nov. 01 – Prism 3600 1 14.9 1981 Nov. 02 – Prism 3600 1 14.9
Photometry: Braeside Observatory
1999 Dec. 30 02:15–07:04 R 70 293 – 2000 Jan. 04 02:31–06:04 B 50 136 –
HS 0229+8016
Spectroscopy: Calar Alto 2.2 m and B and C
1992 Aug. 08 03:16 900 1 15.0
Spectroscopy: Calar Alto 2.2 m and CAFOS
1998 Oct. 05 01:37 B-200 1800 1 13.7 2003 Dec. 14 19:18–00:55 G-100 600 24 14.2 2003 Dec. 16 20:21–03:08 G-100 600 27 – 2003 Dec. 23 18:49–21:01 G-100 600 12 14.5 2003 Dec. 26 21:34–22:53 G-100 600 7 14.1 2003 Dec. 27 18:46–19:22 G-100 600 4 13.7
Spectroscopy: Hamburg-Schmidt telescope at Calar Alto
1986 Nov. 05 – Prism 3600 1 14.4 1986 Nov. 06 – Prism 3600 1 14.2 1994 Nov. 12 – Prism 3600 1 14.6
Photometry: Kryoneri Observatory
2002 Sep. 20 01:30–03:28 R 5 840 14.2 2002 Sep. 20 22:37–03:27 R 5 1680 14.3
Photometry: Tuorla Observatory
2003 Jan. 10 15:41–23:45 Clear 30 695 14.3
HS 0506+7725
Spectroscopy: Calar Alto 3.5 m and TWIN
2002 Dec. 03 03:22–05:09 T05/T06 600 10 –
Spectroscopy: Calar Alto 2.2 m and CAFOS
[image:14.595.59.315.116.652.2]1998 Feb. 02 19:43 B-400 180 1 – 2002 Dec. 09 00:19–00:30 G-100 600 2 15.4 2003 Dec. 13 23:25–03:53 G-100 600 23 14.7 2003 Dec. 15 01:34–06:13 G-100 600 23 14.9 2003 Dec. 17 03:40–05:57 G-100 600 12 – 2003 Dec. 23 22:19–00:31 G-100 600 12 14.9 2003 Dec. 26 02:52–03:28 G-100 600 4 14.9
Table 1. continued.
Date UT time Filter/ Exp. Frames Mean
Grating (s) mag
Spectroscopy: Hamburg-Schmidt telescope at Calar Alto
1987 Oct. 29 – Prism 3600 1 15.1 1994 Jan. 12 – Prism 3600 1 15.3 1995 Oct. 23 – Prism 3600 1 18.3
Photometry: Kryoneri Observatory
2002 Oct. 08 22:46–01:25 R 10 599 15.2
Photometry: Tuorla Observatory
2003 Jan. 04 16:13–20:16 Clear 120 32 15.7 2003 Jan. 06 15:47–20:46 Clear 60 213 15.8 2003 Jan. 16 20:18–22:40 Clear 60 115 15.9
Photometry: OGS
2003 Nov. 15 03:21–06:37 Clear 5 1110 14.6
Photometry: Calar Alto 2.2 m and CAFOS
2003 Jan. 01 01:01–03:24 V 30 85 15.1 2003 Dec. 16 00:05–05:11 Clear 15–30 346 14.8 2003 Dec. 25 19:15–02:29 Clear 15–30 296 14.9 2003 Dec. 27 04:03–06:16 Clear 20 149 14.9 2003 Dec. 27 20:33–23:55 Clear 20 288 14.8
HS 0642+5049
Spectroscopy: Calar Alto 2.2 m and CAFOS
1999 Mar. 07 19:11 B-400 300 1 – 2003 Apr. 27 20:03–21:53 G-100 600 9 15.6 2003 May 10 20:20–21:21 G-100 600 6 – 2003 May 11 20:17–21:20 G-100 600 6 – 2003 Dec. 25 00:56–05:35 G-100 600 24 15.5 2003 Dec. 27 02:50–03:01 G-100 600 2 15.3 2004 Oct. 24 02:12–05:26 G-100 600 17 15.3 2004 Oct. 26 04:25–05:31 G-100 600 7 15.4
Spectroscopy: INT 2.5 m and IDS
2003 Apr. 25 21:21–22:14 R632V 600 6 – 2003 Apr. 26 21:17–21:49 R632V 600–900 4 – 2003 Apr. 28 21:15–22:08 R632V 600 6 –
Spectroscopy: Hamburg-Schmidt telescope at Calar Alto
1991 Nov. 10 – Prism 3600 1 15.8 1993 Oct. 24 – Prism 3600 1 16.0
Photometry: Tuorla Observatory
2003 Dec. 30 19:58–21:06 Clear 120 46 15.4 2004 Jan. 01 18:37–23:27 Clear 60 250 15.5
Photometry: Calar Alto 2.2 m and CAFOS
2003 Dec. 26 04:20–06:14 Clear 20–30 149 15.6 2004 Oct. 22 04:01–05:25 Clear 15 59 15.7 2004 Oct. 25 01:42–05:51 Clear 10–15 463 15.5
Photometry: IAC80