1
5-2-2016
Patient preferences for follow-up in
breast cancer
HEALTH SCIENCES
Faculty of Behavioral, Management and Social
sciences
EXAMINATION COMMITTEE
Dr. J.A. van Til
Prof. Dr. S. Siesling
UNIVERSITY OF TWENTE.
2
MASTER THESIS
Surname: Koel
Given Name: Colin David
Student Number: S1017586
E-mail: c.d.koel@student.utwente.nl
Master Program Health Sciences – Health Services and Management
Faculty Faculty of Behavioral, Management and Social sciences (BMS)
Department Department of Health Technology and Services Research (HTSR)
Date 05-02-2016
First supervisor Dr. J.A. van Til
Second supervisor Prof. Dr. S. Siesling
3
Summary
Introduction
Breast cancer is the most frequent cancer for women. One in every eight women will develop breast cancer. In 2010 around 15.000 women were diagnosed with breast cancer. When the patient is declared breast cancer free, patients could participate in a follow-up program. The aim of a follow-up is to determine physical symptoms due to treatment, determine the need for psychosocial support and to detect possible recurrence or second primary tumors. Patients often have more follow-up consults than guidelines suggest, while a less intense follow-up is as effective as a more intensive follow-up. Research showed that patients have different preferences for follow-up content and could be the result of a fear of cancer recurrence. Fear of recurrence is associated with impairment in physical functioning, psychological distress and a lower quality of life. In this study, patient preference and risk perception will be investigated to find differences in preferences between risk perception groups.
Method
A quantitative and qualitative research is performed to elicit the preferences of patients. For eliciting the quantitative data, a questionnaire is developed. The questionnaire contains questions regarding risk perception and a Discrete Choice Experiment to elicit the preferences of patients. Patients are categorized in different risk perception groups based on the chance of developing a local regional recurrence found in earlier research. In discrete choice experiment methods, a patient has to choose the preferred hypothetical scenario in a choice set of questions. These scenarios describe several follow-up content. Regarding the qualitative method, the researcher asked the respondents an open question to determine which content they prefer in their follow-up. This study is performed at two hospitals and data collection took place from the 14th of September until the 23rd of October.
Results
A total of 89 questionnaires were used in the analysis regarding the quantitative method and 72 regarding the qualitative method. The risk perception groups show different fear of recurrence. This fear increases with a higher risk perception of developing a recurrence. Most respondents underestimate or overestimate their risk. Regarding the general preferences of the research population, differences in preferences are found between the quantitative and qualitative research in frequency of follow-up consults and type of healthcare professional.
Conclusion
4
Table of Contents
1. Introduction ... 6
1.1 Current guidelines of a follow-up program ... 6
1.2 Effectiveness of the follow-up program ... 6
1.3 Patient preferences for the follow-up program ... 7
1.4 Fear of recurrence ... 8
1.5 Problem description ... 9
1.6 Aim of this research ... 9
1.7 Research Question ... 9
2. Research Method ... 10
2.1 Research design ... 10
2.2 Discrete choice experiment ... 10
2.3 Attributes and levels ... 11
2.4 Experimental design ... 11
2.5 Study population... 11
Inclusion criteria and exclusion criteria... 11
Sample size ... 11
2.6 Data collection ... 12
2.7 Pilot test ... 12
2.8 Questionnaire... 13
Part 1: Patient characteristics ... 13
Part 2: Risk perception and fear of recurrence ... 13
Part 3: Discrete choice experiment ... 13
Part 4: Symptoms and follow-up goals ... 13
2.9 Interview ... 14
2.10 Patient recruitment ... 14
2.11 Data analysis... 15
2.12 Statistical analysis ... 16
3. Research results ... 17
3.1 Patient characteristics ... 17
3.1.1 Risk perception ... 18
3.1.2 Fear of recurrence ... 19
3.2 Relation between physical and psychological symptoms and patients’ risk perception ... 20
3.2.1 Frequencies anxiety and depression ... 20
3.3 Patients’ preferences with regard to process and content of follow-up ... 21
3.3.1 Other factors that can influence the follow-up preferences ... 22
5
3.5 Relation between risk perception and preferences ... 24
4. Discussion ... 26
4.1 Findings and comparison with literature ... 26
4.2 Limitations... 29
4.2.1 Statistical significance ... 29
4.2.2 Discrete choice experiment design ... 29
4.2.3 Psychological and physical symptoms ... 29
4.2.4 Risk perception and fear of recurrence ... 30
4.2.5 Data collection ... 30
4.2 Recommendation ... 31
4.3 Conclusion ... 32
5. Literature ... 33
6. Appendix ... 36
6.1 Preferences measure instruments ... 36
6.2 Construction of the DCE ... 37
Step 2. Attributes and levels ... 37
Step 3. Constructing the tasks ... 38
Step 4. Experimental design ... 38
6.2.1 Determining the sample size ... 38
6.3 Data analysis discrete choice experiment ... 39
6.4 Recoding the data ... 40
6.5 Tables and figures ... 42
6
1.
Introduction
Breast cancer is the most frequent cancer that occurs among woman in the Netherlands (1). One in every eight women in the Netherlands will get breast cancer (2). In 2010 around 15.000 women were diagnosed with breast cancer and it is expected that this number will increase to over 17.000 women in 2015. This increase of incidence rates can be explained by several aspects, such as the increased use of mammography and cytology and the introduction of breast cancer screening programs. In 2010, around 3.700 women died of breast cancer in the Netherlands. The five year survival in all age groups is 80% (3). It is estimated that there are 119.000 former breast cancer patients in 2005 that lived in the Netherlands. This number may increase to 194.000 breast cancer survivors in 2015. 80% of these women still needs to use healthcare related to breast cancer (3). When the curative treatment is ended and the patient is declared breast cancer free, the patient participates in a follow-up program in the hospital.
1.1 Current guidelines of a follow-up program
In the Netherlands the follow-up program is part of the standard medical care after breast cancer treatment (4, 5). The primary purpose of follow-up is the early detection of local regional recurrences or a second primary tumor, detecting side-effects of treatment and providing psychosocial support (6). The follow-up has a minimum duration of five years. In the first year of the follow-up, the patient will visit a healthcare professional every three months. In the second year, the patients visits the hospital every six months and annually in remaining three years of follow-up. During these visits, patients receive a physical examination and an annual mammogram. The annual follow-up visits continue until the age of 60. Patients older than 60 years continue in the national breast cancer screening program or are referred to the general practitioner (7). These follow-up practices vary between hospitals in the Netherlands. Patients often attend more follow-up visits than the guidelines recommend (8). This standard is set by the National Breast Cancer Consideration Netherlands (6). The guidelines do not take the individual differences of a breast cancer recurrence into account.
1.2 Effectiveness of the follow-up program
7
1.3 Patient preferences for the follow-up program
Several studies investigated the preferences of patients regarding the follow-up of breast cancer. Research by Bock et al (2004) analyzed the needs and preferences of patients in routine follow-up after treatment for breast cancer (10). More than 50% of the patients preferred lifetime follow-up, twice a year, performed by a hospital doctor. Younger age of patients was related to a greater need for information during the follow-up. Despite the questionable added prognosis value of the follow-up, patients still prefer a follow-up visit every three months over visits every four, six or twelve months.
Research by Renton et al (2002) surveyed the opinions of patients on routine follow-up (11). They have shown that patients are satisfied with the current breast cancer follow-up arrangement but they would accept some changes. This change would take place in the healthcare professionals for the follow-up. The study showed that the patients have confidence in the medical staff. 64% of the patients would be satisfied if their healthcare professional in a follow-up was a nurse and 38% would be satisfied with a general practitioner.
Research by Kimman et al (2010) used a discrete choice experiment to investigate the patient preferences for breast cancer patients in the follow-up (12). In this research, they evaluated reduced follow-up strategies. The research showed that patient satisfaction would not differ significantly if the patient had a follow-up with a medical specialist and breast care nurse compared to a follow-up with only a medical specialist. Furthermore, they found heterogeneity in the preferences of patients. This indicates that a one size follow-up strategy does not fit for all patients.
Research by Montgomery et al (2008) studied the expectations of patients in the follow-up (13). Their research showed a large difference in expectations regarding the duration of the follow-up between patients under and above the age of 50 years. Patients below 50 years expected a higher frequency in clinical visits than patients above 50 years. In the overall population more than 60% of the patients felt that they would have less anxiety and therefore would be more reassured when they had more clinical visits. When the patients were informed about the effectiveness of a routine-follow regarding the ability to detect a recurrence, still more than 60% preferred regular clinical visits. More than 30% of the patients would be happy not to come back to the clinic (13). When patients were not informed about the effectiveness of follow-up, they expect a higher chance of survival when more tests are performed. Therefore patients should be better informed about the effectiveness of follow-up so that unrealistic expectations could be prevented (7).
8
The differences in patient preferences could be the result of a fear of cancer recurrence. When the curative treatment is finished, the patient can develop a fear of cancer recurrence (18). Even long-term cancer survivors, who are cancer free for at least five years, have uncertainties about the recurrence of a cancer or the late effects of the treatment. The psychosocial impact of a breast cancer diagnosis has a greater impact on younger women (20). Fear of recurrence is associated with impairment in physical functioning, psychological distress, stress-response symptoms and a lower quality of life (21). When the psychological status of a patient during a follow-up is examined it might improve the patient’s coping abilities with the disease. Additional rehabilitation programs are available for breast cancer patients in the follow-up. These programs can provide physical or mental aid for the problems that are the result of breast cancer. Women below the age of 50 years have a higher fear of recurrence than women with an age 50 years and above (22). Also a difference is found in age groups regarding the need for information. Patients who needed less information had a higher quality of life and were more satisfied with interpersonal aspects (10). A higher fear of recurrence was shown at mothers because they are afraid to leave their children behind (22). Married women showed a higher fear of recurrence than single women and unemployed patients and housewives showed higher fear of recurrence than retired and employed patients (23).
1.4 Fear of recurrence
Fear of recurrence can be defined as the fear or worry of the patient that the breast cancer might come back in the same breast or another area of the body, or that a new breast cancer in either breast will develop (21). A recurrence of breast cancer can be the result of developing a new primary breast cancer, metastases or a local regional recurrence. A local regional recurrence of breast cancer is defined as a recurrence of the cancer in the breast, chest wall, axillary, infraclavicular, supraclavicar of parasternal lymph node area after curative treatment (24). In a research study of Clemons et al (2001), the overall incidence of a local regional recurrence was 13% after mastectomy and 12% after breast conserving therapy in a ten year survival (25). This relapse of breast cancer is higher in the first five years after curative treatment. Respondents have an overall incidence between 20 and 30% after mastectomy or breast conserving therapy with a combination of chemo and radio therapies (26, 27).
According to a theoretical model of fear of recurrence based on Leventhal’s Self-Regulation Model of Illness, fear of recurrence is the result of the following three factors (28):
The perception of personal risk to a recurrence. This perception can be influenced among different factors such as the cancer stage and the treatment received.
The emotional state of the patient. Especially the factor anxiety can be an increasing factor.
Greater perceived physical, economic and social consequences that are associated with cancer.
9
1.5 Problem description
Due to an increased breast cancer incidence and a better survival rate, the number of patients in the follow-up increases. Due to this increase of patients, the burden on caregivers for breast cancer in the follow-up is growing, which can result in problems for the amount of patients that can be treated in a hospital. Patients are regularly more followed than guidelines recommend. According to the healthcare professionals, a reason for this higher frequency of follow-up is the patient preferences. Earlier research showed that the preference of patients varies over the length, frequency and provider of follow-up (10-13). This difference in patient demand regarding follow-up can be caused by the risk perception of a patient, which is the result of physical and/or psychological factors such as anxiety and depression due to fear of recurrence. Risk perception studies examine the judgments that people make when they are asked to characterize and evaluate hazardous activities and technologies (32). Risk perception to a disease has been studied often to predict the individuals’ propensity to take preventive action to increase the health behavior of people.
By reconsidering the follow-up program, it is possible to develop more individual and cost-effective follow-up scenarios, instead of having a one size fits all follow-up. To formulate and evaluate new follow-up approaches the expectations of the patients regarding the follow-up must be clearly addressed (33). An increase in patient satisfaction can be obtained with an individualized follow-up where the patients’ needs and preferences are taken into account (12, 33).
1.6 Aim of this research
This study investigates the patient preferences and the risk perception of the patient and tries to attempt to find differences in preferences between different risk perception groups. By investigating this, it will be visible how risk perception influences the need for follow-up in frequency, duration, type of contact and healthcare professional. Also the patients’ goals for follow–up are determined, so it becomes visible what the patients’ expectations and aims are regarding a follow-up. When the influences of these factors are determined a more individualized follow-up could be realized. For instance, if the results show that respondents that underestimate their risk prefer a less intensive follow-up, certain measures such as patient education regarding the effectiveness of follow-up and more physical and psychological support for patients could be a solution to decrease the risk perception of patients that overestimate their risk of recurrence. By doing this, the follow-up preferences could be altered.
1.7 Research Question
What is the relationship between patients’ risk perception of cancer recurrence and their preference for follow-up in terms of process and content?
To answer this research question the following sub questions are formulated.
1. Do the physical and psychological symptoms caused by breast cancer and the treatments for breast cancer influence the risk perception of patients?
2. What are patients’ preferences with regard to process and content of follow-up? 3. What are the patients’ aims in follow-up?
10
2.
Research Method
2.1 Research design
A structured literature review is performed, in order to get insight in the breast cancer follow-up. Through these data and consultation with healthcare professionals the research question, sub questions and the questionnaire design are established. Quantitative and qualitative research is performed to elicit the preferences of the respondents. For the quantitative research data is collected by using a questionnaire. A qualitative research was performed by making personal notes in face-to-face consults with respondents that took place after completing the questionnaire. The quantitative method will be explained in paragraph 2.5 Questionnaire and the qualitative method in paragraph 2.6 Interview. Firstly, the preference measurement instrument is briefly explained, which was used to elicit the indirect preferences in the quantitative method.
2.2 Discrete choice experiment
11
2.3 Attributes and levels
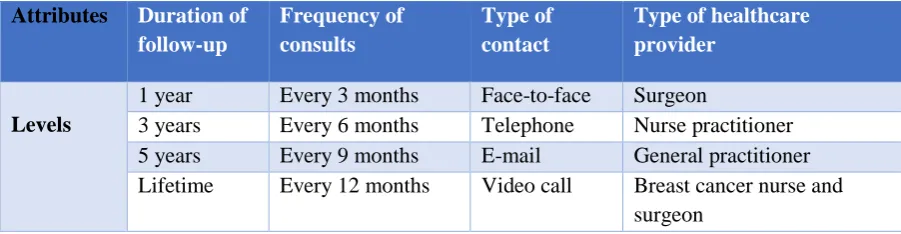
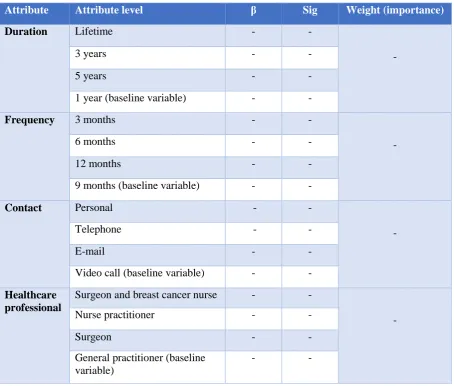
For determining the steps involved in producing a DCE, the International Society for Pharmacoeconomics and Outcomes Research (ISPOR) checklist is used. This checklist gives a clear overview of steps which are needed for producing conjoint-analysis research in healthcare such as determining the attribute and level selection or the construction of task needed for a DCE design (35). The attributes and levels used in the questionnaire are shown in Table 1 and are based on literature reviews and discussion with healthcare professionals. More information regarding the attributes and levels of DCE used in this study can be found in Appendix 6.2 Constructing the DCE.
Attributes Duration of
follow-up
Frequency of consults
Type of contact
Type of healthcare provider
Levels
1 year Every 3 months Face-to-face Surgeon
3 years Every 6 months Telephone Nurse practitioner
5 years Every 9 months E-mail General practitioner
[image:11.595.71.522.194.311.2]Lifetime Every 12 months Video call Breast cancer nurse and surgeon
Table 1. Attributes and levels
2.4 Experimental design
As shown in Table 1, this study contains four attributes and four levels. If all combinations of the four attributes and four levels are used, this will result in (44 =) 256 hypothetical scenarios. Since presenting
all these scenarios would be too burdensome for the respondent, a subset of scenarios was used. Statistical questionnaire design software (Sawtooth 6.4.6.) is used to determine a 24 full DCE scenario resulting in twelve choice set questions. The design made by Sawtooth ensured orthogonality (meaning that a certain attribute level only occurred once in a choice set) and ensured a balance resulting in the equal occurrence of each number of attribute level in the total DCE design. With these 24 scenarios this study could estimate the main effects between the attributes.
2.5 Study population
Inclusion criteria and exclusion criteria
A patient in this research is: an individual who has had a diagnosis of breast cancer, has completed the treatment and is currently cancer free and attend the follow-up. There are multiple treatment and therapies for breast cancer. For this study all treatment and therapy groups are included, resulting in a research population that had a mastectomy or breast saving operation and received the following therapies: radiotherapy, chemotherapy, immunotherapy and hormone therapy.
Respondents were excluded if they were male or when they were not able to understand and read the Dutch language. Healthcare professionals excluded respondents if they had a suspicion that they were not capable to complete the questionnaire at that moment. Respondents were also excluded if they did not complete the full questionnaire.
Sample size
12
2.6 Data collection
The research questions are answered by questioning patients, using a paper questionnaire. Besides the paper questionnaire, an online questionnaire was made in LimeSurvey in case the patient would like to participate on a later moment. In this case, the patient could leave her e-mail address and the researcher would send her an e-mail with the LimeSurvey link. This study aimed to include 84 respondents based on the rule of thumb by Orme and tried to divide the research population between the two hospitals.
2.7 Pilot test
13
2.8 Questionnaire
The questionnaire consists of 44 questions that were divided in four parts. The different parts are discussed below. The complete questionnaire is shown in Appendix 6.6 Questionnaire.
Part 1: Patient characteristics
In this part, general patient characteristics such as age, age diagnosis, living and work situation are asked.
Part 2: Risk perception and fear of recurrence
This part consists of three questions. Two questions are asked to determine the risk perception of the respondents. The operationalization of the risk perception used in this study is based on a research from Gagnon et al (1996) and is slightly adapted for this research (29). In this study, fear of recurrence is operationalized as the perceived risk (chance). The perceived risk perception is an estimation of the respondent of developing a local regional recurrence. In the first question, the respondent answers what she believes is her own risk of getting a recurrence of breast cancer. In the second risk perception question, the respondent has to fill in her perception of developing a recurrence for a former breast cancer survivor in general. At last, the respondent has to fill in her fear for developing a recurrence on a scale (0 – 100) in which a higher value represents a higher fear for a recurrence.
Part 3: Discrete choice experiment
In order to examine the preferences of the respondents for follow-up, a discrete choice experiment is used. A total of twelve DCE choice sets are used. Each choice set consists of two scenarios in which the respondent has to choose the most preferred scenario. An example of a DCE choice set is shown in Figure 1 (the actual DCE questions are in Dutch).
Figure 1. Example DCE choice set
Part 4: Symptoms and follow-up goals
As fear of a recurrence increases with the emotional state of a patient and the physical consequences of a patient that are associated with cancer, this part treats different
symptoms
that could be the result of breast cancer or the treatment that they received. A total of eleven physical and psychologicalsymptoms
are mentioned, of which literature has shown that they could be a result of breast cancer or received treatment therapies (16, 18, 37, 38). Each symptom is based on a five-point Likert scale in which the respondents could determine the degree of severity they endure. Research done by Kwast et al (2013) shows five follow-up goals that patients find important (7). These goals are: Examination of the breast, Reassurance, Guidance of patient (answering questions), Evaluation of treatment and treatment side-effects and Psychosocial support. To determine which aspect the respondent would find most important during the follow-up, these five goals are used. Subsequently, part four consists of questions to determine the relationship with their follow-up healthcare professional (derived from the CQ-index questionnaire for Mamma care from the Centrum of Customer Experience care from NIVEL). This part consists of questions to determine if respondents made use of additional aid, such as a psychologist and contains other follow-up related topics.Scenario 1 Scenario 2
During the rest of your life, you will attend the breast cancer follow-up in which you will have contact with a surgeon by phone every 9 months.
14
2.9 Interview
As mentioned in paragraph 2.1 Research design, this study performed a qualitative research. The researcher asked the respondents an open question to determine which healthcare professional, duration, frequency and type of contact they prefer in their follow-up. This interview was performed in the research room after the respondent completed the questionnaire. By performing this additional research method, this study can determine if there are similarities or differences in the direct preferences and the indirect preferences of respondents derived from the DCE data.
2.10 Patient recruitment
15
2.11 Data analysis
All paper questionnaires were manually transferred into LimeSurvey and thereafter transferred to IBM SPSS Statistics 22. Before the DCE data could be analyzed, values had to be assigned to the different attribute levels. Therefore dummy coding was used. As mentioned in the paragraph 2.2 Discrete Choice Experiment, the respondent must choose the preferred scenario in a choice set in which each hypothetical scenario has four certain attribute levels. At first the hypothetical scenarios were coded in which a value 1 was assigned when the respondent chose for scenario 1 and a value 2 was assigned when the respondent chose scenario 2.
To determine the preferences regarding the attribute levels in these scenarios, each attribute level was coded into 0 and 1. Dummy coding is a way of representing groups of levels using only 0 and 1. By doing this, several variables had to be made. The attribute level was assigned the value 1 when it occurred in the scenario and a 0 when it did not occur. An example (Table 9) of the dummy coding performed in this study can be found in Appendix 6.3 Dummy variables discrete choice experiment.
The number of variables that is needed for dummy coding, is one less than the number of levels. Because this study uses four variables, three dummy variables were needed and one baseline level. All attribute levels are compared with the baseline variable. Therefore, this study had a total of twelve dummy variables and four baseline variables.
After assigning each dummy variable, a certain value of zeroes or ones shows the difference in scoring between the choice sets of scenarios, to determine which attribute level was preferred. If a certain attribute level occurred in scenario one, this level had the value 1. When this same level occurred in scenario two (instead of scenario one) this attribute level had the value -1. When this attribute level did not occur in both hypothetical scenarios this level had the value 0. This was performed for each attribute level in all scenarios, resulting that each DCE choice set had twelve dummy variables in SPSS. The coding of the variables in different subgroups used in the analyses in SPSS are shown in Appendix 6.4
16
2.12 Statistical analysis
After recoding the data, the characteristics of the respondents are analyzed by using a descriptive analysis. A descriptive analysis is also used to determine the follow-up aims and the relationship between patient and healthcare professional. Regarding the statistical level of performed analyses, a P
value (statistical level) of below 0.05 will be accepted as significant.
Regarding the variables living situation, work situation, education and the questions for determining the relation between patient and healthcare professional, a Chi-square analysis was performed to determine if there are differences in those variables between the two hospitals.
To determine if there are differences between the hospitals regarding the background variables, an independent T-test is performed regarding the variables Age patient and Age diagnose breast cancer. With the T-test, the different means of the variables age between both population groups of the two hospitals are determined. In the T-test, the variables age and diagnose age were the dependent variables. The variable hospital was the independent variable.
A One-Way-ANOVA analysis is used to determine the relation between the mean fear of recurrence and risk perception. In this analysis, the fear of recurrence is the dependable variable and the variable perception is the factor variables. With the One-Way-ANOVA test, this study determined if there were differences in fear of recurrences in the different risk perception.
To analyze the DCE data, a logistic regression analysis is performed. With this analysis, the utilities of each attribute level are calculated. A logistic regression analysis is performed to determine the preferences of the total research population. This test is also performed in which the total population was split into three different risk perception groups, resulting in three logistical regression analyses (one analysis per risk perception group).
When the utilities of the attribute levels are determined, the importance of the four attributes could be calculated. By doing this, each attribute is assigned with a certain weight (importance). All four attributes combined, gives a total attribute importance of 100%. With this attribute importance, insight could be given in which attribute the respondent finds most important when making her choices in the choice set. To determine the attribute importance, the difference between the highest and lowest utility is determined for each attribute and divided by the sum of differences of all attributes. By doing this, the importance of each attribute is obtained.
To determine if there are differences in the importance of the follow-up goals between the risk perception groups a Chi-square analysis was performed. Based on their risk perception of a recurrence and stratified by the years since last curative treatment, patients are divided into three risk perception groups. The stratification of patients into the different risk perception groups is shown in Appendix 6.5 Table 13. A Chi-square analysis is performed to determine the relation between risk perception and the
17
3.
Research results
18
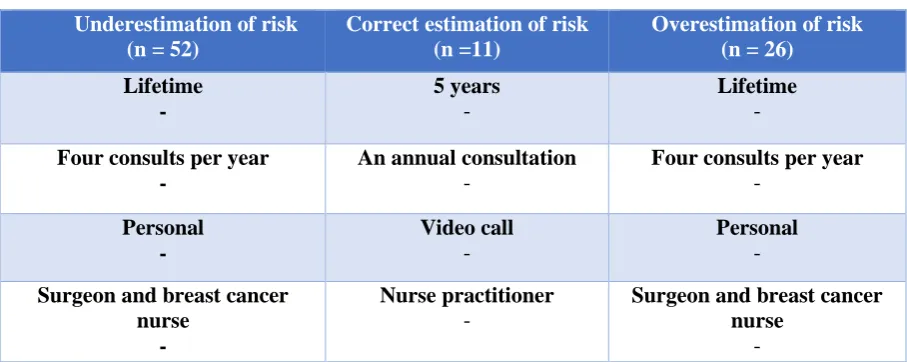
3.1.1 Risk perception
Based on their risk perception of a recurrence and stratified by the years since last curative treatment, patients are divided in the following three groups; underestimation of risk, correct estimation of risk and
[image:18.595.72.527.271.427.2]overestimation of risk. A total of 52 respondents underestimates their risk of a recurrence, eleven respondents are correct in determining their risk of a recurrence and 26 respondents overestimate their risk of a recurrence (Table 3). When patients compared their own risk of a recurrence to other breast cancer survivors, around 50% of the respondents expects to have same risk of developing a recurrence. However, around 40% of the respondents reports to have a lower risk in developing a recurrence than a former breast cancer patient (see Table 14, Appendix 6.5).
Table 3 shows the perception of risk in different follow-up groups (p = 0,214). A total of 56 respondents are currently attending their follow-up between 1-5 years. A total of 25 respondents are currently attending the follow-up between 6-10 years and a total of eight respondents are currently attending their follow-up longer than 10 years.
Follow-up groups/ perception group
Underestimation of risk
Correct estimation of risk
Overestimation of risk
Total
1–5 years follow-up
(n [%])
- - - -
6–10 years follow-up
(n [%])
- - - -
Longer > 10 years
(n [%])
- - - -
Total - - -
-Table 3. Relation between risk perception and different groups of follow-up duration
[image:18.595.72.528.275.427.2]19
3.1.2 Fear of recurrence
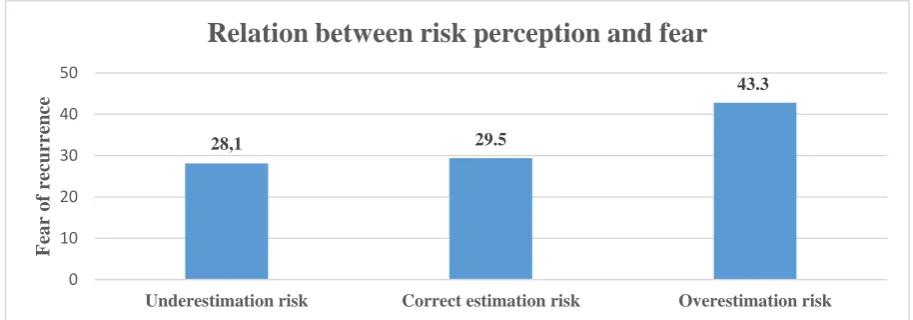
[image:19.595.68.525.165.325.2]Now this study wants to determine whether there are differences in fear of recurrence between the three risk perception groups. Figure 2 shows the relation between the risk perception groups and the fear of recurrence (p = 0,036). Here, it is shown that the fear of a recurrence differs between the risk perception groups. The fear of a recurrence increases if patients expect they have a higher risk of a recurrence. The overall mean fear of recurrence in this study population is 32,7.
Figure 2. Relation between risk perception and fear of recurrence
28,1 29.5
43.3
0 10 20 30 40 50
Underestimation risk Correct estimation risk Overestimation risk
F
ea
r
o
f
re
curr
ence
20
3.2
Relation between physical and psychological symptoms and patients’
risk perception
[image:20.595.73.527.204.387.2]To determine if there is a relation between risk perception and
symptoms
, the current psychological and physical symptoms are used. The number of respondents that has psychological symptoms decreases during the follow-up. However, the number of respondents that has physical symptoms increases during the follow-up (see Table 19, Appendix 6.5). Table 4 shows the relation between the current psychological/physical symptoms groups and the risk perception groups.Table 4. Relation between risk perception and symptom groups
Regarding the relation between psychological symptoms due to breast cancer or received treatment or therapy and risk perception (p = 0,230), most respondents are categorized as respondent without psychological symptoms. However, the relation between psychological symptoms in Table 4 are not statistical significant. A certain trend is visible. About half of the respondents with psychological symptoms overestimated their risk of recurrence. This overestimation of risk is lower in the group without symptoms. The relation between physical symptoms and risk perception (p = 0,522) shows a similar trend. More than a third of the respondents with physical symptoms overestimate their risk of a recurrence compared to the group that reports having no physical symptoms.
3.2.1 Frequencies anxiety and depression
In this study, the frequencies of psychological symptoms are decreased during the follow-up (see Table 20, Appendix 6.5). More respondents experienced depressive or anxiety symptoms in the beginning of the follow-up compared to their current situation. Although the amount of symptoms decreases, it is visible that these symptoms still affect a large population. Almost half of respondents (46.1%) report that they still experience depressive feelings and more than half of the respondents (55.1%) experience anxiety.
Groups Underestimation
of risk
Correct estimation of
risk
Overestimatio n of risk
Total
Psychological symptoms
(p = 0,230)
Symptoms
(n [%]) - - --No symptoms
(n [%]) - - - -Physical symptoms(p = 0,522)
-21
3.3 Patients’ preferences with regard to process and content of follow-up
At first the preferences of the total population with regard to the content follow-up are determined. The content of follow-up is divided into four attributes: duration, frequency, type ofcontact and healthcare professional. The weights of the attributes are calculated to determine which attribute has the most impact. In Table 5 the weights of each attribute and the coefficients (β) and significance (Sig) per attribute level are shown. The respondents find duration of follow-up the most important attribute. Respondents prefer a lifetime follow-up instead of a shorter follow-up. The least important attribute was
frequency of follow-up. It seems that respondents do not have strong preference for a follow-up consult of four times, three times, every nine months or annual. This importance of attributes reflects the degree to which respondents base choices with regard to follow-up on the outcome on this attribute. Based on the importance of the attributes, the respondents make their choices of scenarios mainly on the duration of the follow-up and type of healthcare professional that does the follow-up.
[image:21.595.72.527.331.717.2]Now that the weights of the different attributes are calculated, we are interested in which attribute levels are most valued by the respondents. Within an attribute the levels with the largest coefficients are most preferred and the levels with the lowest coefficients are least preferred.
Table 5. Coefficients per attribute level
Attribute Attribute level β Sig Weight (importance)
Duration Lifetime - -
-3 years - -
5 years - -
1 year (baseline variable) - -
Frequency 3 months - -
-6 months - -
12 months - -
9 months (baseline variable) - -
Contact Personal - -
-Telephone - -
E-mail - -
Video call (baseline variable) - -
Healthcare professional
Surgeon and breast cancer nurse - -
-Nurse practitioner - -
Surgeon - -
General practitioner (baseline variable)
22
Regarding the qualitative method, the preferences of a total of 72 respondents are analysed. These results show that respondents have the largest preference for a personal lifetime follow-up with an annual consult with a nurse practitioner. No preferences is found for contact by email or video call, however some respondents showed interest in the combination telephone and personal contact. In general, patients would not prefer any other follow-up contact beside face-to-face follow-up because other follow-up contacts are not personal enough. Other reasons for disliking the contact by email or video call are that respondents do not have the capability or capacity to perform this type of contact. Respondents strongly prefer an annual consultation, because they do not want to be confronted with their breast cancer too often. Multiple respondents reported they only fear a breast cancer recurrence days/weeks before a up consultation. However, some respondents mentioned that more follow-up consults (twice a year) are preferred in the first follow-follow-up years. Regarding the healthcare professional, most respondents preferred a nurse practitioner. There was almost no preference for the healthcare professionals surgeon and nurse, surgeon or general practitioner. Patients find that the nurse practitioner has enough expertise to perform the follow-up. They especially appreciate the nurse practitioners because they are approachable, qualified and takes time for a follow-up consult. Respondents reported that they find it easier to express their emotional concerns to a nurse compared to other health professionals. Some patients reported that it is not necessary that a surgeon should be a follow-up health professional regarding the higher healthcare costs. Patients mentioned that they prefer nurse practitioner over a surgeon because a consult with a surgeon is shorter. As shown in the quantitative method, the qualitative method also shows that respondents do not have preference for a general practitioner as their health professional in the follow-up. This dislike of this health professional is caused because patients expect that a general practitioner would lack breast cancer knowledge and is too busy to be a follow-up professional. There were some patients that did not have a preference for a certain healthcare professional as long follow-up consults took place in the hospital.
3.3.1 Other factors that can influence the follow-up preferences
A quarter of the respondents has a preference for a female healthcare professional in the follow-up. The remaining respondents have no preference regarding the sex of the healthcare professional. None of the respondents has a preference for solely a male healthcare professional. Respondents reported that they do not have a strong preference regarding the gender of the healthcare professionals, as long they are capable to perform a follow-up. As mentioned in paragraph 3.1 Patient characteristics, there are multiple patients with a cancer history or family members that had breast cancer. Regarding the relation between former cancer history and the risk perception groups, we cannot determine if having cancer in the past influences the risk perception of patients (p = 0,108). The variety of cancer history between the perception groups is not consistent. Most of the respondents who had cancer in the past, had breast cancer and overestimated or underestimated their risk of a recurrence. This variety of risk perception is also found in respondents that had cervical and skin cancer. This analysis is shown in Appendix 6.5 (Table 15).
23
3.4 Aims of the follow-up to patients
Table 6. Patient follow-up goals
Table 6 shows the five patient’s goals of follow-up. The most important goals in follow-up are: physical examination, reassurance and answering questions. Of less importance are: psychological support and discussing the side effects of the treatment. During the face-to-face contact, patients reported that besides the personal contact in the hospital the mammography was also an important aspect of the follow-up to provide additional reassurance. A relation between the importance of psychological and living situation was found (p = 0,001), in which respondents that live alone find this psychological support more important than respondents that live together (see Table 17, Appendix 6.5). One of the reasons that the follow-up for breast cancer was established, is to provide psychological support to patients. A total of 35 respondents reported that they received help from these rehabilitation programs. 31 respondents made use of physical therapy, ten respondents used the aid of a psychologist, four respondents received additional help from a healthcare professional from cancer rehabilitation and one respondent received aid from a dietician.
No relation is found between the risk perception groups and the importance of the goals: Reassurance
(p = -), Physical examination (p = -), Psychosocial support (p = -), Guidance of patients; answering questions (p = -), and To discuss the effects of the treatment (p = -) (see Table 18, Appendix 6.5). However, a trend is found between risk perception and psychosocial support. Most respondents that find psychosocial support important are respondents that are correct with their perception of risk or respondents that overestimated their risk. More respondents that underestimated their perception of risk find psychosocial support of a neutral importance.
Follow-up goals \ degree of importance
Not important
(n [%])
Not very important
(n [%])
Neutral importance
(n [%])
Important (n [%])
Very important
(n [%])
Physical examination - - - -
-Reassurance - - - -
-Psychological support - - - -
-To discuss treatment and side effects of the treatment
- - - -
-Guidance of patients; answering questions
- - - -
24
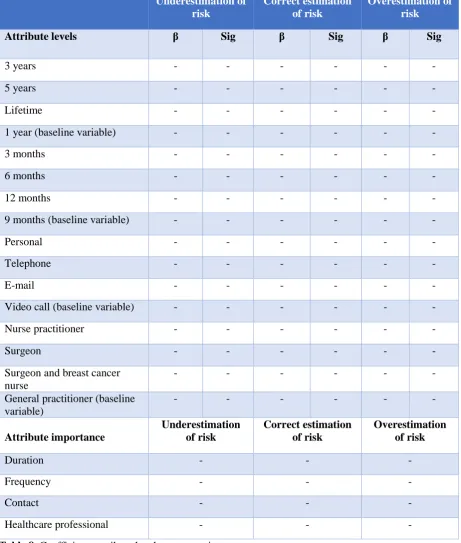
3.5 Relation between risk perception and preferences
In the first sub question, the total preferences of the research population regarding the need for follow-up are determined. In this research question, the relation between risk perception grofollow-ups and the type of follow-up they prefer is determined. The results of these analyses are shown in Table 8 (next page). Here, it is shown that the attribute importance is different between the risk perception groups. However, the attribute duration of follow-up is still found the most or second most important attribute. All risk perception groups find the frequency of follow-up consult the least important attribute.
Table 7 shows the most preferred attribute levels of all risk perception groups. It is expected that respondents that overestimated their perception of risk would have preference for an intensive follow-up duration, because they expect to have a high risk of a recurrence. However, the same preferences of content are found in the group that underestimated their perception of risk, when it is expected that this group would prefer a less intensive follow-up. Both risk perception groups prefer a long intensive follow-up.
Noticeable is that the group that had the correct perception of risk of a recurrence prefers a much less intensive follow-up compared to the other risk perception groups regarding duration, frequency of consults and type of contact. Figures regarding the preferences in attribute levels of the different risk perception groups are shown in Appendix 6.5 (Figure 6-8).
Underestimation of risk (n = 52)
Correct estimation of risk (n =11)
Overestimation of risk (n = 26)
Lifetime -5 years - Lifetime -
Four consults per year
-An annual consultation
-
Four consults per year
- Personal -Video call - Personal -
Surgeon and breast cancer nurse
-Nurse practitioner
-
Surgeon and breast cancer nurse
[image:24.595.71.525.330.511.2]-
25
Table 8. Coefficients attribute level per perception group
Underestimation of risk
Correct estimation of risk
Overestimation of risk
Attribute levels β Sig β Sig β Sig
3 years - - -
-5 years - - -
-Lifetime - - -
-1 year (baseline variable) - - -
-3 months - - -
-6 months - - -
-12 months - - -
-9 months (baseline variable) - - -
-Personal - - -
-Telephone - - -
-E-mail - - -
-Video call (baseline variable) - - -
-Nurse practitioner - - -
-Surgeon - - -
-Surgeon and breast cancer nurse
- - -
-General practitioner (baseline variable)
- - - -
Attribute importance
Underestimation of risk
Correct estimation of risk
Overestimation of risk
Duration - -
-Frequency - -
-Contact - -
-26
4.
Discussion
4.1 Findings and comparison with literature
This study examined the preferences of patients in the follow-up of breast cancer, in which the relation between risk perception and the preferences for follow-up was determined. The aim of this research was
to determine if differences in preferences could be found between different risk perception groups. If certain preferences could be related to perception of risk, a more individualized follow-up could be
realized.
Firstly, it was investigated if there is a relation between physical and psychological symptoms and the risk perception of patients. No statistical differences were found. The results showed certain trends. Especially patients with psychological symptoms overestimated their risk of a recurrence compared to patients without psychological symptoms. This trend was also seen in the relation between physical symptoms and risk perception. However, it is difficult to determine if these trends are valid. Several studies have investigated whether patients, that received more physical and psychologically aversive treatments such as chemotherapy or mastectomy, have a higher fear of recurrence then patients that received a breast conserving surgery. While some studies find a direct relation between a more physical and psychological aversive treatment and a higher fear of recurrence, other studies did not find that relation (21, 39).
27
Patients often report that they appreciate the nurse practitioner because she is approachable, qualified and takes time for a follow-up consult. Also some respondents reported that they appreciate the nurse practitioner because they could express their emotional concerns more easily to a nurse, which is also confirmed in other studies (11, 12). Multiple studies had interest in a general practitioner leading follow-up care (11, 40, 41). Grunfeld et al (2006) found that a follow-follow-up led by a general practitioner is evenly effective as a specialist follow-up (41) and that patients were satisfied having a follow-up in the primary care (40). However, patients in this study do not share this preference. Respondents reported that the general practitioner would lack breast cancer knowledge and is too busy to be a follow-up professional. However, some patients reported that they would return to their general practitioner if the hospital follow-up ended which is also confirmed in other research (7, 19).
28
29
4.2 Limitations
Multiple limitations are found in this study. The limitations in each aspect of this study are discussed in the following paragraphs.
4.2.1 Statistical significance
The main limitations in this study are the weak statistical differences found in the qualitative data. Multiple attribute levels have a significance level > 0.05. A mistake was made in determining the minimum number of respondents needed for a DCE analysis. By using the rule of thumb of Orme, a minimum sample size of 84 respondents is needed for the DCE analysis in this study. Multiple attribute levels are not significant in the total preferences of this study population. Because this study maintains three DCE analyses (a DCE analysis for each risk group), a total minimum population of 252 (3 × 84 respondents per perception group) was needed. Therefore, no significant statistical differences could be found between the risk perception groups. However, achieving this number of respondents (equally divided into the three risk perception groups) would require a larger number than 252 breast cancer survivors. This is due to the different risk perception groups that are not equally distributed. The respondent that underestimate their risk represents approximately 58.4% of the total population, the respondents with the correct risk perception group represents approximately 12.3% of the total population and the respondents that overestimate their risk represents approximately 29.2% of the total population.
4.2.2 Discrete choice experiment design
Earlier research, that also performed a DCE, showed that patients have a preference for an alternating combination of follow-up with a breast cancer nurse and a surgeon (12). However, they referred the breast cancer nurse and the nurse practitioner as breast cancer nurses in their scenarios. Therefore, it could occur that respondents did not know the difference regarding the description of a breast cancer nurse when choosing a scenario. This research did not merge the two healthcare professionals as breast cancer nurses and the researcher noticed that some respondents did not know the difference between a nurse practitioner and a breast cancer nurse. Therefore, it is possible that some respondents thought they were the same healthcare professional when they chose their preferred scenarios. The nurse practitioner was the second most preferred healthcare professional in the quantitative data. The healthcare professional was the second most important attribute when patients chose their scenarios. Therefore, it is possible that the coefficient of the surgeon and breast cancer nurse is overestimated and that the coefficient of the nurse practitioner is underestimated. This would correspond with the qualitative data, which showed that the nurse practitioner is the most preferred healthcare professional.
4.2.3 Psychological and physical symptoms
30
Also some difficulties occurred in determining the degree of physical and psychological symptoms. Some respondents did not know exactly the degree of the symptoms they endured in the beginning of the follow-up or they had difficulties to distinguish a certain symptom because they had other chronic illnesses. Bias could also occur in determining the symptom groups. A cut-off point is determined in the total sum of the physical and psychological symptoms, in which respondents that scored lower than 40 were coded as a group with symptoms and respondent that scored above 40 are coded as a group without symptoms. This cut-off point is based on an assumption of this study. The calculation of this scoring is shown in Appendix 6.4 Recoding the data.
4.2.4 Risk perception and fear of recurrence
All respondents completed the questionnaire after their follow-up consult. Research showed that patients are less worried, anxious and frightened after the follow-up consult (11). Therefore the risk perception of a breast cancer recurrence could be influenced. Especially respondents that are currently attending their follow up between 1–5 years underestimate or overestimate their risk of a recurrence. Earlier research showed that patients are often inaccurate in their perception of risk (29-31). Research shows that the risk of a recurrence is between 20-30% in the first five years and decreases over the years (25). This study classified the patients in different risk perception groups based on their perceived perception of risk and the amount of years they are currently attending their follow-up. However, the risk of local regional recurrence depends on various factors such as age, tumor size and nodal status (25). This study did not take into account the tumor size and nodal status of patients. Patients who had a larger tumor size or more infected nodals could have a higher risk of recurrence. Therefore, this study could misplace patients in risk perception groups. Patients could be categorized as respondents that overestimate or underestimate their risk, while in reality they respectively did not overestimate or underestimate their risk of a recurrence. Besides the perception of risk of a recurrence and psychological and physical impairments, fear of recurrence increases economic and social state that are associated with breast cancer (22). This study did not take into account the social or the economic state of the respondent.
4.2.5 Data collection
31
4.2 Recommendation
To our knowledge this is the first study that examined the relation between risk perception and the follow-up preferences of breast cancer patients. Risk perception is an important aspect to examine because inaccurate perception about risk can have important behavioral and psychological consequences. To determine the risk perception this study used the risk perception based on research done by Gagnon et al (29). There are multiple studies that examined the risk perception of breast cancer patients and there is a large inconsistency in how perception of risk should be assessed. Some studies that measured the risk perception suggest that women dramatically overestimate their risk of having breast cancer while other studies conclude they underestimate it (30, 31). In future research, studies could use different risk perception methods to decrease bias. Future research could investigate the difference between perceived risk and actual risk of a recurrence in relation with the patients´ follow-up preferences. Also future studies should include the economic state and social status of patients, because these factors influence the fear of recurrence.
As mentioned in the discussion, the number of respondents with anxiety and depression symptoms in this study is larger than literature suggests. Therefore, bias regarding psychological and even the physical questions could occur in this study. To determine psychological and physical symptoms, future research should use valid instruments to determine the degree of these symptoms. By doing this, a more accurate relation between risk perception and the symptoms could be determined.
Also a recommendation could be made regarding the DCE design. This study used 24 full profile hypothetical DCE scenarios. The researcher noticed that respondents, especially older patients, had difficulties with these questions. By maintaining a partial profile with fewer attributes shown in each scenario, the cognitive burden for the patients could be decreased. However, using partial profile scenarios would increase the number of DCE questions for determining the exact coefficients of the attribute levels and could therefore increase the cognitive burden. Therefore, future research should first use a questionnaire with partial DCE scenarios and a questionnaire with full profile DCE scenarios during the pilot test to determine which type of profile patients will find least difficult.
32
4.3 Conclusion
33
5.
Literature
1. Gommer AM. Borstkanker: incidentie, prevalentie en sterfte naar leeftijd en geslacht Volksgezondheid Toekomst Verkenning, Nationaal Kompas Volksgezondheid.2011 [2/11/2015]. Available from:
http://www.nationaalkompas.nl/gezondheid-en-ziekte/ziekten-en-
aandoeningen/kanker/borstkanker/cijfers-longkanker-prevalentie-incidentie-en-sterfte-uit-de-vtv-2010-kopie-kopie/.
2. Bijlsma R, van der Wall E, Witkamp A. De behandeling van borstkanker. Huisarts & Wetenschap. 2011;54(6):328–32.
3. Kankerbestrijding K. Kanker in Nederland. Trends, prognoses en implicaties voor zorgvraag. Signaleringscommissie Kanker van KWF Kankerbestrijding. 2004.
4. Dewar JA, Kerr GR. Value of routine follow up of women treated for early carcinoma of the breast. British Medical Journal. 1985;291(6507):1464-7.
5. Grunfeld E, Mant D, Yudkin P, Adewuyi-Dalton R, Cole D, Stewart J, et al. Routine follow up of breast cancer in primary care: randomised trial. British Medical Journal. 1996;313:665 - 9.
6. NABON. Richtlijn Mammacarcinoom. Vereniging van Integrale Kankercentra, 2008.
7. Kwast ABG, Drossaert CHC, Siesling S. Breast cancer follow-up: from the perspective of health professionals and patients. European Journal of Cancer. 2013;22:754-64.
8. Grandjean I, Kwast ABG, de Vries H, Klaase J, Schoevers WJ, Siesling S. Evaluation of the adherence to follow-up guidelines for women with breast cancer. European Journal of Oncology Nursing. 2012;16:281-5.
9. Rojas MP, Telaro E, Russo A, Moschetti L, Coe L, Fossati R, et al. Follow-up strategies for women treated for early breast cancer. Cochrane Database of Systematic Reviews. 2009;25, 1-23. 10. de Bock GH, Bonnema J, Zwaan RE, van de Velde CJH, Stiggelbout AM. Patient's needs an preferences in routine follow-up after treatment for breast cancer. British Journal of Cancer. 2004;90:1144-50.
11. Renton JP, Twelves CJ, Yuille FAP. Follow-up in women with breast cancer: The patients' perspective. Elsevier Sciente Ltd. 2002;11:257-61.
12. Kimman ML, Dellaert BGC, Boersma LJ, Lambin P, Dirksen CD. Follow-up after treatment for breast cancer: One strategy fits all? An investigation of patient preferences using a discrete choice experiment. 2010;49:328-37.
13. Montgomery DA, Krupa K, Wilson C, Cooke TG. Patients' expectations for follow-up in breast cancer - A preliminary, questionnaire-based study. Elsevier. 2008;17(4):347-52.
14. Maguire P. Psychological aspects [ABC of breast diseases]. British Medical Journal. 1994;309(6969):1649-52.
15. Meyer L, Aspegren K. Long-term psychological sequelae of mastectomy and breast conservering treatment for breast cancer. Acta Oncologica. 1989;28:11-3.
16. Bower JE. Behavorial symptoms in breast cancer patients and survivors: Fatique, insomnia, depression and cognitive disturbance. Clinical Oncology. 2008;26(5):768-77.
17. Watts SC, Bhutani GE, Stout IH, Ducker GM, Cleator PJ, McGarry PJ, et al. Mental heath in older adult recipients of primary care services: is depression the key issue? Identification, treatment and the general practioner. International journal of geriatric psychiatry. 2002;17:427-37.
18. Karakoyun-Celik O, Gorken I, Sahin S, Orcin E, Alanyali H, Kinay M. Depression and anxiety levels in woman under follow-up for breast cancer: relationship to coping with cancer and quality of life. Medical Oncology. 2010;27:108-13.
19. Pennery E, Mallet J. A preliminary study of patients' perceptions of routine follow-up after treatment for breast cancer European Journal of Oncology Nursing. 2000;4(3):138-45.
34 21. Vickberg SM. The Concerns About Recurrence Scale (CARS): A Systematic Measure Of
Women's Fears About the Possibility of Breast Cancer Recurrence. Ann Behav Med. 2003;25(1):16-24.
22. Lebel S, Beattie S, Ares I, Bielajew C. Young and Worried: Age and Fear of Recurrence in Breast Cancer Survivors. Health Psychology. 2013;32(6):695-705.
23. Mehnert A, Berg P, Henrich G, Herschbach P. Fear of cancer progression and cancer-related intrusive cognitions in breast cancer survivors. Psycho-Oncology. 2009;18:1273-80.
24. Sobin LH, Wittekind CH. TNM Classification of malignant tumors, sixth edition: UICC; 2002. 25. Clemons M, Danson S, Hamilton T, Goss P. Locoregionally recurrent breast cancer: incidence risk factors and survival. Cancer Treatment reviews. 2001;27:67 - 82.
26. Piccart MJ, Valeriola D, Paridaens R, Balikdjian D, Mattheiem WH, Loriaux C, et al. Six-Year Results of a Multimodality Treatment Strategy for Locally Advanced Breast Cancer. Cancer. 1988;62(12):2501 - 6.
27. Merajver SD, Weber BL, Zhang CR, Strawderman M, Calzone KA, LeClaire V, et al. Breast conservation and prolonged chemotherapy for locally advanced breast cancer: the University of Michigan Experience. Clinical Oncology. 1997;8:2873 - 81.
28. Leventhal H, Diefenbach M, Leventhal EA. Illness Cognition: Using Common Sense to Understand Treatment Adherence and Affect Cognition Interactions. Cognitive Therapy and Research. 1992;6(2):143-63.
29. Gagnon P, Massie MJ, Kash KM, Gronert M, Simkovich Heerdt A, Brown K, et al. Perception of breast cancer risk and psychological distress in women attending a surveillance program. Psycho-Oncology. 1996;5.
30. Hopwood P. Breast cancer risk perception: what do we know and understand? British Cancer Research. 2000;2(8):387-91.
31. Woloshin S, Schwartz LM, Black WC, Welch G. Women's Perceptions of Breast Cancer Risk: How You Ask Matters. Medical Decision Making. 1999;19:221-9.
32. Slovic P. Perception of Risk. American Association for the Advancement of Science. 1987;236(4799):280-5.
33. Beaver K, Luker KA. Follow-up in breast cancer clinics: reassuring for patients rather than detecting recurrence. Psycho-Oncology. 2005;14:94-101.
34. Ryan M, Farrar S. Using conjoint analysis to elicit preferences for health care. British Medical Journal. 2000;320:1530-3.
35. Bridges JFP, Hauber AB, Marshall D, Lloyd A, Prosser LA, Regier DA, et al. Conjoint Analysis Applications in Health-a Checklist: A Report of the ISPOR Good Research Practices for Conjoint Analysis Task Force. Value in health : the journal of the International Society for Pharmacoeconomics and Outcomes Research. 2011;14(4):403-13.
36. Orme BK. Getting Started with Conjoint Analysis: Strategies for Product Design and Pricing Research. Madison , WI: Research Publishers LLC. 2006.
37. van der Peet E. Een literatuurstudie naar de gevolgen van kanker. Herstel Balans Gezondheidsbevordering en revalidatie voor kankerpatienten. 2005.
38. Peled R, Carmil D, Siboni-Samocha O, Shoham-Vardi I. Breast cancer, psychological distress and life events among young women. BMC Cancer. 2008;8(245):1-6.
39. Schover LR, Yetman RJ, Tuason LJ, Meisler E, Esselstyn CB, Herman RE, et al. Partial
Mastectomy and Breast Reconstruction - A Comparison of Their Effects on Psychosocial Adjustment, Body Image, and Sexuality. Journal of the National Cancer Institute. 1995;75(1):54-63.
40. Grunfeld E, Fitzpatrick R, Mant D, Yudkin P, Adewuyi-Dalton R, Stewart J, et al. Comparison of breast cancer patient satisfaction with follow-up primary care versus specialist care: results from a randomized controlled trial. British Journal of General Practice. 1999;49:705-10.
35 42. Blinman P, King M, Norman R, Viney R, Stockler MR. Preferences for cancer treatments: an overview of methods and applications in oncology. Annals of Oncology. 2012;23:1104-10.
43. Torrance GW, Feeny D, Furlong W. Visual Analog Scales: Do They Have a Role in the Measurement of Preferences for Health States? 2001;21(4):329-34.
44. Viney R, Lancsar E, Louviere J. Discrete choice experiments to measure consumer preferences for health and healthcare. Expert Rev Pharmacoeconomics Outcomes Res. 2002;2(4):89-96.
45. Ryan M, Gerard K. Using discrete choice experiments to value health care programmes: current practice and future research reflections. Health Economics and Health Policy. 2003;2(1):55-64.
46. Ryan M, Bate A, Eastmond CJ, Ludbrook A. Use of discrete choice experiments to elicit preferences. Quality in Health Care. 2001;10:55-60.
47. Salkeld G, Solomon M, Butow P, Short L. Discrete-choice experiment to measure patient preferences for the surgical management of colorectal cancer. british Journal of Surgery. 2005;92(6):742-7.
48. Lancsar E, Donaldson C. Discrete choice experiment in health economics European Journal of economics 2005;6(4):314-6.
49. Mühlbacher A, Lincke H-J, Nübling M. Evaluating patients' preferences for multiple myeloma therapy, a Discrete-Choice-Experiment. GMS Psych-Medicine. 2008;5(Doc10).
50. Ryan M, Farrar S. Using conjoint analysis to elicit preferences for health care. British Medical Journal. 2000;320(7248):1530-3.
36
6.
Appendix
6.1 Preferences measure instruments
The preference of patients can be assessed by different methods. There are general methods, such as ranking or rating or more specific methods such as standard gamble (SG), time trade-off (TTO), visual analogue scale (VAS) and discrete choice experiment (DCE). A difference between general methods and specific methods (with exception of the visual analogue scale) is that general methods do not involve a trade-off between different health states or scenarios (42).
The main limitation of the SG is that it is cognitively demanding for respondents, because it requires the consideration of complex probabilities, which often results into high valuations of a scenario. A limitation of the TTO is that it only reflects decisions under certainty, not uncertainty
(42)
. The VAS has several limitations. Just like the TTO technique, the VAS only reflects decisions under certainty and there is no trade-off between different scenarios. The VAS technique as a sole method is considered as inadequate, but combined with the SG or TTO it can play a useful role (43).Another technique to elicit the preference of patients is conjoint analysis (CA). CA consists of different methods; ranking, rating and the discrete choice experiments. The aim of a CA is to determine the value that consumers give on a certain product or service, so that these products can be optimized. In the ranking method the respondent must rank different scenarios on an order of attractiveness from bad to good. In the rating method scenario the respondent has to rate each scenario individual on attractiveness and in the discrete choice experiment the respondent is asked to choose their preferred scenario from two or more scenarios (44). Originally CA is developed in the field of economics and marketing, but there is growing demand for discrete choice experiments in health economics, because it allows for analysis of preferences for multiple attributes services in the healthcare (45).
37
6.2 Construction of the DCE
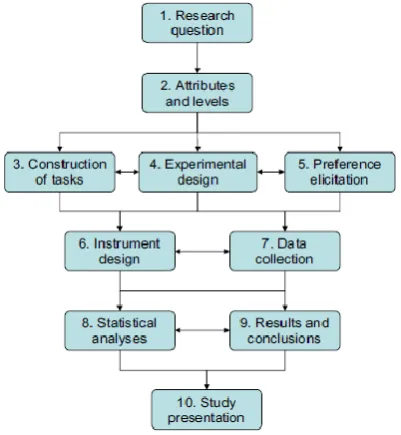
Bridges et al made a checklist for conjoint analysis in healthcare. This checklist consists of different steps that are needed for producing good conjoint-analysis in healthcare (35). This checklist is visible in Figure 3.
[image:37.595.77.278.149.367.2]In this checklist there are ten different steps visible, certain steps such as step 1 research question are already determined. Steps 2 till 4 are explained below.
Figure 3. Checklist of Bridges et al
Step 2. Attributes and levels