Munich Personal RePEc Archive
Workplace perception and
job-satisfaction of older workers
Raab, Roman
Keele University
2016
Workplace Perception and Job-satisfaction of
Older Workers
Roman Raab
∗April 26, 2016
Abstract
This paper addresses the question to what extent workplace perception affects subjective well-being of older workers in their jobs. We use several dimensions of workplace perception in order to estimate their importance for job-satisfaction. Our results show that older workers’ happiness in the job strongly depends on opportunities to develop new skills, receiving support in difficult situations, and recognition for their work. These dimensions of workplace attributes are merely psychological by nature; in contrast, salary opportunities and socio-demographic dimensions do not appear to have a strong impact on job-satisfaction, if at all.
JEL Classification: J81 - J28 - J32.
Keywords: Working Conditions - Job-satisfaction; Related Public
Pol-icy - Non-wage Labor Costs and Benefits
∗Affiliation: Keele University, Keele, Staffordshire, United Kingdom ST5 5BG. E-mail:
1
Introduction
The influence of workplace perception on subjective well-being in the job has been largely investigated, but not in particular for older workforce. We study the impact of a selected set of self-perceived workplace variables on job-satisfaction. This paper attempts to close this gap in the literature by identifying more psychological factors that increase or decrease happiness of older workers.
Legislature in many countries has identified the need for targeting policies to keep older workers in the job. Demographic shifts in the age distributions of devel-oped countries have caused pension systems based on intergenerational redistribu-tion to experience long-term financing issues. Early retirement and lack of demand for older workers have been deteriorating the finances of pay-as-you-go pensions even more. While factors like health and financial incentives were identified to be important considerations in the retirement decision, relatively few studies have dealt with the workplace perception as such and its influence on job-satisfaction of the pre-retirement workforce. The debate about increasing retirement ages often raises the question if workplaces for older workers are designed in a way to hold them in job. This study is a first step in a sequence of policy issues to promote labor supply in the older workforce.
Studies have so far looked at the effect of retirement on subjective well-being, but not at factors that determine subjective well-being of older workers. There-fore, we add to this literature by investigating job-satisfaction of older workforce using a rich set of variables from a most recent survey of older people in Europe. We focus on the influence of workplace perception dimensions on subjective well-being in one’s job. These dimensions are self-reported and subjective by nature; we use control variables including objective workplace characteristics, the earn-ings position, and socio-economic attributes. The overall aim of this work is to micro-estimate the factors older workers consider important in their domain of job-satisfaction.
We build upon the standard methodology of estimating job-satisfaction equa-tions, proposed for instance by authors like Clark and Oswald (1996). A rich set of workplace perception variables is added to the standard estimation.
on self-perceived workplace attributes. Along with health, these attributes are main contributors to job-satisfaction of older workers. Traditional job attributes seem to be of smaller importance, e.g., income, hours of work, and other socio-demographic descriptors.
We organize this paper as follows. Section 2 discusses the conceptual framework and literature on subjective well-being in relation to the older workforce, but also in general. Section 3 outlines the data and the empirical strategy. In section 4, we present our results; section 5 concludes.
2
Conceptual framework and related literature
The termssubjective well-being,happiness, andsatisfaction are often used as more ”intuitive” interpretations ofutility. This paper utilizes all of these terms as equiv-alents. Subjective well-being may be investigated for economic agents with idiosyn-cratic preferences and with a reference point of interest for different domains in life or life as a whole. Objective well-being, on the other hand, is deployed as a proxy for wealth or income, typically expressed and compared using a cardinal scale. There are several dimensions or domains (Bonsang and Klein, 2012) into which overall subjective well-being may be decomposed; these domains may in-clude income, leisure time, one’s social network, one’s job, etc. Here, we consider the domain of someone’s job or work place, often referred to as job-satisfaction.
Economic theory models job-satisfaction using a simple utility function for a representative agent. Previous work, for instance by Hamermesh (1977), Free-man (1978) or Clark and Oswald (1996), serve as a guideline for specifying the arguments of the workplace-domain utility function:
ui =f(m, m,1−l, δ, ρ) (1)
Functionui represents a worker’s utility related to the workplace. We call this worker i;m is the worker’s net wage, mis their comparison wage, i.e., i’s position
in the wage distribution), l expresses the agent’s normalized hours of work per
self-perceived workplace dimensions.
In a dynamic setting, the theory of subjective well-being over the life-cycle has been outlined by Easterlin (2001). He explains why satisfaction does not necessarily go up when income increases. Furthermore, Easterlin (1995) stresses that within a population, people with higher incomes are, on average, happier. However, raising the incomes of all does not increase the happiness of all. These stylized facts are suggested by data collected in surveys, in a number of countries. People develop higher aspiration levels as income rises over the life-cycle. These norms or aspiration levels increase proportionally to income. The more income people can avail of, the less happy people are with material or immaterial goods affordable with their past income level; aspirations increase. This aspiration effect works in the opposite direction of income effect, and might even mitigate it. The overall effect is, however, theoretically ambiguous, depending on the relative sizes of the two effects. In this paper, we include these important findings by using age as a proxy for aspiration levels, since the level of aspirations as such is latent.
Also, as Stutzer (2004) points out, individuals’ well-being depend on their rela-tive levels of well-being rather than their absolute levels. In a direct empirical test, it is found that higher income aspirations reduce someone’s utility, ceteris paribus. Individual data on reported satisfaction with life are used as a proxy measure for utility, and income evaluation measures are applied as proxies for people’s aspira-tion levels. Consistent with processes of adaptaaspira-tion and social comparison, income aspirations increase with individuals’ income as well as with the average income in their social networks. We therefore include an income variable that portrays an individual’s position in the income distribution; due to a measurement issue of income across waves in the data used and discussed below, we will not include the absolute levels of income as a separate variable.
perception variables. The present study attempts to close this gap in the litera-ture for the sub-population of older workforce and by focusing on the domain of job satisfaction.
Abolhassani and Alessie (2013) find that unemployment has a strong nega-tive impact on subjecnega-tive well-being while voluntary retirement does as such not necessarily increase well-being. There seems to be a causal influence of overall well-being on retirement. Yet, reversing this chain of causality does empirically not hold. The findings by Bonsang and Klein (2012) go into the same direction; while overall subjective well-being does not increase upon retirement, leisure sat-isfaction increases and income satsat-isfaction decreases at the same time. So, for retirement policies, an important missing piece in this nexus is job-satisfaction of workers at pre-retirement age.
Regarding findings on older workers’ job satisfaction, Eichar et al. (1991) point out, that this population group considers autonomy in their job and their job to be meaningful as outstandingly important for their well-being. Another work on the determinants of happiness emphasizes the importance of perceived income fairness in a society (Bjørnskov et al., 2013).
Turning to the perspective of labor demand, Taylor and Walker (1998) de-scriptively analyze employers’ attitudes towards older workers. They find some evidence on the presence of ageism in employers. In fact, employers often per-ceive older workers as inflexible and less able to do heavy physical work. Together with unhappiness in the job, employers’ negative attitudes towards older work-force complement the literature on potential ”push factors” into retirement (see for instance Preter et al. (2013)).
inten-sity, physical effort and probability of injury. They find that countries with high work-role outputs, in general, have high job-satisfaction scores. Furthermore, hav-ing an interesthav-ing job and havhav-ing good relations with management are the two most important work-role outputs; having an exhausting job is the most impor-tant work-role input. Also, workers in Eastern European countries tend to value high income. This paper is helpful to our study in two ways. First, it recognizes the importance of workplace perception factors, either categorized as work-role inputs or work-role outputs. Second, it demonstrates that job-satisfaction has considerable variations across countries. We take this into account by using coun-try specific effects in the regression analysis outlined below in order to capture latent social norms and perceptions inherent within a single country.
The empirical framework for the analysis in this study relies on the standard approach of multinomial ordered logit models. Ferrer-i Carbonell and Frijters (2004) use a fixed effects ordered logit model in order to estimate the effect of var-ious variables on subjective well-being. They recommend to use more personality variables often latent in the fixed effects.
3
Empirical strategy
3.1
Econometric model
We now turn to the discussion of the empirical strategy. First, we present the econometric model, then we discuss the data used for our study and the summary statistics. Finally, we clarify the expected outcomes in the estimates and the hypotheses they are based on.
We attempt to estimate the causal effect of several dimensions of workplace perception on job-satisfaction. To this end, a measurement for job-satisfaction is needed that approximates a worker’s utility in the workplace domain. The depen-dent variable is representing categories of response that exhibit a natural ordering, i.e., the degree of agreement with the survey question aski ng whether a worker is satisfied in his or her job. For this reason, the model is estimated as an ordered
logit model. The continuous metricyi underlying the categorical and ordered
the multinomial ordered logit model we use in this study is therefore as follows:
yi = β1ρi+β2xi+εi
εi ∼ F(z) =ez/(1 +ez)
yi =
1 if yi < c1.
2 if c1 ≤yi < c2.
3 if c2 ≤yi < c3.
4 if c3 ≤yi.
(2)
The dependent variable isyi; it is approximated by the observed variableJobsat, an index reporting self-perceived job-satisfaction. The over-bar indicates estimated values foryi. Jobsat embodies a worker’s response to the following survey question:
Survey question: ”All things considered, I am satisfied with my job. Would you
say you strongly agree, agree, disagree or strongly disagree?”
The possible answer categories which relate to each other in an ordered way are coded using the following values; they correspond to the cases in (2):
1. Strongly agree,
2. Agree,
3. Disagree,
4. Strongly disagree.
Vector ρ denotes workplace perception variables; x is a vector of controls
in-cluding an agents position in the income distribution, hours of work, age, sex,
education, marital status, health, number of kids, and country. Moreover, ǫ is an
error term following a logistic distribution with the cumulative distribution func-tionF(z). Values ofcare auxiliary parameters of the latentyi. These ”cut-points”
provide the link between the discrete categories of Jobsat and the corresponding
3.2
Data
For the empirical analysis, data from the Survey of Health, Aging and Retirement in Europe (SHARE) are used. Included are observations from waves 1, 2, and 4 in order to construct a panel of older workers, not yet retired, in the age interval 50 through 70. We include people reporting to be an employee or civil servant at the time of the interview. Interviews for wave one were conducted in 2004 and 2005, for wave 2 in 2006 and 2007 (Israel in 2009 and 2010), and for wave four in 2011 (Poland collected all interviews in 2012, in Germany, Estonia and the Czech Republic, a minority of interviews are from 2010 and 2012). Wave 3 was designed to reconstruct work histories, and is therefore not following the standard questionnaire of other waves. The panel is unbalanced, and therefore not every person is observed in all three waves.
We now discuss the ways we dealt with some shortcomings of the data. Sev-eral observations were dropped due to missing values in key variables. From an inspection of the data, we conclude that these values are missing at random, so no imputations are attempted. In particular, we dropped an observations in case job-satisfaction was missing or unknown (3133 observations deleted). Also, particular observations were dropped if the key variables of workplace perception were un-known or not reported: physically demanding job (8 observations deleted), time pressure due to heavy workload (12 observations deleted), little freedom to de-cide how to do work (22 observations deleted), opportunity to develop new skills (21 observations deleted), support in difficult situations (66 observations deleted), received recognition for work (65 observations deleted), prospects for job advance-ment poor (231 observations deleted), job security poor (112 observations deleted), looking for early retirement (96 observations deleted), income percentile (604 ob-servations deleted). For implausible codings of gender within a unique person, one observation was deleted, years of education had 1550 missing or unknown values; furthermore, marital status (40 observations deleted), self-perceived health (2 ob-servations deleted), and number of children (39 obob-servations deleted) had some unknown or missing values.
panel is rather comprehensive in terms of countries and subpopulations within countries. However, with respect to the time dimension, the panel is rather short. Due to wave participation patterns - only 24.94 percent of observations are coming from people interviewed in all three waves - we use pooled rather than panel data estimators in the logit model specified above.
3.3
Summary statistics
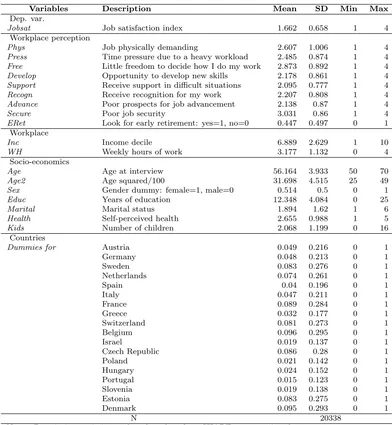
Next, we discuss summary statistics of all variables used. A description of vari-ables is reported in Table 1; the exact coding of the varivari-ables can be found in
the appendix. The mean of the dependent vaiable Jobsat is 1.662 (see Table 1),
showing a skew of the distributions towards a higher satisfaction level.
The main explanatory variables of workplace perception in someone’s main job are constructed according to the degree of agreement to the following interview questions. There are four response categories for each variable, ”strongly agree”, ”agree”, ”disagree” or ”strongly disagree”:
• Phys: My job is physically demanding.
• Press: I am under constant time pressure due to a heavy workload.
• Free: I have very little freedom to decide how I do my work.
• Develop: I have an opportunity to develop new skills.
• Support: I receive adequate support in difficult situations.
• Recogn: I receive the recognition I deserve for my work.
• Advance: My job promotion prospects/prospects for job advancement are poor.
• Secure: My job security is poor.
Table 1: Summary statistics
Variables Description Mean SD Min Max
Dep. var.
Jobsat Job satisfaction index 1.662 0.658 1 4 Workplace perception
Phys Job physically demanding 2.607 1.006 1 4
Press Time pressure due to a heavy workload 2.485 0.874 1 4
Free Little freedom to decide how I do my work 2.873 0.892 1 4
Develop Opportunity to develop new skills 2.178 0.861 1 4
Support Receive support in difficult situations 2.095 0.777 1 4
Recogn Receive recognition for my work 2.207 0.808 1 4
Advance Poor prospects for job advancement 2.138 0.87 1 4
Secure Poor job security 3.031 0.86 1 4
ERet Look for early retirement: yes=1, no=0 0.447 0.497 0 1 Workplace
Inc Income decile 6.889 2.629 1 10
WH Weekly hours of work 3.177 1.132 0 4 Socio-economics
Age Age at interview 56.164 3.933 50 70
Age2 Age squared/100 31.698 4.515 25 49
Sex Gender dummy: female=1, male=0 0.514 0.5 0 1
Educ Years of education 12.348 4.084 0 25
Marital Marital status 1.894 1.62 1 6
Health Self-perceived health 2.655 0.988 1 5
Kids Number of children 2.068 1.199 0 16 Countries
Dummies for Austria 0.049 0.216 0 1 Germany 0.048 0.213 0 1 Sweden 0.083 0.276 0 1 Netherlands 0.074 0.261 0 1 Spain 0.04 0.196 0 1 Italy 0.047 0.211 0 1 France 0.089 0.284 0 1 Greece 0.032 0.177 0 1 Switzerland 0.081 0.273 0 1 Belgium 0.096 0.295 0 1 Israel 0.019 0.137 0 1 Czech Republic 0.086 0.28 0 1 Poland 0.021 0.142 0 1 Hungary 0.024 0.152 0 1 Portugal 0.015 0.123 0 1 Slovenia 0.019 0.138 0 1 Estonia 0.083 0.275 0 1 Denmark 0.095 0.293 0 1
N 20338
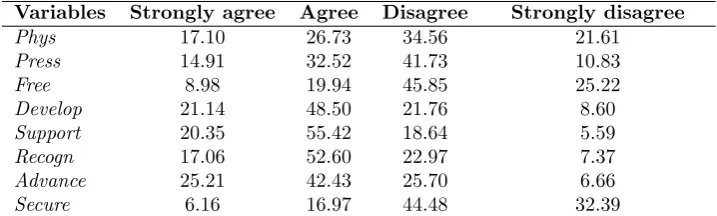
skills in their job. They receive support in difficult situations and recognition for their work. Job security is perceived as being high. On the other hand, workers seem to be pressurized and have poor prospects for job advancement. In terms of responses, 56.17 percent of observations report to disagree that their job was physically demanding, even 71.07 percent disagree that they had little freedom to decide how to do their work. 69.64 percent are in a situation where new skills may be developed, 75.77 percent receive support in difficult situations, and 69.66 percent the recognition they deserve. Concerning job security, 77.38 percent of observations report that their job is secure. Yet, 67.64 percent of observations fall into the categories of ”agree” or ”strongly agree” with not having the prospects of promotion or advancement in their job. Almost half the observations, 47.43 percent, report constant pressure due to heavy workloads.
An additional variable related to one’s employment isERet, coded as a dummy.
The underlying question for this variable is ”Thinking about your present job, would you like to retire as early as you can from this job?” 44 percent of respondents answer this question with ”yes” which seems to be quite a high share. Table 1 reports descriptive statistics for other covariates used. Workers are on average in the 7th income percentile. The variableWH is values of 0 if less than 10 hours are worked, 1 if less than 20, 2 if less than 30, and 3 if less than 40 hours are worked per week. Value 4 indicated hours greater or equal to 40. On average, people work between 30 and 40 hours per week.
The mean age of respondents is 56.164 years with the youngest respondents being 50 years old, the oldest are 70 years of age. 51 percent of the sample is female, years of education are on average 12.348 years. The unordered categorical variable
Marital represents a person’s family situation, where a value of 1 means married and living together with spouse, 2 means registered partnership, 3 is married, but living separated from spouse, 4 is never married, 5 means divorced, and 6 is widowed. The largest portion of respondents, 74.22 percent report to fall into the
first category. Health is self reported health where 1 is excellent, and 5 means
Table 2: Workplace perception variables, shares of response categories
Variables Strongly agree Agree Disagree Strongly disagree
Phys 17.10 26.73 34.56 21.61
Press 14.91 32.52 41.73 10.83
Free 8.98 19.94 45.85 25.22
Develop 21.14 48.50 21.76 8.60
Support 20.35 55.42 18.64 5.59
Recogn 17.06 52.60 22.97 7.37
Advance 25.21 42.43 25.70 6.66
Secure 6.16 16.97 44.48 32.39
Notes: Descriptive statistics are based on data from SHARE, waves 1, 2 and 4.
3.4
Hypotheses
The main focus of this paper is on workplace perception variables for which we now discuss the hypotheses about the signs on coefficient estimates hoped for. We would expect workplace the perception variables to have strong causal effects on job-satisfaction. In particular, it is tested if the coefficients on Phys, Develop,
Support, Recogn are positive, and the coefficients on Press, Free, Advance and
Secure are negative. We expect that Phys would yield a positive coefficient; in other words, a physically demanding job is perceived as positive or challenging and therefore contributes to job-satisfaction. However, we could also legitimately hypothesize that a physically demanding job is a source of discomfort with one’s job, for instance in case health deteriorating work environments are paired with a high degree of physical input required in production. Developing new skills, receiving support in difficult situations, and getting recognition for one’s work are likely to increase job-satisfaction. On the other hand, increasing pressure, little freedom, poor career advancement opportunities, and poor job security are most likely inversely related to job-satisfaction, in other words, we hypothesize that these will decreaseJobsat.
4
Results
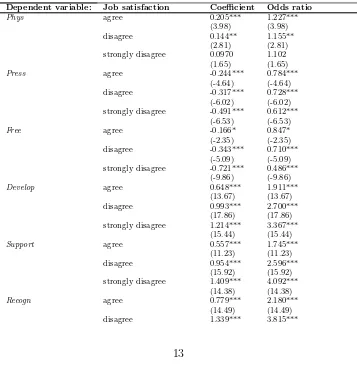
of some workplace perception variables. Since coefficients in logit regressions do not have an intuitively meaningful interpretation, we discuss here the results in terms of odds-ratios. Variables with high odds ratios and high significance levels are Develop, Support, and Recogn. Significance paired with moderately high odds ratios are Phys, Press,Free, Advance, and Secure. As an example of the extent of
the estimated magnitudes, let us consider the variable Develop. For its response
categories, Develop has odds rations of 1.911 at response ”agree” (value of 2), 2.7 at response ”disagree” (value of 3), and 3.367 at response category ”strongly dis-agree” (value of 4). So, when Develop goes from ”strongly dis-agree” to ”dis-agree”, the
odds of Jobsat going down (from strongly agree=1 towards strongly disagree=4)
[image:14.595.119.476.363.731.2]is 1.911 times higher than the odds ofJobsat going up. All odds ratios are greater than one, therefore, job-satisfaction increases as the degree of agreement with ”able to develop new skills” increases.
Table 3: Results ordered logit regression
Dependent variable: Job satisfaction Coefficient Odds ratio
Phys agree 0.205*** 1.227*** (3.98) (3.98) disagree 0.144** 1.155**
(2.81) (2.81) strongly disagree 0.0970 1.102
(1.65) (1.65)
Press agree -0.244*** 0.784*** (-4.64) (-4.64) disagree -0.317*** 0.728***
(-6.02) (-6.02) strongly disagree -0.491*** 0.612***
(-6.53) (-6.53)
Free agree -0.166* 0.847* (-2.35) (-2.35) disagree -0.343*** 0.710***
(-5.09) (-5.09) strongly disagree -0.721*** 0.486***
(-9.86) (-9.86)
Develop agree 0.648*** 1.911*** (13.67) (13.67) disagree 0.993*** 2.700***
(17.86) (17.86) strongly disagree 1.214*** 3.367***
(15.44) (15.44)
Support agree 0.557*** 1.745*** (11.23) (11.23) disagree 0.954*** 2.596***
(15.92) (15.92) strongly disagree 1.409*** 4.092***
(14.38) (14.38)
(21.66) (21.66) strongly disagree 1.810*** 6.109***
(19.90) (19.90)
Advance agree 0.0531 1.055 (1.23) (1.23) diagree -0.210*** 0.811***
(-4.29) (-4.29) strongly disagree -0.295*** 0.745***
(-3.54) (-3.54)
Secure agree 0.110 1.116
(1.36) (1.36) disagree -0.154* 0.857*
(-2.01) (-2.01) strongly disagree -0.500*** 0.607***
(-6.25) (-6.25)
ERet 0.639*** 1.895*** (19.37) (19.37)
Inc 2nd 0.0424 1.043 (0.41) (0.41) 3rd -0.0954 0.909
(-0.98) (-0.98) 4th -0.0311 0.969
(-0.34) (-0.34) 5th -0.106 0.899
(-1.21) (-1.21) 6th -0.145 0.865
(-1.71) (-1.71) 7th -0.103 0.902
(-1.25) (-1.25) 8th -0.0757 0.927
(-0.95) (-0.95) 9th -0.0433 0.958
(-0.54) (-0.54) 10th -0.157 0.855
(-1.93) (-1.93)
WH 10≤W H <20 0.240* 1.272*
(2.42) (2.42)
20≤W H <30 0.0786 1.082
(0.91) (0.91)
30≤W H <40 0.0411 1.042
(0.53) (0.53) 40≤W H -0.0404 0.960
(-0.55) (-0.55)
Age 0.132 1.141
(1.38) (1.38)
Age2 -0.136 0.872
(-1.63) (-1.63)
Sex -0.0166 0.984
(-0.51) (-0.51)
Educ 0.00273 1.003 (0.63) (0.63)
Marital reg.partnership 0.0674 1.070 (0.71) (0.71) married, living separated 0.0662 1.068
(0.50) (0.50) never married 0.0201 1.020
(0.31) (0.31) divorced 0.0552 1.057
(1.07) (1.07) widowed -0.0704 0.932
Health very good 0.213*** 1.237*** (3.98) (3.98) good 0.424*** 1.528***
(8.10) (8.10) fair 0.470*** 1.599***
(7.53) (7.53) poor 0.644*** 1.904***
(5.34) (5.34)
Kids -0.0375** 0.963** (-2.71) (-2.71)
Countries Austria -0.130 0.878 (-1.43) (-1.43) Germany 0.216* 1.241* (2.42) (2.42) Sweden 0.212** 1.236**
(2.66) (2.66) Netherlands 0.482*** 1.619***
(6.21) (6.21) Spain 0.505*** 1.657***
(5.56) (5.56) Italy 0.269** 1.308**
(2.91) (2.91) France 0.0522 1.054
(0.66) (0.66) Greece 0.673*** 1.960***
(6.59) (6.59) Switzerland -0.174* 0.840*
(-2.15) (-2.15) Belgium 0.00702 1.007
(0.09) (0.09) Israel 0.483*** 1.620***
(3.55) (3.55) Czech Republic 0.127 1.135
(1.65) (1.65) Poland 0.312** 1.366**
(2.68) (2.68) Hungary 0.145 1.156
(1.17) (1.17) Portugal 0.430** 1.538**
(3.05) (3.05) Slovenia 0.276* 1.318*
(2.46) (2.46) Estonia 0.671*** 1.956***
(8.12) (8.12) Denmark omitted 1
Cutpoints c1 4.666
(1.70)
c2 8.236**
(3.01)
c3 10.12***
(3.70)
N 20338 20338 Log pseudo- likelihood -15645.053
Waldχ2
, 69 df 4735.86 Prob> χ2
0.0000 Correctly pred. outcomes 0.653 PseudoR2
0.1845
Notes: t statistics in parentheses. Significance levels: * p<0.05, ** p<0.01, *** p<0.001.
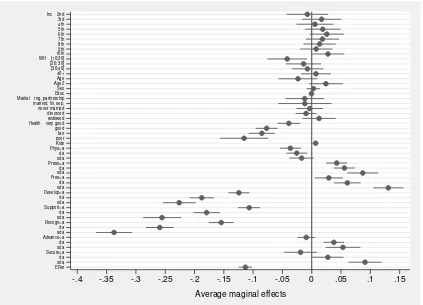
Inc 2nd 3rd 4th 5th 6th 7th 8th 9th 10th WH [10;20[ [20; 30[ [30;40[ 40+ Age Age2 Sex Educ Marital reg. partnership married, liv, sep. never married diivorced widowed Health very good good fair poor Kids Phys=a da sda Press=a da sda Free=a da sda Develop=a da sda Support=a da sda Recogn=a da sda Advance=a da sda Secure=a da sda ERet
-.4 -.35 -.3 -.25 -.2 -.15 -.1 -.05 0 .05 .1 .15
[image:17.595.89.512.101.406.2]Average maginal effects
Figure 1: Average marginal effects and their confidence intervals
Health and ERet have quite a strong effect on job-satisfaction, while working hours, kids and countries have a moderate effects. Income, age, sex, education and marital status are of minor importance in their impact or lack significance.
Looking at the overall goodness of fit of the estimated model, the regression results imply a share of 65.3 percent correctly predicted outcomes compared to the overall number of observations.
(Cameron and Trivedi, 2005). Again, workplace perception variables have strong
marginal effects. Let us consider the variable Develop again. In case the
depen-dent variable has the outcome ”1”, a person strongly agrees to experience a high
job-satisfaction. When now the response for Develop goes from ”strongly agree”
to ”agree”, the change in probability to report a high job-satisfaction decreases by
-12.35 percentage points. WhenDevelop goes from ”strongly agree” to ”disagree”,
the probability of having a high job-satisfaction decreases by -18.77 percentage
points. This demonstrates that Develop is a strong determinant of Jobsat. The
majority of the workplace perception variables have significant marginal effects, and their magnitudes are great.
Turning to the marginal effects for the other covariates, the extent of the effects are mainly smaller, and the only significant variables areWH at response category one, Health at all response categories, Kids, ERet, and most country dummies. Overall, marginal effects are strongest for the workplace perception variables.
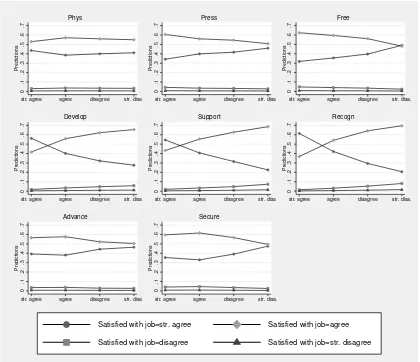
Let us now turn to the discussion of predicted probabilities based on the esti-mates. Figure 2 pictures the matrix of predicted probabilities of the four possible outcomes for job-satisfaction at different response categories of the workplace per-ception variables while all other variables are at their means. The probability that
someone is very satisfied in their job is highest for Recogn being very important
with more than 60 percent. Reporting lower levels of agreement forRecogn lowers
this probability which is intuitively plausible. The same pattern applies toDevelop
andSupport. The probability of being just satisfied with one’s job increases in the strength of non-agreement for these variables. The counterfactual situation that someone reports to (strongly) disagree withRecogn increases the probability of low job-satisfaction. We may interpret this as a strong influence of theses variables on job-satisfaction.
For the more negatively connoted variables Phys, Press, Free, Advance, and
0 .1 .2 .3 .4 .5 .6 .7 Predictions
str. agree agree disagree str. disa.
Phys 0 .1 .2 .3 .4 .5 .6 .7 Predictions
str. agree agree disagree str. disa.
Press 0 .1 .2 .3 .4 .5 .6 .7 Predictions
str. agree agree disagree str. disa.
Free 0 .1 .2 .3 .4 .5 .6 .7 Predictions
str. agree agree disagree str. disa.
Develop 0 .1 .2 .3 .4 .5 .6 .7 Predictions
str. agree agree disagree str. disa.
Support 0 .1 .2 .3 .4 .5 .6 .7 Predictions
str. agree agree disagree str. disa.
Recogn 0 .1 .2 .3 .4 .5 .6 .7 Predictions
str. agree agree disagree str. disa.
Advance 0 .1 .2 .3 .4 .5 .6 .7 Predictions
str. agree agree disagree str. disa.
Secure
Satisfied with job=str. agree Satisfied with job=agree
[image:19.595.89.509.101.463.2]Satisfied with job=disagree Satisfied with job=str. disagree
Figure 2: Predicted probabilities
5
Conclusions
im-portant role along with workplace perceptions in the determination of the degree of job-satisfaction.
References
Abolhassani, M. and Alessie, R. (2013). Subjective well-being around retirement. De Economist, 161(3):349–366.
Aristovnik, A. and Jakliˇc, K. (2013). Job satisfaction of older workers as a factor of promoting labour market participation in the EU: The case of Slovenia. University Library of Munich, Germany, MPRA Paper.
Bjørnskov, C., Dreher, A., Fischer, J. A., Schnellenbach, J., and Gehring, K. (2013). Inequality and happiness: When perceived social mobility and economic reality do not match. Journal of Economic Behavior and Organization, 91:75 – 92.
Bonsang, E. and Klein, T. (2012). Retirement and subjective well-being. Journal of Economic Behavior and Organization, 83(3):311–329.
Cameron, A. C. and Trivedi, P. K. (2005).Microeconometrics: methods and applications. Cambridge University Press.
Clark, A. E. and Oswald, A. J. (1996). Satisfaction and comparison income. Journal of Public Economics, 61(3):359 – 381.
Easterlin, R. A. (1995). Will raising the incomes of all increase the happiness of all?
Journal of Economic Behavior Organization, 27(1):35–47.
Easterlin, R. A. (2001). Income and happiness: Towards a unified theory. The Economic Journal, 111(473):465–484.
Eichar, D. M., Norland, S., Michael Brady, E., and Fortinsky, R. H. (1991). The job satisfaction of older workers. Journal of Organizational Behavior, 12(7):609–620.
Ferrer-i Carbonell, A. and Frijters, P. (2004). How important is methodology for the estimates of the determinants of happiness? The Economic Journal, 114(497):641– 659.
Freeman, R. B. (1978). Job satisfaction as an economic variable. The American Eco-nomic Review, 68(2):135–141.
Groot, W. and van den Brink, H. M. (1999). Job satisfaction of older workers. Interna-tional Journal of Manpower, 20(6):343–360.
Hamermesh, D. S. (1977). Economic aspects of job satisfaction. Essays in Labor Market Analysis. New York: John Wiley, pages 53–72.
Sousa-Poza, A. and Sousa-Poza, A. A. (2000). Well-being at work: A cross-national analysis of the levels and determinants of job satisfaction.Journal of Behavioral and Experimental Economics (formerly The Journal of Socio-Economics), 29(6):517– 538.
Stutzer, A. (2004). The role of income aspirations in individual happiness. Journal of Economic Behavior and Organization, 54(1):89–109.
Appendix
The following list gives the exact codings of all variables used in the analysis:
Dependent variable
Job satisfaction index: categorical, 1=strongly agree, 2=agree, 3=disagree, 4=strongly dis-agree
Workplace perception variables
Job physically demanding: categorical, 1=strongly agree, 2=agree, 3=disagree, 4=strongly disagree
Time pressure due to a heavy workload: categorical, 1=strongly agree, 2=agree, 3=dis-agree, 4=strongly disagree
Little freedom to decide how I do my work: categorical, 1=strongly agree, 2=agree, 3=dis-agree, 4=strongly disagree
Opportunity to develop new skills: categorical, 1=strongly agree, 2=agree, 3=disagree, 4=strongly disagree
Receive support in difficult situations: categorical, 1=strongly agree, 2=agree, 3=disagree, 4=strongly disagree
Receive recognition for my work: categorical, 1=strongly agree, 2=agree, 3=disagree, 4=strongly disagree
Poor prospects for job advancement: categorical, 1=strongly agree, 2=agree, 3=disagree, 4=strongly disagree
Poor job security: categorical, 1=strongly agree, 2=agree, 3=disagree, 4=strongly disagree Look for early retirement: categorical, yes=1, no=0
Workplace variables
Income decile: categorical variable, 1 if first decile,...
Weekly hours of work: categorical variable, 0 in [0,10[ 1 in [10,20[, 2 in [20,30[, 3 in [30,40[, 4 if above 40
Socio-economic variables
Age at interview: real number Age2: Age squared/100
Sex: female=1, male=0
Country dummies
Austria: yes=1, no=0 Germany: yes=1, no=0 Sweden: yes=1, no=0 Netherlands: yes=1, no=0 Spain: yes=1, no=0 Italy: yes=1, no=0 France: yes=1, no=0 Greece: yes=1, no=0 Switzerland: yes=1, no=0 Belgium: yes=1, no=0 Israel: yes=1, no=0
Czech Republic: yes=1, no=0 Poland: yes=1, no=0
Hungary: yes=1, no=0 Portugal: yes=1, no=0 Slovenia: yes=1, no=0 Estonia: yes=1, no=0 Denmark: yes=1, no=0
Acknowledgements
I would like to acknowledge my former employer Keele University, Staffordshire, United King-dom for the funding of this research which was mainly conducted under a Fellowship of the Keele Research Institute for the Social Sciences. Also, I would like to thank my current em-ployer, the Joint Research Centre, for the opportunity to finalize this paper. This paper uses data from SHARE Waves 1, 2, and 4 (DOIs: 10.6103/SHARE.w1.260, 10.6103/SHARE.w2.260, 10.6103/SHARE.w4.111), see B¨orsch-Supan et al. (2013) for methodological details. The SHARE data collection has been primarily funded by the European Commission through FP5 (QLK6-CT-2001-00360), FP6 (SHARE-I3: RII-CT-2006-062193, COMPARE: CIT5-CT-2005-028857, SHARELIFE: CIT4-CT-2006-028812) and FP7 (SHARE-PREP: No.211909, SHARE-LEAP: N227822, SHARE M4: No.261982). Additional funding from the German Ministry of Education and Research, the U.S. National Institute on Aging (U01-AG09740-13S2, AG005842, P01-AG08291, P30-AG12815, R21-AG025169, Y1-AG-4553-01, IAG-BSR06-11, OGHA-04-064) and from various national funding sources is gratefully acknowledged (see www.share-project.org).