Munich Personal RePEc Archive
The performance effects of gender
diversity on bank boards
Owen, Ann L. and Temesvary, Judit
Hamilton College, Federal Reserve Board of Governors
7 July 2017
Online at
https://mpra.ub.uni-muenchen.de/80078/
The Performance Effects of Gender Diversity on Bank Boards
Ann L. Owen
Hamilton College; 198 College Hill Road, Clinton, NY 13323.
aowen@hamilton.edu; 315-859-4419.
Judit Temesvary1
Federal Reserve Board; 1801 K Street, Washington, DC 20006
judit.temesvary@frb.gov; 202-452-3759.
This version: July 2017
Abstract:
Previous literature has shown mixed results on the role of female participation on bank boards and bank performance: some find that more women on boards enhance financial performance, while others find negative or no effects. Applying Instrumental Variables methods to data on approximately 90 US bank holding companies over the 1999-2015 period, we argue that these inconclusive results are due to the fact that there is a non-linear, U-shaped relationship between gender diversity on boards and various measures of bank performance: female participation has a positive effect once a threshold level of gender diversity is achieved. Furthermore, this positive effect is only observed in better capitalized banks. Our results suggest that continuing the voluntary expansion of gender diversity on bank boards will be value-enhancing, provided that they are well capitalized.
Keywords: Bank performance; Gender Diversity; Instrumental Variables Estimation
JEL Codes: G21; G34; J16
1 The views expressed in this paper are solely those of the authors and shall not be interpreted as reflecting the views
of the Board of Governors of the Federal Reserve System. We are grateful to Pinar Uysal, Ayse Sapci, Pao-Lin Tien,
1 1. Introduction
Women are heavily underrepresented in leadership positions in financial services, where they generally
remain in lower-paying first or mid-level positions. While women made up 54.3 percent of the workforce
at S&P 500 finance companies in 2014, only 18.7 percent of S&P 500 finance company boards and only
2.1 percent of CEOs were women (Catalyst, 2015). Many papers have studied the impact of boards’ gender
composition on firm performance and a few have studied it in the banking industry specifically (Adams
and Mehran, 2012; Garcia-Meca et al, 2015; Berger et al, 2014; Pathan and Faff, 2013), showing mixed
results. We study this issue using a newly compiled annual dataset on the leadership and financial
performance of approximately 90 U.S. banks over the 1999-2015 period. We propose the resolution to these
conflicting findings is that the impact of greater gender diversity depends on bank and board characteristics.
We find significant non-linearities in the relationship between bank performance and board gender
composition. Our findings suggests that the impact of gender diversity changes as it increases and is
dependent on the quality of bank management.
Specifically, we identify a “threshold” effect, which indicates that gender diversity on bank boards
must reach a certain level before its performance benefits accrue. Furthermore, we find that the impact of
greater gender diversity on boards varies, depending on what measure of performance is used. These
findings have important policy implications, suggesting that banks’ continued voluntary expansion of board
gender diversity is likely to bring overall performance benefits, provided that the banks are well managed
(capitalized).
Our data and methods also allow us to advance the current literature on this topic. We conduct our
analysis on a newly compiled dataset on approximately 90 U.S. bank holding companies boards’ gender
composition, and these banks’ financial performance and balance sheet characteristics over the 1999-2015
period. We constructed this dataset from Boardex, Compustat/CRSP and Bankscope. This dataset provides
a broader cross-section and longer time-series than most related papers. We address the potential
endogeneity of gender diversity by employing an Instrumental Variables estimation method. We also
2
focusing our analysis on institutions that share many similarities, the largest U.S. banks, we are able to
mitigate concern about omitted variables that could generate variation in performance in a more diverse
group of firms. Overall, we find that banks with more females on their board perform better once they
reach a critical level of gender diversity, corresponding to a female share of around 13-17 percent on the
board. Given the size and composition of most boards, this result essentially means that adding more women
to the board improves overall performance if there is already at least one woman on the board; adding the
first woman to the board does not have this positive effect. This implies that currently about half of the
banks in our sample enjoy the performance-enhancing effects of gender diversity on their boards.
We find that greater gender diversity of well-capitalized banks also increases the risk on their
books. Specifically, greater gender diversity corresponds to a higher share of nonperforming assets once
the female share of boardreaches around 7-8 percent, (corresponding to three-quarters of the banks in our
sample). This finding is consistent with the previous literature (Berger et al, 2014; Wang and Hsu, 2013).
A potential explanation is that board (gender) heterogeneity leads to increased communication costs, which
interfere with the board’s monitoring function (Wang and Hsu, 2013).
Our analysis makes several important contributions to the existing literature on board diversity.
First, our findings help to reconcile the mixed evidence obtained to date. Generally, the results on the
impact of gender diversity on firm performance run the gamut, from those that find a positive impact on
performance (Gul et al., 2011; Campbell and Minguez-Vera, 2008; Noland et al., 2016; Kang et al., 2009;
Schmid and Urban, 2016) to those that find a negative impact (Ahern and Dittmar, 2012; Adams and
Ferreira, 2009), to those that find little or no impact (Farrell and Hersch, 2004; Ferrari et al., 2016). While
some previous papers documented evidence of non-linearities regarding some performance measures (de
Andres and Vallelado, 2008), our study is first in providing comprehensive evidence that the impact of
board gender diversity on performance depends on how much diversity the board has already achieved and
on how well-managed the institution is overall. Our “threshold” result, which shows that the direction of
the relationship between bank performance and gender diversity flips signs as the share of females on the
3
Of course, all of the previous literature studies firm performance in a specific context. Our
“threshold” results indicate that this diversity of findings may be due to the particular sample and period
under study –that is, whether the authors’ samples showed female participation above or below the critical
“threshold”. Furthermore, our study is the first to provide empirical evidence that better managed
institutions are better able to reap the benefits of diverse perspectives, perhaps by reducing the
communication costs of board heterogeneity. For example, we find that an increase in gender diversity
increases return on assets at well-capitalized banks, but decreases it at low-capitalized banks. Previous
studies that do not condition on the quality of management found mixed results in this literature.
In what follows, we describe our methods and contribution in greater detail. Section 2 describes
the data and Section 3 presents the estimation methodology. Section 4 discusses the estimation results.
Section 5 summarizes and concludes the paper.
2. Data Description
We collect data on bank boards from Boardex. Our data covers the 1999-2015 period, with annual
frequency. Boardex provides coverage of a total of 168 U.S. banks for the 17 years in our sample. Our
unbalanced panel consists of just above 1,600 bank-year observations on board composition. We collect
balance sheet data for the banks in our sample from Bankscope, Compustat and CRSP. We match the
Boardex data to the balance sheet characteristics using banks’ ISIN identifier. Although we start with a
sample of 168 banks, we note that in our main estimations, data availability limits our sample to 87 banks.
In this section, we describe our data in three categories: overall bank performance measures and
bank behavior, board characteristics and bank characteristics. Summary statistics for all of the data
described in this section appear in Table 1.
2.1 Overall Bank Performance Measures and Bank Behavior
We focus on two measures of overall bank performance and two measures of more specific bank behavior.
4
operating revenue to operating expenses and is our measure of the efficiency of a banks’ operations.2 The
second overall performance measure, Return on Assets, is defined as net income divided by total assets and
is included as a measure of banks’ profitability. We also examine risk-taking behavior by using the Share
of Nonperforming Assets as an indicator of risk – it measures the buildup of risk on balance sheets.3 Lastly,
we examine practices related to pay equity by looking at the dispersion of compensation within banks with
the Ratio of CEO to Average Staff Pay. This measure is the ratio of the CEO’s direct and equity-based
compensation to average staff compensation (including stocks, wages & salaries and benefits).4
2.2 Board Characteristics
Our main measure of gender diversity on boards is the Blau Index (Blau, 1977; Bear et al., 2010), defined
as follows:
𝐵 = [1 − ∑ 𝑃𝑔2 𝐺
𝑔=1 ] × 100
In this expression, P is the fraction of women and men on bank boards, and g indexes gender. By
construction, this measure has a maximum value of 50 at gender equality on boards, i.e. if both men and
women have 50 percent representation. Lower values of the Blau Index indicate greater gender inequality.
In auxiliary regressions, we use the Female Share of Board as our dependent variable. By
definition, this measure is the number of female board members, divided by the total number of board
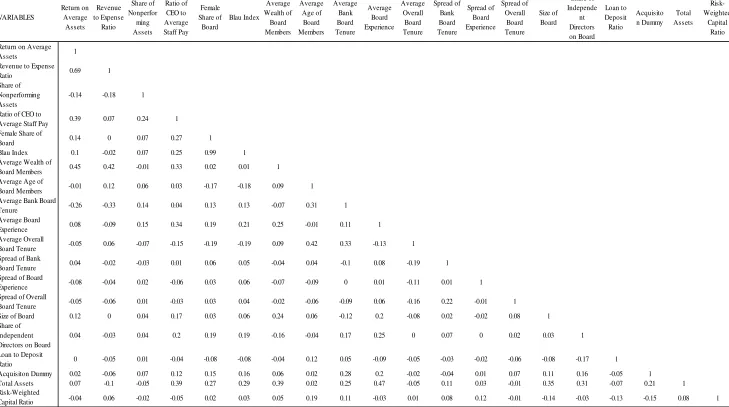
members, times 100. As Table 1A shows, our two measures of gender diversity are highly correlated for
values up to a female board share of 50 percent, and strongly negatively correlated at higher female shares.
Table 1 reveals that in our sample, the Female Share of Board variable is consistently below 50 percent.
Therefore, our sample shows a very high positive correlation between the Female Share of Board and the
Blau Index (Table 1A).
2This measure is therefore the inverse of the “efficiency ratio” – a common measure of performance in banking. 3 Note that year fixed effects should control for changes in systemic risk.
4 The lowest ratios for CEO to staff pay occurred in 2008 and 2009, suggesting that some bank CEOs temporarily
5
The average Female Share of Board is around 12.5 percent, corresponding to one out of eight board
members being female. This is also the median female share. The median size of a board is 13 board
members so this means that the typical bank board will have one or two women on it. However, the
distribution has a long right tail – while the maximum female share is high at 42.8 percent, three-quarters
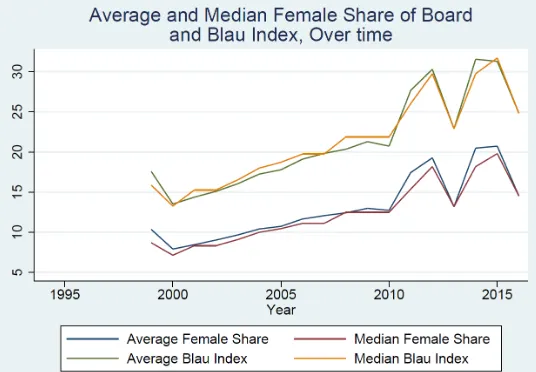
of the boards in our sample have less than 16.8 percent female share. Similarly, the Blau Index distribution
is concentrated at low values (implying low gender diversity). That said, gender diversity as measured by
either the Blau Index or the Female Share of Board has increased over time, with the median Blau Index
across all banks in a given year increasing from 16% to 25% over the sample period, corresponding to an
uptick in median Female Share of Board from 8% to 15% (Figure 1). We include two measures to capture
the average demographic characteristics of the board. First, Average Wealth of Board Members is the
natural logarithm of the average value (across all board members) of cumulative holdings over time of
stocks and options. Second, Average Age of Board Members is the natural logarithm of the board members’
average age.
Our board experience measures capture the level and dispersion of board members’ expertise.
Average Bank Board Tenure captures the (logarithm of) the average number of years that board members
have spent on bank boards, to date. Across banks and over time, average board experienceranges from 3
to 12 years, with a mean of around 6 years. Our second experience measure, Average Board Experience is
the (logarithm of) the average number of company boards (private, quoted or other) that board members
have served on over their careers, to date. While the average number of boards that board members have
served on is 5, this measure is as high as 11 for some banks. Lastly, Overall Board Tenure is the (logarithm
of) the average number of years board members have sat on a board of a publicly listed company, to date.
The average board experience is around 9 years – but is as high as 22 years for some bank boards.5 We also
include the spreads of all three experience measures, to capture the dispersion of board members’ expertise.
5 We include the logarithms of these measures in our regressions – therefore, the numbers in the descriptive Table 1
6
For each variable, the spread is defined as the logarithm of the difference between the average and median
board experience measure, divided by the median value.
2.3 Bank Characteristics
Our estimations also include bank balance sheet characteristics as controls for non-board related
developments that may affect bank performance. The Loan to Deposit Ratio is our measure of bank liquidity
conditions. Almost all banks in our sample hold less loans than their deposits, with their ratio averaging
0.9. The Acquisition dummy is included to capture the performance impact of bank M&A activity. With a
mean of 0.4, we see a significant amount of M&A activity in our sample – consistent with the rapid
consolidation of the commercial banking industry during the 2000s. Risk-weighted Capital Ratio is our
measure of a bank’s overall “quality of management”, as suggested by the work of Mehran and Thakor
(2011) and Bhat and Desai (2016). The banks in our sample are quite well capitalized, with mean and
median capital ratios between 13 and 14 percent. However, we see a substantial spread in these ratios –
with some banks very poorly capitalized at 3 to 4 percent, while others extremely well capitalized. We
explore this variation in the capital ratio in our estimations, as we examine how this variable impacts the
role of board gender diversity in bank performance. Lastly, we also include Board Size as a control for the
scale of the board. Board Size ranges from 6 to 32 members, with an average Board Size of 13 members in
our estimation sample
3. Estimation methodology
In our main empirical specifications, we estimate the first-differenced form of the following equation:
(1) 𝑌𝑡𝑏 = 𝛼0+ 𝛼1𝑋𝑡−1𝑏 + 𝛼2(𝑋𝑡−1𝑏 )2+ 𝐶𝑡−1𝑏 × [𝛼3𝑋𝑡−1𝑏 + 𝛼4(𝑋𝑡−1𝑏 )2]
+ 𝛼5𝑍𝑡−1𝑏 + 𝛼6𝑆𝑡−1𝑏 + 𝛼7𝑇𝑡+ 𝛼8𝐵𝑏+ 𝜀𝑡𝑏
In Equation 1, 𝑌𝑡𝑏denotes the measure of bank performance and bank behavior under study, which is one of: Revenue to Expense Ratio, Return on Assets, Share of Nonperforming Assets, and Ratio of CEO to
7 measure.6 We also include the square of this measure, (𝑋
𝑡−1𝑏 )2, to capture non-linearities in the relationship
between bank performance and gender diversity. We interact both the Blau Index and its square with the
Risk-weighted Capital Ratio 𝐶𝑡−1𝑏 , to examine how the role of gender diversity varies with the quality of
management. 𝑍𝑡−1𝑏 is the vector of (lagged) board characteristics7, which include: Average Wealth of Board
Members, Average Age of Board Members, Average Bank Board Tenure and its Spread; Average Board
Experience and its Spread, Average Overall Board Tenure and its Spread, and Board Size. The vector of
(lagged) bank balance sheet characteristics included in 𝑆𝑡−1𝑏 are: Loan to Deposit Ratio, Acquisition
dummy, and the Risk-Weighted Capital Ratio. Furthermore, 𝐵𝑏 and 𝑇𝑡 are the sets of bank and year fixed effects.
Banks with more women on their boards might be fundamentally different from other banks, in
ways that are not directly observable. We address this issue in Equation 1 in several ways. First, we include
numerous bank balance sheet characteristics as controls, which capture differences in performance and
management style. We also include bank and year fixed effects to control for unobservable time-invariant
bank traits and time-varying shocks common to all banks, respectively.
We are also concerned about the potential endogeneity of gender diversity because the composition
of the board may change in response to shocks to bank performance (Fich, 2005; Mateos de Cabo et al.,
2012). For instance, bad returns may result in a “shake-up” of the board, yielding changes in its composition
as well. We address this issue with two overall strategies. First, we use a lagged value of gender diversity
to predict subsequent bank performance to mitigate the impact of the concern that poor performance in one
year would cause a change in board composition in the following year. Second, we employ IV specifications
throughout.
We use two different types of instruments. The first is the Share of Independent Directors, defined
as the share of those board members in the total board whose roles are classified as “independent directors”
6 In auxiliary regressions, we use Female Share of Board as our diversity measure and reach the same qualitative
conclusions.
8
in the Boardex database. The Share of Independent Directors is an appropriate instrument because it may
be associated with more women on the board if it is indicative of banks’ boards being selected from a larger
pool of qualified professionals rather than a smaller, internally-generated pool.8 Indeed, the data in our
sample shows that this measure is highly and significantly correlated with the Blau Index and the Female
Share of Board (as shown in Table 1A in the Appendix).9 However, it shows no additional direct
relationship with measures of bank performance, as also confirmed by the majority of the previous literature
(Pi and Timme, 1993; de Andres and Vallelado, 2008; Muller-Kahle and Lewellyn, 2011; Aebi et al, 2012;
Adams and Mehran, 2012).10 As an additional check, we address the possibility that banks’ reported Share
of Independent Directors may by subject to managerial manipulation in response to regulations. For
instance, Bowen (2017) casts doubt on whether or not directors classified as independent are truly
independent by documenting that in about 13 percent of the firms in his sample, firms reclassified the same
individuals, switching them from a non-independent to independent directors from one year to the next.
However, in the sample of bank holding companies that we examine, we find that this behavior is not
common. For the entire sample period, we see only 12 instances of reclassification of directors, less than
one percent of the sample; this broader trend is not evident in our data.
The second type of instrument that we use follows the strategy of Ahern and Dittmar (2012).
Specifically, we use the initial Blau Index (measured in 1999) times year fixed effects. As we discuss
further below, Sargan tests support the validity of our instruments.
As a result of this multiple instrument strategy, the first stage of the IV estimations takes the
following form:
(2) 𝑋𝑡𝑏= 𝛽0+ 𝛽1𝐼𝑡𝑏+ 𝛽2(𝑋1999𝑏 × 𝑇𝑡)+𝛽3𝑍𝑡−1𝑏 + 𝛽4𝑆𝑡−1𝑏 + 𝛽5𝑇𝑡+ 𝛽6𝐵𝑏+ ʋ𝑡𝑏
8 On average, three-quarters of bank boards are made up of independent directors in our sample – but there are a few
banks with independent director shares of less than one-eighth of the board.
9 Notably, previous literature has used the Board Size as an instrument for gender diversity (Ferris et al., 2003). We
choose not to do so, since Vallelado (2008), Faleye and Krishnan (2010), Adams and Mehran (2012) and de Andres, and Fernandes and Fich (2016) show that Board Size is significantly related to bank performance. Therefore, we include board size as a separate covariate, rather than an instrument for gender diversity.
10 While Faleye and Krishnan (2010) and Fernandes and Fich (2016) do find a significant relationship, Berger et al
9
In Equation 2, 𝐼𝑡𝑏 denotes the Share of Independent Directors. The first stage also includes 𝑍𝑡−1𝑏 (the set of
bank characteristics from Equation 1), bank and year fixed effects, and year fixed effects times the initial
Blau Index (measured in 1999) as instruments.
Finally, insofar as board experience is correlated with gender diversity (Kim and Starks, 2016),
multicollinearity of the explanatory variables might also pose a problem. While our IV specifications and
lagging of the explanatory variables by one year (as described above) tackles this issue, we take a further
step to eliminate multicollinearity by using first-differenced panel estimations (Bear, Rahman and Popst,
2010).
4. Estimation Results
4.1 Bank Performance and Board Gender Diversity
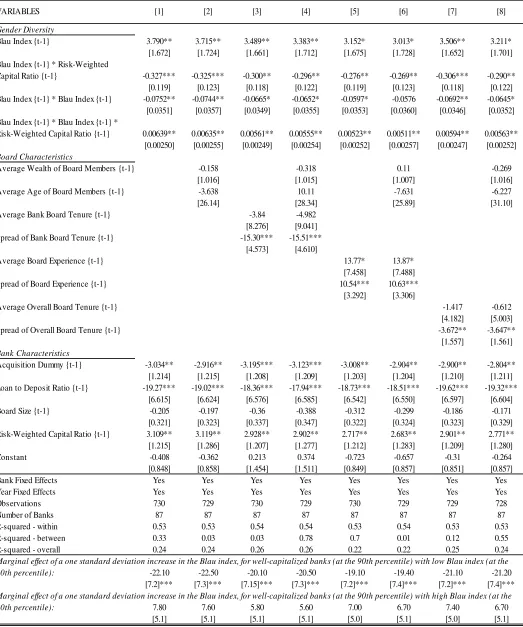
We first present results for a broad measure of bank performance, the Revenue to Expense Ratio, in Table
2. All estimations reported in Table 2 include the Blau Index for gender diversity as well as three interaction
terms that allow for the impact of gender diversity to vary with bank and board characteristics: the Blau
Index times the Risk-weighted Capital Ratio, the Blau Index squared, and the Blau Index squared times the
Risk-weighted Capital Ratio. All estimations also include bank characteristics that vary over time, as well
as bank and year fixed effects. In the various specifications of Table 2, we vary the board characteristics
across estimations. We also include controls for average age and wealth of board members, and alternate
controls for experience and variety of experience of board members. Specifically, in estimations in Columns
3 and 4, to characterize the experience of the board, we use average number of years serving on a bank
board and the spread between the median and mean years of bank board experience. In Columns 5 and 6,
we measure experience using the average number and spread of boards of all publicly traded companies,
and in Columns 7 and 8, we use the average number of years and the spread of years on boards of all
publicly traded companies.
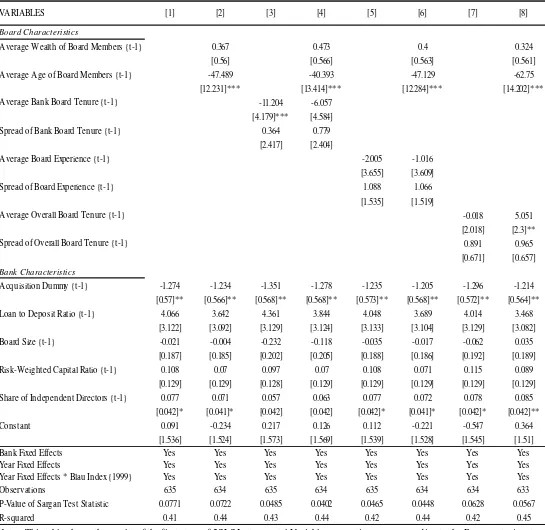
Each column in Table 2 presents the results of the second stage of an instrumental variables (IV)
10
times the initial Blau Index (measured in 1999) as instruments, appear in Appendix Table 2A.11 As expected,
in the first stage regressions the Share of Independent Directors is positively related to the Blau Index of
gender diversity. The R2 of these regressions ranges from 0.41 to 0.45 and a Sargan test of over-identifying
restrictions cannot reject the validity of the instruments at the 5 percent level in five of the eight
specifications and at the 10 percent level in all remaining specifications.
Turning back to the main results in Table 2, we see that the Blau Index enters significantly and
positively in all specifications. Importantly, the interaction terms are also statistically significant, some with
positive coefficients and some with negative coefficients, in all specifications. This indicates that the impact
of gender diversity of the board on bank performance is more complicated than a simple “level” effect
suggests. Specifically, the marginal effect of additional gender diversity depends on its existing level and
on the Risk-weighted Capital Ratio. At the bottom of Table 2, we take all these effects into account and
calculate the marginal effects of a one standard deviation increase in the Blau Index for well-capitalized
banks with low (10th percentile) and high (90th percentile) existing gender diversity. What these results
show is that for well-capitalized (managed) banks with a low level of gender diversity on the board, a small
increase in gender diversity has a negative effect on bank performance. However, we show that as the
gender diversity of the board increases, the evidence of a negative effect disappears. Bank efficiency (as
measured by the Revenue to Expense Ratio) no longer decreases with gender diversity once the share of
women on the board reaches around 17 percent at well-capitalized banks (paralleling a Blau Index of around
27). This corresponds to around the top 25 percent of banks in our sample.
Interestingly, the results in Table 2 also provide evidence that experience on boards matters. The
results for Bank Board Tenure (Columns 3 and 4) and Overall Board Tenure (Column 7 and 8) are similar.
The negative and significant coefficients for the Spread of both Bank and Overall Board Tenure imply that
the Revenue to Expense Ratio decreases when the distribution of board experience is skewed in either
11 Note that because the Blau Index appears in the second stage interacted with other variables several times, the full
11
direction. We do not find evidence, however, that the average years of experience on either bank boards or
boards of publicly traded companies has an effect on bank performance. This suggests that board members
from different “vintages”, that is, with different years of experience may not work as well together in
providing effective guidance to senior management. However, in line with the findings of Fernandes and
Fich (2016) and Cunat and Garicano (2010), bank boards that have directors with experience on multiple
boards correspond to better bank performance, as suggested by the positive coefficient on Average Board
Experience in Columns 5 and 6. Furthermore, dispersion in this measure (as indicated by the Spread of
Board Experience) is associated with increases in the Revenue to Expense Ratio. It is possible that there is
some reverse causality in this measure—if better board members are asked to be on more boards—but, it
does suggest that banks might benefit from a board that is populated with individuals with broad experience.
In sum, these results imply that the type of experience that improves bank performance is board experience
with different firms, not necessarily more years of experience with the same firm or with banks specifically.
To the extent that men and women may also have different experience or perspective, this experience
diversity result complements our investigation of the impact of gender diversity.
Finally, we note some expected results when we examine the impact of bank characteristics on the
Revenue to Expense Ratio. Banks that have a higher Loan to Deposit Ratio and which have made an
Acquisition in the current year have a lower Revenue to Expense Ratio. Banks with a higher Risk-weighted
Capital Ratio experience a higher Revenue to Expense Ratio, which supports our interpretation of this
measure as a proxy of the quality of bank management.
We examine another broad measure of bank performance, Return on Assets, in Table 3. Similar to
the results in Table 2, we find again that the Blau Index enters positively and significantly in all estimations.
The results for the interactions of the Blau Index are also all statistically significant with mixed signs on the
coefficients. This time, however, when we calculate the marginal effect of an increase in the gender
diversity of the board for well-capitalized banks, we obtain statistically significant effects for banks with
both low and high existing gender diversity of boards. Specifically, when a well-capitalized bank has low
12
percentage point. However, when a well-capitalized bank has higher existing gender diversity on its board,
a comparable increase in gender diversity raises its Return on Assets by around 0.6 percentage points. This
result is consistent with the idea that board room dynamics are influenced by the number of women in the
room. When there is a threshold share of women on the board and the bank is well managed (as proxied for
by the Risk-weighted Capital Ratio), more gender diversity makes a positive contribution to bank
performance. We find that the impact of increased diversity is significant and positive on Return on Assets
at well-capitalized banks once the share of females on the board reaches around 13 percent (corresponding
to a Blau Index of around 22). As the median Blau Index of gender diversity in our sample is 22, this implies
that around 50 percent of well-capitalized banks in our sample enjoy the performance-enhancing effects of
gender diversity.
As was the case with our initial results, the positive and significant coefficients on Spread of Board
Experience (Columns 5 and 6 of Table 3) indicate that banks with boards that show a broad range of
experience in terms of the number of boards its members sit on, perform better. However, variance in the
number of years of experience of board members reduces bank performance. The effects of balance sheet
characteristics on Return on Assets point in a similar direction as in Table 2.
4.2 Portfolio Risk and Board Gender Diversity
Next, we examine the relationship between the portfolio risk of a bank, and its board’s gender diversity.
Specifically, in Table 4 we examine (accumulated) bank portfolio risk, as represented by the Share of
Nonperforming Assets (NPA). Although some risks that banks take will pay off in the form of higher
income, a higher share of nonperforming assets is an indicator of the part of a bank’s risk-taking that has
“gone bad”. In their review of the literature, Croson and Gneezy (2009) conclude that experimental
evidence supports the view that women are more risk-averse than men. However, in the context of banks,
Berger et al. (2014) and Wang and Hsu (2013) document a positive relationship between risk-taking and
gender diversity. This may be in part because gender diversity proxies for board strength, and stronger
13
Share of Nonperforming Assets, suggesting that more gender diversity is associated with greater portfolio
risk once the share of women on the boardreaches around 7-8 percent. Once mid-capitalized banks reach
a Blau Index of around 8 (or a female share of 4 to 5 percent) on their boards, greater gender diversity maps
into higher NPA shares. For well-capitalized (better managed) banks, this threshold increases to a Blau
Index of around 14 (or a female share of around 7-8 percent, corresponding to 75 percent of banks in our
sample).
4.3 CEO Pay and Gender Diversity
As a final measure of bank behavior, we also examine the Ratio of CEO to Average Staff Pay. A higher
ratio indicates greater pay inequality within the bank. The simple correlations reported in Table 1A indicate
that firms with greater gender diversity do have higher pay inequality, with a positive correlation coefficient
of 0.25. The results in Table 5 confirm that this general conclusion holds up to a host of conditioning
variables as well as bank and year fixed effects. The first four rows of Table 5 show that the Blau Index of
gender diversity enters positively and significantly in all specifications. As was the case with the other
measures of bank performance, the coefficients on the interactions of the Blau Index with itself and the
Risk-weighted Capital Ratio are also all statistically significant.
The last two rows of Table 5 take all the interaction terms into account and show the marginal
effect of a one standard deviation increase in the Blau Index for well-capitalized banks at low and high
levels of gender diversity. These marginal effects indicate that when gender diversity is low, the marginal
effect of greater gender diversity is negative on within-bank pay inequality. But, when gender diversity is
high, the marginal effect is positive. For well-capitalized banks, this relationship turns positive once the
Blau Index reaches around 20, corresponding to a board female share of around 12 percent (the median
value for banks in our sample). The magnitudes of the estimated marginal effects are notable. The results
in the last row of Table 5 indicate that a one standard deviation increase in the Blau Index at a
well-capitalized bank in the 90th percentile of gender diversity would result in close to a one standard deviation
14
Our result is in line with anecdotal evidence that greater gender diversity on boards correspond to
higher CEO pay (New York Times, May 27th, 2016). However, our result seems in contrast to the results
of experimental studies described in Croson and Gneezy (2009) in which they review several studies that
find women to be more inequality-averse than men.12 However, these studies also indicate that women’s
revealed preferences for equal outcomes are more context-specific. It is possible that in the context of the
board room in which social connections also play a role (Agarwal et al, 2016; Kramarz and Thesmar, 2013),
these preferences for equality do not manifest themselves.
We find that greater Overall Board Tenure (a measure of board experience) corresponds to greater
Ratio of CEO to Average Staff Pay. This result is in line with Conyon (2014)’s finding that greater
experience corresponds to higher CEO pay. Interestingly, we find that banks with higher Risk-weighted
Capital Ratios (a proxy for the quality of management) have significantly greater gaps between the
compensation of the CEO and their average non-executive worker. This result can be justified insofar as
higher Risk-weighted Capital Ratios indicate better quality bank management (Mehran and Thakor, 2011;
Bhat and Desai, 2016).
While more research is needed to understand the relationship pay inequality and board gender
diversity, we should point out that our estimation strategy allows us to rule out a number of possible
theories. Specifically, because we control for bank characteristics such as Board Size and Risk-weighted
Capital Ratio, we cannot attribute this result to larger boards being both more gender diverse and also
compensating CEOs relatively more.13 Furthermore, our inclusion of bank fixed effects also rule out the
hypothesis that there is some unobserved fixed characteristic of the bank that is associated both with gender
12 The gender of the CEO may also play a role in pay inequality: Kulich et al. (2011) find that in the UK, male
executives earn higher and more performance sensitive bonuses than their female counterparts.
13 Ayadi and Boujelbene (2013) find that larger boards are associated with higher CEO compensation at European
15
diversity and CEO compensation. Similarly, year fixed effects rule out the possibility that the positive
correlation can be attributed to an omitted variable associated with a specific time period.14
4.4 Discussion
Overall, we find that the impact of increasing gender diversity on bank boards is context dependent.
It depends on both the existing level of gender diversity as well as the quality of bank management (as
proxied for by the risk-weighted capital ratio). The result that the impact of increasing gender diversity on
overall bank performance only turns positive when there is already more than one woman in the boardroom
is consistent with research by political scientists who have studied the impact of the gender composition of
legislators. For example, Karpowitz and Mendelberg (2014) find that group composition affects the
authority of women in a variety of decision-making situations. Specifically, they document that women
speak more frequently when the percentage of women in the group increases. Thus, our result that the
positive impact of increasing gender diversity only occurs after a threshold level of women is on the board
is consistent with the benefits of diverse viewpoints not being fully realized unless those viewpoints can be
expressed with authority.
More generally, our results support the literature that studies the economic impact of diversity and
finds that it is context-dependent. For example, Alesina and LaFerrara (2005) examine the impact of ethnic
diversity on economic growth and find that it has a positive impact in high income countries and
democracies that have the institutional capacity to mitigate the conflict that often accompanies greater
diversity. Several studies have shown that diverse groups are more innovative (Chattopadhyay and Duflo,
2004; Phillips et al., 2006; Freeman and Huang, 2015). Again, our result that the quality of management
of the bank helps to maximize the benefits of diverse and potentially more innovative view points while
minimizing the communication costs and potential conflict are consistent with these findings.
14 We observe a substantial drop in the Ratio of CEO to Average Staff Pay during the 2008-2009 period, due to the
16 5. Conclusion
Using a sample of large US banks over the 1999-2016 period, we study the relationship between
various measures of bank performance and gender diversity on bank boards. We find that the impact of
board gender diversity on bank performance is highly non-linear. We identify “threshold” results, which
indicate that the relationship between bank performance and board gender diversity changes directions once
banks increase gender diversity on their boards from low to higher levels. Our non-linearity results help
shed light on the very wide-ranging findings of previous papers on the role of board gender diversity in
bank (and in general, firm) performance. Our findings suggest that banks’ continued voluntary expansion
of board gender diversity is likely to bring overall performance benefits for well-capitalized (well-managed)
banks.
More research is needed on understanding the relationship between gender diversity on executive
boards, and risk-taking and pay inequality within banks. By identifying our “threshold” results, we hope
17 References
Adams, Renee B. and Daniel Ferreira (2009). “Women in the boardroom and their impact on governance
and performance,” Journal of Financial Economics 94, 291-309.
Adams, Renee B. and Hamid Mehran (2012). “Bank board structure and performance: Evidence for large
bank holding companies,” Journal of Financial Intermediation 21, 243-267.
Aebi, Vincent, Gabriele Sabato, and Markus Schmid (2012). "Risk management, corporate governance,
and bank performance in the financial crisis," Journal of Banking & Finance 36(12), 3213-3226.
Agarwal, Sumit, Wenlan Qian, David M. Reeb, and Tien Foo Sing (2016). “Playing the boys’ game: Golf
buddies and board diversity,” American Economic Review 2016(5), 272-276.
Ahern, Kenneth and Amy K. Dittmar (2012). “The changing of the boards: The impact on firm valuation
of mandated female board representation,” The Quarterly Journal of Economics 127(1), 137-197.
Alesina, Alberto and Eliana La Ferrara (2005). “Ethnic diversity and economic performance,” Journal of
Economic Literature 43(3), 762-800.
Ayadi, Nesrine and Younes Boujelbene (2013). “The influence of the board of directors on the executive
compensation in the banking industry,” Global Business and Management Research: An International
Journal 5(2-3), 83-90.
Bear, Stephen, Noushi Rahman and Corrine Post (2010). “The impact of board diversity and gender
composition on corporate social responsibility and firm reputation,” Journal of Business Ethics 97,
207-221.
Berger, Allen N., Thomas Kick and Klaus Schaeck (2014). “Executive board composition and bank risk
18
Berger, Allen N., Björn Imbierowicz, and Christian Rauch (2016). “The roles of corporate governance in
bank failures during the recent financial crisis,”Journal of Money, Credit and Banking 48(4), 729-770.
Bhat, Gauri and Hemang Desai (2016). “Bank capital monitoring and loan quality,” Working Paper.
Blau, Peter M. (1977). Inequality and heterogeneity. New York, NY: Free Press.
Bowen III, Donald E., Were Non-Independent Boards Really Captured Before SOX? (June 2, 2017).
Available at SSRN: https://ssrn.com/abstract=2979598.Campbell, Kevin and Antonio Minguez-Vera
(2008). “Gender diversity in the boardroom and firm financial performance,” Journal of Business Ethics
83(3), 435-451.
Catalyst (2015). Pyramid: Women in S&P 500 finance. New York: January 13.
Chattopadhyay, Raghabendra and Esther Duflo (2004). “Women as policymakers: Evidence from a
randomized policy experiment in India,”Econometrica 72(5), 1409-1443.
Conyon, Martin J. (2014). “Executive compensation and board governance in US firms,” The Economic
Journal 124(574), F60-F89.
Croson, Rachel, and Uri Gneezy (2009) “Gender differences in preferences,” Journal of Economic
Literature 47(2), 448-74.
Cunat, Vicente and Luis Garicano (2010). “Did good cajas extend bad loans? Governance, human capital,
and loan portfolios,” MPRA Working Paper 42434.
de Andres, Pablo and Eleuterio Vallelado (2008). “Corporate governance in banking: The role of the board
of directors.” Journal of Banking and Finance 32(12): 2570-80.
Faleye, Olubunmi and Karthik Krishnan (2010). “Risk lending: Does bank corporate governance matter?”
19
Farrell, Kathleen A. and Philip L. Hersch (2005). “Additions to corporate boards: The effect of gender,”
Journal of Corporate Finance 11, 85-106.
Fernandes, Nuno and Eliezer M. Fich (2016). “Are outside directors with greater board tenure valuable?
Evidence from the last credit crisis,” Available at SSRN: https://ssrn.com/abstract=1409557.
Ferrari, Giulia, Valeria Ferraro, Paola Profeta and Chiara Pronzato (2016). “Gender quotas: Challenging
the boards, performance, and the stock market,”CESifo Working Paper Series 6084.
Ferris, Stephen P., Murali Jagganathan and A.C. Pritchard (2003). “Too busy to mind the business?
Monitoring by directors with multiple board appointments,” The Journal of Finance 58(3), 1087-1111.
Fich, Elizier M. (2005). “Are some outside directors better than others? Evidence from director
appointments by Fortune 1000 firms,” The Journal of Business 78(5), 1943-1972.
Garcia-Meca, Emma, Isabel-Maria Garcia-Sanchez and Jennifer Martinez-Ferrero (2015). “Board diversity
and its effects on bank performance: An international analysis,” Journal of Banking & Finance 53 (April),
202-14.
Freeman, Richard B. and Wei Huang (2015). “Collaborating with people like me: Ethnic co-authorship
within the United States” in US High-Skilled Immigration in the Global Economy, Turner and Kerr.
Gul, Ferdinand A., Bin Srinidhi and Anthony C. Ng (2011). “Does board gender diversity improve the
informativeness of stock prices?” Journal of Accounting and Economics 51, 314-338.
Kang, E., David K. Ding and Charlie Charoenwong (2009). “Investor reaction to women directors,” Journal
of Business Research 63(8), 888-894.
Karpowitz, C., & Mendelberg, T. (2014). The Silent Sex: Gender, Deliberation, and Institutions. Princeton
20
Kim, Daehyun and Laura T. Starks (2016). “Gender diversity on corporate boards: Do women contribute
unique skills?” American Economic Review Papers & Proceedings 106(5), 267-271.
Kramarz, Francis and David Thesmar (2013). “Social networks in the boardroom,” Journal of the European
Economic Association 11(4), 780-807.
Kulich, Clara, Grzegorz Trojanowski, Michelle K. Ryan, S. Alexander Haslam and Luc D. R. Renneboog
(2011). “Who gets the carrot and who gets the stick? Evidence of gender disparities in executive
remuneration,” Strategic Management Journal 32(3), 301-321.
Mehran, Hamid and Anjan Thakor (2011). “Bank capital and value in the cross-section,” Review of
Financial Studies 24(4). 1019-1067.
Mateos de Cabo, Ruth, Ricardo Gimeno and Maria J. Nieto (2012). “Gender diversity on European banks’
boards of directors,” Journal of Business Ethics 109(2), 145-162.
Muller‐Kahle, Maureen I., and Krista B. Lewellyn (2011). “Did board configuration matter? The case of
US subprime lenders,”Corporate Governance: An International Review 19(5), 405-417.
New York Times, “Where more women are on boards, executive pay is higher” May 27, 2016.
Noland, Marcus, Tyler Moran and Barbara Kotschwar (2016). “Is gender diversity profitable? Evidence
from a global survey,” Peterson Institute for International Economics Working Paper Series 16-3
(February).
Pathan, Shams (2009). “Strong boards, CEO power and bank risk-taking,” Journal of Banking & Finance
33, 1340-1350.
Pathan, Shams and Robert Faff (2013). “Does board structure in banks really affect their performance?”
21
Phillips, Katherine W., Gregory B. Northcraft and Margaret A. Neale (2006). “Surface-level diversity and
decision-making in groups: When does deep-level similarity help?” Group Processes and Intergroup
Relations 9, 467-482.
Pi, Lynn and Stephen G. Timme (1993). “Corporate control and bank efficiency,” Journal of Banking and
Finance 17(2-3), 515-530.
Schmid, Thomas and Daniel Urban (2016). “Women on corporate boards: Good or bad?” Working Paper.
Wang, Taiwei and Carol Hsu (2013). “Board composition and operational risk events at financial
Dependent Variables Bank Performance Measures
Return on Assets % Net Income divided by Average Total
Assets, from Bankscope 0.96 1.32 -5.84 0.74 1.10 1.41 10.00 647
Revenue to Expense Ratio %
Total current operation revenue divided by total current operating expenses, multiplied by 100, from CRSP/Compustat
129.40 23.58 46.56 119.10 130.90 141.40 212.10 730
Share of Nonperforming Assets %
Nonperforming assets divided by total assets, multiplied by 100, from CRSP/Compustat
1.45 4.52 0.00 0.29 0.56 1.46 78.79 632
Ratio of CEO to Average Staff Pay Ratio
Chief Operating Officer compensation (defined as Total direct compensation plus total equity linked compensation, from Boardex) divided by average staff compensation (defined as the sum of stock compensation, wages&salaries and staff benefits, from CRSP/Compustat)
65.67 91.50 1.37 17.34 35.55 75.98 875.50 626
Explanatory Variables Board Characteristics
Blau Index Index where P is the fraction of men and women
on bank boards, and g indexes gender. Based on Blau (1977), calculated from Boardex
Female Share of Board % Percent share of board that is comprised
on women, from Boardex 12.55 8.35 0.00 7.69 12.50 16.67 42.86 730
Average Wealth of Board Members Natural Logarithm
Natural logarithm of average value (across all board members) of cumulative holdings over time of stock, options, and LTIPs, in 1000 USD, from Boardex
8.27 1.13 3.53 7.59 8.23 8.94 12.13 676
Average Age of Board Members Natural Logarithm Average of board members’ age in the
given year, from Boardex 4.13 0.05 3.93 4.09 4.13 4.16 4.30 730
[image:24.792.198.772.85.550.2]11.94 0.00 14.20
Table 1: Variable Descriptions and Summary Statistics
21.88 27.78 48.98 730
VARIABLE NAME UNIT DEFINITION MEAN SD MIN P25 P50 P75 MAX N
23
Explanatory Variables
Board Characteristics continued
Average Bank Board Tenure Natural Logarithm
Natural logarithm of average number of years that board members have spent on bank boards, to date, from Boardex
1.85 0.30 1.15 1.61 1.88 2.09 2.58 730
Spread of Bank Board Tenure Natural Logarithm
Natural logarithm of the difference between the average and median bank board tenure to date, divided by the median, from Boardex
-0.09 0.16 -0.31 -0.18 -0.11 -0.04 1.46 730
Average Board Experience Natural Logarithm
Natural Logarithm of average number of company boards (private, quoted or other) that board members have served on over their careers, to date, from Boardex
1.73 0.34 0.96 1.48 1.72 1.99 2.47 730
Spread of Board Experience Natural Logarithm
Natural logarithm of the difference between the average and median board experience to date, divided by the median, from Boardex
0.16 0.23 -0.25 -0.01 0.11 0.26 1.31 730
Average Overall Board Tenure Natural Logarithm
Average number of years board members have sat on a board of a publicly listed company, to date, from Boardex
2.30 0.33 1.00 2.10 2.32 2.53 3.12 730
Spread of Overall Board Tenure Natural Logarithm
Natural logarithm of the difference between the average and median overall board tenure to date, divided by the median, from Boardex
0.19 0.41 -0.38 -0.05 0.10 0.27 5.02 730
Size of Board Natural Logarithm Total number of board members 13.10 3.67 6.00 11.00 13.00 15.00 32.00 730
Share of Independent Directors on Board %
Used as instrument for Gender Diversity, defined as the Percent share of board members who are categorized as "Independent Directors", from Boardex
72.75 11.31 22.22 65.00 73.33 81.82 93.75 730
Bank Balance Sheet Characteristics
Loan to Deposit Ratio Ratio Total Loans divided by Total Deposits, from
CRSP/Compustat 0.91 0.22 0.06 0.81 0.92 1.02 2.24 730
Acquisiton Dummy 0/1
Dummy variable that takes on a value of 1 if the bank experienced an acquisition in the given year, 0 otherwise, from CRSP/Compustat
0.39 0.49 0.00 0.00 0.00 1.00 1.00 730
Risk-Weighted Capital Ratio % Risk-weighted capital to asset ratio, from
CRSP/Compustat 13.72 2.97 4.53 11.79 13.13 14.78 48.20 720
[image:25.792.48.780.86.557.2]MIN Table 1 continued: Variable Descriptions and Summary Statistics
Gender Diversity
[image:26.612.42.565.49.676.2]Blau Index {t-1} 3.790** 3.715** 3.489** 3.383** 3.152* 3.013* 3.506** 3.211*
[1.672] [1.724] [1.661] [1.712] [1.675] [1.728] [1.652] [1.701]
Blau Index {t-1} * Risk-Weighted
Capital Ratio {t-1} -0.327*** -0.325*** -0.300** -0.296** -0.276** -0.269** -0.306*** -0.290**
[0.119] [0.123] [0.118] [0.122] [0.119] [0.123] [0.118] [0.122]
Blau Index {t-1} * Blau Index {t-1} -0.0752** -0.0744** -0.0665* -0.0652* -0.0597* -0.0576 -0.0692** -0.0645*
[0.0351] [0.0357] [0.0349] [0.0355] [0.0353] [0.0360] [0.0346] [0.0352]
Blau Index {t-1} * Blau Index {t-1} *
Risk-Weighted Capital Ratio {t-1} 0.00639** 0.00635** 0.00561** 0.00555** 0.00523** 0.00511** 0.00594** 0.00563**
[0.00250] [0.00255] [0.00249] [0.00254] [0.00252] [0.00257] [0.00247] [0.00252]
Board Characteristics
Average Wealth of Board Members {t-1} -0.158 -0.318 0.11 -0.269
[1.016] [1.015] [1.007] [1.016]
Average Age of Board Members {t-1} -3.638 10.11 -7.631 -6.227
[26.14] [28.34] [25.89] [31.10]
Average Bank Board Tenure {t-1} -3.84 -4.982
[8.276] [9.041]
Spread of Bank Board Tenure {t-1} -15.30*** -15.51***
[4.573] [4.610]
Average Board Experience {t-1} 13.77* 13.87*
[7.458] [7.488]
Spread of Board Experience {t-1} 10.54*** 10.63***
[3.292] [3.306]
Average Overall Board Tenure {t-1} -1.417 -0.612
[4.182] [5.003]
Spread of Overall Board Tenure {t-1} -3.672** -3.647**
[1.557] [1.561]
Bank Characteristics
Acquisition Dummy {t-1} -3.034** -2.916** -3.195*** -3.123*** -3.008** -2.904** -2.900** -2.804**
[1.214] [1.215] [1.208] [1.209] [1.203] [1.204] [1.210] [1.211]
Loan to Deposit Ratio {t-1} -19.27*** -19.02*** -18.36*** -17.94*** -18.73*** -18.51*** -19.62*** -19.32***
[6.615] [6.624] [6.576] [6.585] [6.542] [6.550] [6.597] [6.604]
Board Size {t-1} -0.205 -0.197 -0.36 -0.388 -0.312 -0.299 -0.186 -0.171
[0.321] [0.323] [0.337] [0.347] [0.322] [0.324] [0.323] [0.329]
Risk-Weighted Capital Ratio {t-1} 3.109** 3.119** 2.928** 2.902** 2.717** 2.683** 2.901** 2.771**
[1.215] [1.286] [1.207] [1.277] [1.212] [1.283] [1.209] [1.280]
Constant -0.408 -0.362 0.213 0.374 -0.723 -0.657 -0.31 -0.264
[0.848] [0.858] [1.454] [1.511] [0.849] [0.857] [0.851] [0.857]
Bank Fixed Effects Yes Yes Yes Yes Yes Yes Yes Yes
Year Fixed Effects Yes Yes Yes Yes Yes Yes Yes Yes
Observations 730 729 730 729 730 729 729 728
Number of Banks 87 87 87 87 87 87 87 87
R-squared - within 0.53 0.53 0.54 0.54 0.53 0.54 0.53 0.53
R-squared - between 0.33 0.03 0.03 0.78 0.7 0.01 0.12 0.55
R-squared - overall 0.24 0.24 0.26 0.26 0.22 0.22 0.25 0.24
10th percentile): -22.10 -22.50 -20.10 -20.50 -19.10 -19.40 -21.10 -21.20
[7.2]*** [7.3]*** [7.15]*** [7.3]*** [7.2]*** [7.4]*** [7.2]*** [7.4]***
90th percentile): 7.80 7.60 5.80 5.60 7.00 6.70 7.40 6.70
[5.1] [5.1] [5.1] [5.1] [5.0] [5.1] [5.0] [5.1]
Notes: This table shows the results of Instrumental Variables regressions. The dependent variable is banks' Revenue to Expense Ratio. The explanatory variables are as described in Table 1. The coefficients describe the impact of a one-unit increase in the explanatory variable on percentage points changes in banks' Revenue to Expense Ratio. All regressions contain bank and year fixed effects. The instrumented variable is the Blau Index measure of gender diversity. The set of instuments consists of: the share of independent directors, bank and year fixed effects, and the 1999 (beginning of sample) value of the Blau Index interacted with the year dummies. Robust standard errors in parentheses. *** p<0.01, ** p<0.05, * p<0.1
Table 2: The Role of Gender Diversity, Board Experience and Balance Sheet Traits in Determining US Banks' Revenue to Expense Ratio 1999 - 2015
Marginal effect of a one standard deviation increase in the Blau index, for well-capitalized banks (at the 90th percentile) with low Blau index (at the
Marginal effect of a one standard deviation increase in the Blau index, for well-capitalized banks (at the 90th percentile) with high Blau index (at the
[1] [2] [3] [4] [5] [6] [7] [8]
25
Gender Diversity
[image:27.612.45.589.49.706.2]Blau Index {t-1} 0.289*** 0.276** 0.285*** 0.270** 0.273** 0.257** 0.285*** 0.272**
[0.106] [0.110] [0.106] [0.110] [0.107] [0.111] [0.104] [0.108]
Blau Index {t-1} * Risk-Weighted
Capital Ratio {t-1} -0.0215*** -0.0207*** -0.0213*** -0.0204*** -0.0200*** -0.0190** -0.0210*** -0.0202***
[0.00751] [0.00783] [0.00753] [0.00784] [0.00760] [0.00792] [0.00745] [0.00778]
Blau Index {t-1} * Blau Index {t-1} -0.00619*** -0.00598*** -0.00603*** -0.00581** -0.00593*** -0.00567** -0.00612*** -0.00591***
[0.00221] [0.00226] [0.00222] [0.00227] [0.00224] [0.00229] [0.00218] [0.00223]
Blau Index {t-1} * Blau Index {t-1} *
Risk-Weighted Capital Ratio {t-1} 0.000467*** 0.000453*** 0.000455*** 0.000442*** 0.000441*** 0.000424*** 0.000457*** 0.000444***
[0.000158] [0.000162] [0.000158] [0.000162] [0.000160] [0.000164] [0.000156] [0.000160]
Board Characteristics
Average Wealth of Board Members {t-1} -0.0114 -0.0116 -0.0000966 -0.0129
[0.0769] [0.0777] [0.0767] [0.0768]
Average Age of Board Members {t-1} -0.439 -0.106 -0.356 0.558
[1.697] [1.854] [1.696] [2.012]
Average Bank Board Tenure {t-1} -0.185 -0.144
[0.542] [0.593]
Spread of Bank Board Tenure {t-1} -0.408 -0.4
[0.310] [0.313]
Average Board Experience {t-1} -0.233 -0.232
[0.498] [0.499]
Spread of Board Experience {t-1} 0.458** 0.465**
[0.218] [0.218]
Average Overall Board Tenure {t-1} -0.366 -0.393
[0.272] [0.325]
Spread of Overall Board Tenure {t-1} -0.298*** -0.297***
[0.101] [0.101]
Bank Characteristics
Acquisition Dummy {t-1} -0.149* -0.136* -0.153* -0.141* -0.138* -0.126 -0.136* -0.126
[0.0796] [0.0795] [0.0797] [0.0796] [0.0795] [0.0794] [0.0792] [0.0792]
Loan to Deposit Ratio {t-1} -0.814* -0.793* -0.793* -0.767* -0.829* -0.809* -0.848* -0.820*
[0.438] [0.438] [0.438] [0.438] [0.436] [0.436] [0.436] [0.435]
Board Size {t-1} 0.0047 0.00626 -0.00112 0.000448 -0.00299 -0.00169 0.00374 0.00329
[0.0221] [0.0223] [0.0233] [0.0243] [0.0223] [0.0226] [0.0221] [0.0226]
Risk-Weighted Capital Ratio {t-1} 0.183** 0.178** 0.183** 0.178** 0.169** 0.163** 0.176** 0.170**
[0.0760] [0.0811] [0.0760] [0.0812] [0.0763] [0.0815] [0.0757] [0.0810]
Constant -0.0879 -0.0843 -0.058 -0.0609 -0.0884 -0.0847 -0.0734 -0.0733
[0.0549] [0.0554] [0.0939] [0.0981] [0.0552] [0.0557] [0.0549] [0.0552]
Bank Fixed Effects Yes Yes Yes Yes Yes Yes Yes Yes
Year Fixed Effects Yes Yes Yes Yes Yes Yes Yes Yes
Observations 632 631 632 631 632 631 631 630
Number of Banks 82 81 82 81 82 81 82 81
R-squared - within 0.35 0.35 0.37 0.37 0.36 0.36 0.35 0.35
R-squared - between 0.07 0.08 0.05 0.02 0.03 0.14 0.02 0.1
R-squared - overall 0.11 0.11 0.12 0.12 0.09 0.09 0.12 0.12
10th percentile): -0.97 -0.96 -0.98 -0.98 -0.85 -0.84 -0.91 -0.9
[0.46]** [0.47]** [0.46]** [0.47]** [0.46]* [0.47]* [0.46]** [0.47]*
90th percentile): 0.62 0.6 0.58 0.56 0.59 0.56 0.6 0.6
[0.32]* [0.32]* [0.33]* [0.33]** [0.32]* [0.32]* [0.32]** [0.32]**
Notes: This table shows the results of Instrumental Variables regressions. The dependent variable is banks' Return on Assets. The explanatory variables are as described in Table 1. The coefficients describe the impact of a one-unit increase in the explanatory variable on percentage points changes in banks' Return on Assets. All regressions contain bank and year fixed effects. The instrumented variable is the Blau Index measure of gender diversity. The set of instuments consists of: the share of independent directors, bank and year fixed effects, and the 1999 (beginning of sample) value of the Blau Index interacted with the year dummies. Robust standard errors in parentheses. *** p<0.01, ** p<0.05, * p<0.1
Table 3: The Role of Gender Diversity, Board Experience and Balance Sheet Traits in Determining US Banks' Return on Assets 1999 - 2015
Marginal effect of a one standard deviation increase in the Blau index, for well-capitalized banks (at the 90th percentile) with low Blau index (at the
Marginal effect of a one standard deviation increase in the Blau index, for well-capitalized banks (at the 90th percentile) with high Blau index (at the
26
Gender Diversity
[image:28.612.46.590.49.700.2]Blau Index {t-1} -0.354* -0.366* -0.356* -0.374* -0.338* -0.342* -0.345* -0.337*
[0.193] [0.201] [0.193] [0.201] [0.196] [0.204] [0.192] [0.201]
Blau Index {t-1} * Risk-Weighted
Capital Ratio {t-1} 0.0182 0.0197 0.0186 0.0207 0.017 0.018 0.0176 0.0178
[0.0137] [0.0144] [0.0137] [0.0144] [0.0140] [0.0146] [0.0137] [0.0144]
Blau Index {t-1} * Blau Index {t-1} 0.00898** 0.00930** 0.00919** 0.00967** 0.00863** 0.00879** 0.00881** 0.00874**
[0.00403] [0.00413] [0.00403] [0.00413] [0.00410] [0.00421] [0.00401] [0.00412]
Blau Index {t-1} * Blau Index {t-1} *
Risk-Weighted Capital Ratio {t-1} -0.000372 -0.000395 -0.000391 -0.00043 -0.000349 -0.000362 -0.00036 -0.000358
[0.000286] [0.000295] [0.000287] [0.000295] [0.000291] [0.000300] [0.000285] [0.000294]
Board Characteristics
Average Wealth of Board Members {t-1} -0.0496 -0.0559 -0.0552 -0.0522
[0.141] [0.142] [0.141] [0.142]
Average Age of Board Members {t-1} 6.187** 6.627* 6.268** 6.071
[3.099] [3.391] [3.106] [3.730]
Average Bank Board Tenure {t-1} 0.948 0.0533
[1.063] [1.166]
Spread of Bank Board Tenure {t-1} -0.833 -0.949
[0.632] [0.636]
Average Board Experience {t-1} -0.173 -0.319
[0.915] [0.919]
Spread of Board Experience {t-1} -0.174 -0.181
[0.398] [0.400]
Average Overall Board Tenure {t-1} 0.614 0.0629
[0.512] [0.618]
Spread of Overall Board Tenure {t-1} -0.0402 -0.0496
[0.185] [0.186]
Bank Characteristics
Acquisition Dummy {t-1} 0.147 0.124 0.153 0.125 0.145 0.125 0.15 0.127
[0.145] [0.146] [0.145] [0.146] [0.146] [0.146] [0.146] [0.146]
Loan to Deposit Ratio {t-1} -0.285 -0.252 -0.233 -0.212 -0.29 -0.262 -0.27 -0.267
[0.794] [0.796] [0.794] [0.795] [0.795] [0.796] [0.796] [0.798]
Board Size {t-1} -0.028 -0.0403 -0.0216 -0.0473 -0.0265 -0.0397 -0.0243 -0.0403
[0.0401] [0.0406] [0.0425] [0.0444] [0.0408] [0.0413] [0.0405] [0.0417]
Risk-Weighted Capital Ratio {t-1} -0.177 -0.202 -0.177 -0.206 -0.166 -0.187 -0.171 -0.184
[0.138] [0.148] [0.138] [0.148] [0.140] [0.150] [0.139] [0.149]
Constant 0.022 -0.00767 -0.106 -0.0126 0.0283 0.0012 0.00923 -0.01
[0.108] [0.109] [0.185] [0.193] [0.110] [0.111] [0.109] [0.110]
Bank Fixed Effects Yes Yes Yes Yes Yes Yes Yes Yes
Year Fixed Effects Yes Yes Yes Yes Yes Yes Yes Yes
Observations 615 614 615 614 615 614 614 613
Number of Banks 82 81 82 81 82 81 82 81
R-squared - within 0.32 0.33 0.36 0.34 0.31 0.33 0.33 0.34
R-squared - between 0.04 0.04 0.03 0.04 0.04 0.04 0.04 0.04
R-squared - overall 0.02 0.02 0.03 0.02 0.02 0.02 0.02 0.02
10th percentile): -0.48 -0.32 -0.42 -0.21 -0.53 -0.38 -0.50 -0.35
[0.83] [0.86] [0.84] [0.86] [0.84] [0.87] [0.84] [0.87]
90th percentile): 1.70 1.80 1.70 1.70 1.70 1.80 1.70 1.90
[0.59]*** [0.60]*** [0.60]*** [0.60]*** [0.59]*** [0.60]*** [0.59]*** [0.60]***
Notes: This table shows the results of Instrumental Variables regressions. The dependent variable is banks' Share of Nonperforming Assets. The explanatory variables are as described in Table 1. The coefficients describe the impact of a one-unit increase in the explanatory variable on percentage points changes in banks' Share of Nonperforming Assets. All regressions contain bank and year fixed effects. The instrumented variable is the Blau Index measure of gender diversity. The set of instuments consists of: the share of independent directors, bank and year fixed effects, and the 1999 (beginning of sample) value of the Blau Index interacted with the year dummies. Robust standard errors in parentheses. *** p<0.01, ** p<0.05, * p<0.1
Table 4: The Role of Gender Diversity, Board Experience and Balance Sheet Traits in Determining US Banks' Share of Nonperforming Assets 1999 - 2015
Marginal effect of a one standard deviation increase in the Blau index, for well-capitalized banks (at the 90th percentile) with low Blau index (at the
Marginal effect of a one standard deviation increase in the Blau index, for well-capitalized banks (at the 90th percentile) with high Blau index (at the
27
Gender Diversity
Blau Index {t-1} 33.05*** 32.67*** 32.82*** 32.39*** 33.45*** 33.29*** 31.34*** 28.67***
[9.001] [9.017] [9.000] [9.006] [9.162] [9.183] [8.915] [8.831]
Blau Index {t-1} * Risk-Weighted
Capital Ratio {t-1} -2.400*** -2.366*** -2.387*** -2.350*** -2.425*** -2.405*** -2.273*** -2.091***
[0.665] [0.667] [0.665] [0.666] [0.678] [0.680] [0.660] [0.656]
Blau Index {t-1} * Blau Index {t-1} -0.714*** -0.706*** -0.712*** -0.703*** -0.737*** -0.732*** -0.669*** -0.619***
[0.197] [0.197] [0.197] [0.197] [0.202] [0.202] [0.195] [0.193]
Blau Index {t-1} * Blau Index {t-1} *
Risk-Weighted Capital Ratio {t-1} 0.0534*** 0.0526*** 0.0533*** 0.0525*** 0.0546*** 0.0541*** 0.0501*** 0.0462***
[0.0143] [0.0143] [0.0144] [0.0144] [0.0147] [0.0147] [0.0142] [0.0141]
Board Characteristics
Average Wealth of Board Members {t-1} -5.923 -5.944 -6.359 -6.85
[5.791] [5.835] [5.806] [5.760]
Average Age of Board Members {t-1} -22.73 -33.24 -12.43 -268.6
[150.8] [164.7] [151.1] [182.5]
Average Bank Board Tenure {t-1} -1.473 6.393
[51.24] [55.50]
Spread of Bank Board Tenure {t-1} 3.024 1.351
[27.83] [28.06]
Average Board Experience {t-1} -57.63 -58.77
[43.15] [43.23]
Spread of Board Experience {t-1} -6.499 -8.026
[19.10] [19.15]
Average Overall Board Tenure {t-1} 44.14* 69.26**
[24.21] [29.33]
Spread of Overall Board Tenure {t-1} 0.305 -0.375
[8.664] [8.624]
Bank Characteristics
Acquisition Dummy {t-1} 8.296 8.042 8.3 8.115 8.81 8.529 8.82 9.087
[7.208] [7.212] [7.231] [7.241] [7.213] [7.221] [7.197] [7.158]
Loan to Deposit Ratio {t-1} 0.962 0.708 0.918 0.558 -0.802 -1.041 -3.132 -5.802
[40.18] [40.17] [40.29] [40.31] [40.17] [40.17] [40.13] [39.88]
Board Size {t-1} 1.772 1.679 1.776 1.779 1.774 1.678 1.945 2.381
[1.800] [1.820] [1.902] [1.974] [1.825] [1.844] [1.808] [1.838]
Risk-Weighted Capital Ratio {t-1} 21.84*** 21.55*** 21.65*** 21.33*** 21.82*** 21.65*** 20.85*** 19.30***
[6.987] [6.997] [6.977] [6.982] [7.043] [7.055] [6.964] [6.914]
Constant -9.192* -9.294* -8.972 -10.16 -8.393 -8.527 -9.998* -9.455*
[5.126] [5.166] [9.009] [9.307] [5.157] [5.193] [5.134] [5.121]
Bank Fixed Effects Yes Yes Yes Yes Yes Yes Yes Yes
Year Fixed Effects Yes Yes Yes Yes Yes Yes Yes Yes
Observations 609 609 609 609 609 609 608 608
Number of Banks 86 86 86 86 86 86 86 86
R-squared - within 0.01 0.01 0.01 0.01 0.01 0.01 0.01 0.01
R-squared - between 0.13 0.12 0.13 0.12 0.08 0.03 0.12 0.13
R-squared - overall 0.01 0.01 0.01 0.01 0.02 0.03 0.01 0.01
10th percentile): -99.10 -99.66 -99.20 -96.80 -99.50 -97.40 -93.50 -87.80
[44.4]** [44.4]** [44.2]** [44.2]** [44.9]** [44.8]** [44.3]** [44.1]**
90th percentile): 77.70 75.90 77.90 75.30 76.30 75.00 73.90 64.50
[29.8]** [29.7]*** [30.1]*** [29.9]*** [29.9]*** [29.9]*** [29.7]** [29.5]**
Notes: This table shows the results of Instrumental Variables regressions. The dependent variable is banks' Ratio of CEO To Average Staff Pay. The explanatory variables are as described in Table 1. The coefficients describe the impact of a one-unit increase in the explanatory variable on percentage points changes in banks' Ratio of CEO To Average Staff Pay. All regressions contain bank and year fixed effects. The instrumented variable is the Blau Index measure of gender diversity. The set of instuments consists of: the share of independent directors, bank and year fixed effects, and the 1999 (beginning of sample) value of Blau Index interacted with the year dummies. Robust standard errors in parentheses. *** p<0.01, ** p<0.05, * p<0.1
Table 5: The Role of Gender Diversity, Board Experience and Balance Sheet Traits in Determining US Banks' Ratio of CEO To Average Staff Pay 1999 - 2015
Marginal effect of a one standard deviation increase in the Blau index, for well-capitalized banks (at the 90th percentile) with low Blau index (at the
Marginal effect of a one standard deviation increase in the Blau index, for well-capitalized banks (at the 90th percentile) with high Blau index (at the