Adiabatic Shearing Localisation in High Strain Rate Deformation of Al-Sc Alloy
Woei-Shyan Lee
1;*, Tao-Hsing Chen
2, Chi-Feng Lin
3and Ging-Ting Lu
11Department of Mechanical Engineering, National Cheng Kung University, Tainan 701, Taiwan, R. O. China 2Center for Micro/Nano Science and Technology, National Cheng Kung University, Tainan 701, Taiwan, R. O. China 3
National Center for High-Performance Computing, Hsin-Shi Tainan County 744, Taiwan, R. O. China
Aluminium-scandium (Al-Sc) alloy is subjected to shear deformation at high strain rates ranging from3:0105s1to6:2105s1using
a compressive-type split-Hopkinson pressure bar (SHPB). The effects of the strain rate on the shear stress, adiabatic shear band characteristics, and fracture features of the Al-Sc alloy are systematically examined. The results show that both the shear stress and the strain rate sensitivity increase with an increasing strain rate. In addition, it is shown that an adiabatic shear band is formed within the deformed specimens for all values of the strain rate. As the strain rate is increased, the width of the shear band decreases, but the microhardness increases. Moreover, the distortion angle and the magnitude of the local shear strain near the shear band both increase with an increasing strain rate. At a strain rate of 3:0105s1, the fracture surface is characterised by multiple transgranular clearage fractures. However, for strain rates greater than
4:4105s1, the fracture surface has a transgranular dimple-like characteristic, and thus it is inferred that the ductility of the Al-Sc alloy
improves with an increasing strain rate. [doi:10.2320/matertrans.M2010053]
(Received February 12, 2010; Accepted April 26, 2010; Published June 16, 2010)
Keywords: aluminium-scandium alloy, strain rate sensitivity, adiabatic shearing, precipitates
1. Introduction
The mechanical properties and microstructure of alumi-nium (Al) alloy are strongly affected by the addition of small quantities of scandium (Sc).1–3)Various studies have shown that the addition of Sc to Al alloys prompts the formation of a thermo-stable Ll2-type Al3Sc phase and leads to a significant
improvement in the alloy strength.4–6) As a result, Al-Sc alloys are used in a wide variety of sports, transportation and aerospace applications.7,8)In many of these applications, the
Al-Sc components are subjected to severe dynamic or impact loads, and exhibit a quite different behaviour to that observed under quasi-static loading conditions. Therefore, in develop-ing Al-Sc components with an enhanced deformation and fracture performance in typical real-world service environ-ments, it is necessary to obtain detailed insights into the strain-rate properties and failure characteristics of Al-Sc alloy under extreme loading conditions; particularly those characterised by a high shear rate.
During high strain rate deformation, metals and alloys frequently form narrow zones of highly localised flow, referred to as adiabatic shear bands. This deformation mode is commonly observed in ballistic impacts, explosive frag-mentation, and high-speed metal forming and fabrication9–12) and has important implications in terms of loading con-ditions. It is widely believed that the formation of adiabatic shear bands is the result of a thermally-induced plastic instability effect, which suppresses work hardening in the deformed region. This instability effect typically arises when the rate at which heat is generated as a result of local plastic flow exceeds that at which it is dissipated to the surrounding material. In Al alloys doped with Sc, formation of intense shear bands during high strain rate loading is generally attributed to the presence of Al3Sc precipitates within the
Al matrix, which promote localised shear deformation as a result of their role in prompting the repeated motion of dislocation pairs within the deformed microstructure.
The beneficial effects of Sc addition on the precipitation and recrystallisation behaviour,13,14)age hardening,15)creep
and yielding behaviour,16)fatigue performance,17)and high
strain rate deformation response18–21) of high strength Al
alloys have attracted significant attention in the literature. However, the adiabatic shearing behaviour of Al-Sc alloys is still relatively unclear. Accordingly, the present study utilises a compressive-type split-Hopkinson pressure bar (SHPB) to conduct a systematic investigation into the adiabatic shearing behaviour of Al-Sc alloy under extreme shear rates ranging from3:0105s1 to6:2105s1. The
results provide a useful insight into the effects of the strain rate on the shear stress, adiabatic shear band characteristics, and fracture features of Al-Sc alloy under high shear rate loading conditions.
2. Material and Experimental Procedure
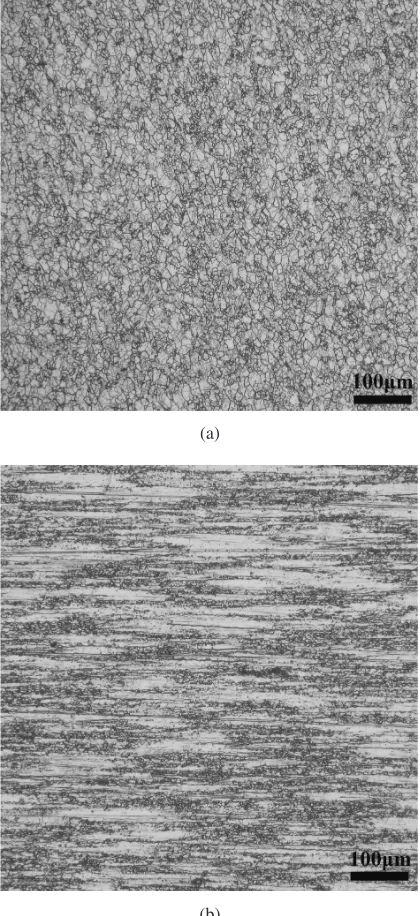
The Al-Sc alloy used in the shear deformation tests was provided by Taiwan Hodaka Technology Co. Ltd in the form of hot extrusion bars. Utilising ICP-AES (inductively coupled plasma atomic emission spectroscopy), the chemical composition (mass%) of the Al-Sc alloy was determined to be as follows: Si-0.05, Mg-2.31, Zn-6.64, Fe-0.1, Sc-0.13, Zr-0.1, and a balance of Al. Upon receipt, the Al-Sc alloy bars were homogenised in air at 480C for 16 h, water quenched to room temperature, solution treated in air at 465C for 60 min, and quenched once again in water to room temperature. The solution-treated bars were then processed using a double-aging heat treatment operation performed first at 300C for 5 h and then at 400C for 10 h. Finally, the bars were quenched to room temperature in water. Figures 1(a) and 1(b) present the optical microstructures of an unde-formed Al-Sc alloy specimen following the solution and aging treatments along the transverse and longitudinal directions, respectively.
The compressive SHPB tests were performed using hat-shaped specimens with the dimensions shown in Fig. 2(a). Note that the tests were specifically conducted using
shaped specimens rather than conventional cylindrical speci-mens in order to ensure that the compressive stress-wave produced by the impact of the incident bar generated an adiabatic shear-wave and prompted localised shear deforma-tion within the narrow region of the specimen. As in the compressive SHPB experiments presented by the current authors in,22)a stopper ring was fitted around the head of the
SHPB transmitted bar and the specimen using a pressure screw in order to prevent the rim of the specimen from assuming a barrel-like shape during the impact test, thereby degrading the accuracy of the shear band width measurement (see Fig. 2(b)). In each test, the shear stress () and compression displacement (D) were determined from the measured strain of the transmitted stress pulse ("t) and the
measured strain of the reflected stress pulse ("r) in
accord-ance with
¼ 2EA"t
ðd1þd2Þt
ð1Þ
and
D¼ 2C0 Z
"rdt ð2Þ
respectively, where A is the cross-sectional area of the incident bar and transmitted bar,E andC0 are the Young’s
modulus and sonic wave speed of the incident bar and transmitted bar, respectively, andd1,d2andtare the external
diameter, internal diameter and shear zone thickness of the specimen, respectively. The nominal shear strain () and nominal strain rate (_) were then computed in accordance with
¼D
¼
2C0
Z
"rdt ð3Þ
_
¼2C0
"r ð4Þ
where is the width of the shear band as measured using an optical microscope. The correlation between the com-pression displacementDand the width of the shear band
is illustrated schematically in the bottom-right corner of Fig. 2(b). In the compression tests, the specimens were deformed at strain rates of 3:0105s1,4:4105s1 and 6:2105s1, respectively, to a constant final displacement
of D¼0:1mm, resulting in the formation of a shear band within the shear zone of each specimen. As shown in Fig. 3, the impact prompted the specimens to fracture (i.e. crack) in the region immediately ahead of the tail end of the adiabatic shear band.
(a)
(b)
Fig. 1 Optical micrographs of undeformed Al-Sc alloy specimen in: (a) transverse direction; (b) longitudinal direction.
(a)
(b)
[image:2.595.322.536.71.357.2] [image:2.595.64.274.75.533.2] [image:2.595.381.537.590.637.2]Following the impact tests, a metallographic analysis was performed using an Axiovert 200MAT optical microscope. The deformed specimens were sectioned parallel to their longitudinal axis and were then etched with Keller’s reagent (HF 1 mL, HNO3 5 mL and H2O 190 mL) to reveal the
adiabatic shear band. The variation of the microhardness across the localised shear band and the matrix was measured on polished and etched cross-sections using a Matsugawa 700 microhardness tester with a load of 100 g. Finally, the fracture surfaces of the deformed specimens were observed using a JEOL JXA-840 scanning electron microscope (SEM) with an accelerating potential of 20 kV.
3. Results and Discussions
3.1 Shear stress-displacement response
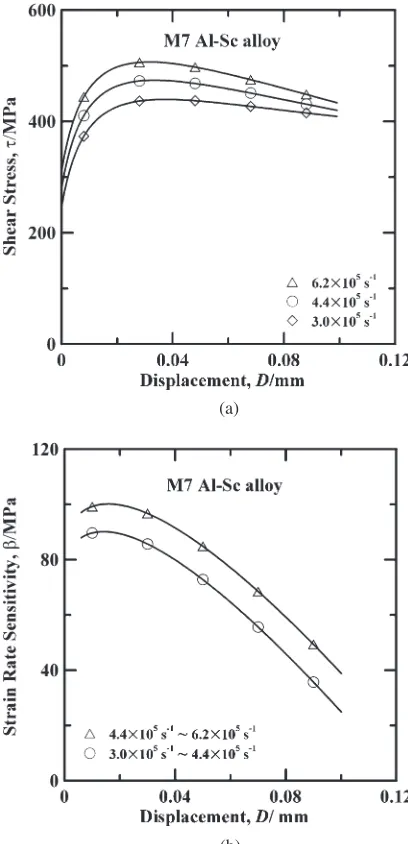
Figure 4(a) illustrates the variation of the shear stress with the displacement for Al-Sc alloy specimens deformed at strain rates of3:0105s1,4:4105s1and6:2105s1,
respectively. It is observed that in every case, the shear stress profiles have a parabolic appearance, i.e. the flow stress increases initially with an increasing displacement, attains a peak stress value at the critical displacement point, and then softens as a result of adiabatic heating. Moreover, it is evident that the flow stress is highly sensitive to the applied strain rate. Specifically, at low values of the displacement (i.e. prior to the critical displacement point), the rate of increase in the shear stress with increasing displacement is greatest in the specimen deformed under the highest strain rate (6:2105s1). Similarly, in the softening plastic deforma-tion range, the shear stress drops more rapidly in the
specimen tested under a strain rate of6:2105s1 than in
those tested under lower strain rates of 3:0105s1 and 4:4105s1, respectively. Table 1 summarises the variation
in the maximum stress and maximum strain as a function of the strain rate. The results show that both the maximum stress and the maximum strain increase with an increasing strain rate.
The shear stress-displacement curves presented in Fig. 4(a) demonstrate that the shear deformation behaviour of the current Al-Sc alloy is fundamentally dependent upon
Fig. 3 Optical micrograph of shear zone in Al-Sc alloy specimen deformed at strain rate of6:2105s1.
(a)
(b)
[image:3.595.88.254.71.364.2]Fig. 4 (a) Shear stress-displacement curves of Al-Sc alloy specimens as function of strain rate; (b) strain rate sensitivity-displacement curves as function of strain rate.
Table 1 Variation of maximum shear stress and maximum shear strain as function of strain rate.
Strain rate (s1)
Max. shear stress
(MPa) Max. shear strain
3:0105 438.20 3.14
4:4105 470.75 3.95
[image:3.595.323.527.72.494.2] [image:3.595.305.549.585.647.2]the strain rate. The change in the shear stress induced by an increasing strain rate can be evaluated using the following strain rate sensitivity parameter:23)
¼ @
@ln _ ¼
21 lnð_2=_1Þ
ð5Þ
where the shear stress values2and1 are obtained in tests
conducted at constant strain rates of_2 and_1, respectively,
and are calculated at the same value of the displacement. Figure 4(b) plots the variation of the strain rate sensitivity () with the displacement (D) as a function of the strain rate. It can be seen that for both strain rate ranges, the strain rate sensitivity increases slightly with an increasing displacement at lower values ofD(i.e.D<0:01mm). However, for larger displacements (i.e.D>0:01mm), the strain rate sensitivity decreases rapidly with an increasing displacement, which suggests that the shear deformation process is dominated by the effects of thermal softening rather than work hardening.
3.2 Optical microscopy (OM) observations
It is well known that for engineering materials such as the Al-Sc alloy considered in this study, the strain rate affects not only the shear stress-displacement response, but also the formation of adiabatic shear bands. Although an increased strain rate prompts an increased shear stress, in the event of a significant increase in the strain rate, only a small fraction of the work required to deform the material is actually stored, while the remainder is converted into heat. As a result, adiabatic conditions are induced, and hence work softening takes place. During deformation under adiabatic conditions, the thermal softening effect counteracts the microstructural stability imparted by work hardening, and therefore produces a material instability effect. Once this instability condition has been attained, an extreme localisation of the deformation occurs, and thus adiabatic shear bands are formed.
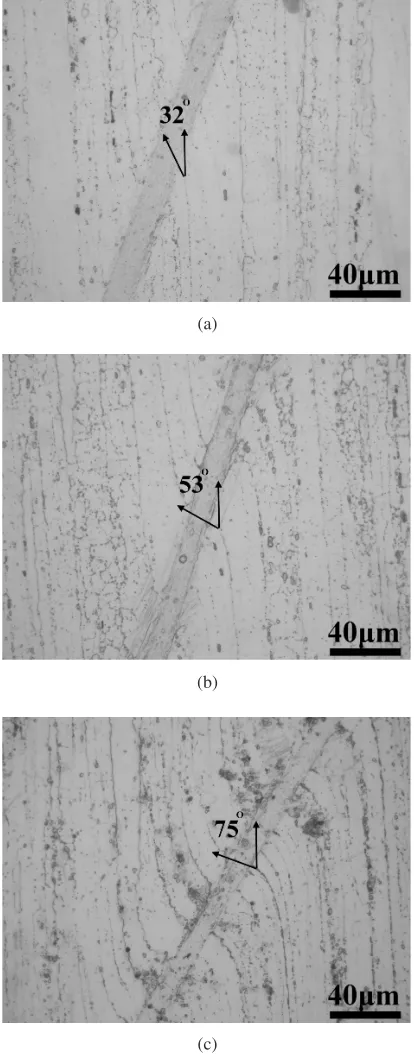
Optical microscopy observations of the present deformed Al-Sc specimens reveal that adiabatic shearing acts as the primary deformation mechanism under each of the consid-ered strain rates. Figures 5(a)–5(c) show the adiabatic shear bands formed in Al-Sc specimens deformed at strain rates of 3:0105s1,4:4105s1and6:2105s1, respectively.
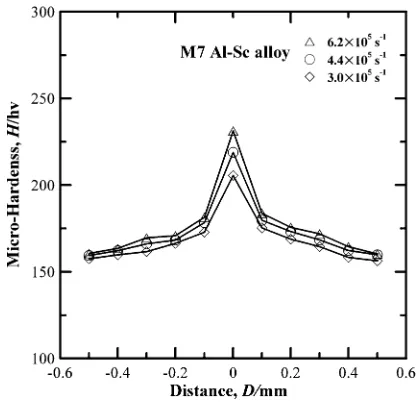
The optical micrographs reveal that an obvious microstruc-tural change takes place within the shear band in each case. Moreover, while the morphology of the adiabatic shear bands formed under the three strain rates are broadly similar, the width of the adiabatic shear band is markedly different in every case. Table 2 summarises the width of the adiabatic shear bands formed in the present Al-Sc alloy specimens and shows that the width decreases as the strain rate is increased. Figures 5(a)–5(c) show that the direction of the extrusion flow line seen on the matrix is changed dramatically within the shear localization region for each specimen. It was shown in Ref. 24) that the local shear strain () near the adiabatic shear band can be estimated directly from the angular distortion of the shear localisation region in accordance with ¼tan. Table 2 summarises the distortion angle and local shear strain of the current Al-Sc alloy specimens for each of the considered strain rates. It is observed that the distortion angle and the local shear strain both increase with increasing strain rate. The variation of the local shear strain
prompts a corresponding change in the microhardness. Figure 6 illustrates the variation of the microhardness across the adiabatic shear bands in the present Al-Sc alloy speci-mens. It can be seen that for a given strain rate, the microhardness attains its maximum value in the centre of the band. It is also observed that the microhardness of the adiabatic shear band increases with an increasing strain rate. It is thought that the enhancement in the shear band microhardness is the result of an increasing microstructural distortion and an increased degree of localised shear deformation as the strain rate is increased.
(a)
(b)
(c)
Fig. 5 Optical micrographs of adiabatic shear bands in Al-Sc alloy specimens deformed at strain rates of: (a)3:0105s1; (b)4:4105s1;
[image:4.595.323.530.75.602.2]3.3 Fractographic observations
[image:5.595.321.529.72.273.2]In this study, the strain-rate dependence of the shear flow response of the Al-Sc alloy specimens was clarified by examining the SEM images of the shear-failed specimens. Figures 7(a)–7(c) present SEM fractographs of specimens tested at strain rates of 3:0105s1, 4:4105s1 and 6:2105s1, respectively. The images show that for each value of the strain rate, cracks initiate at the interface between the adiabatic shear band and the matrix and then propagate along the adiabatic shear band. Although the detailed fracture
Table 2 Variation of adiabatic shear band width, distortion angle and local shear strain as function of strain rate.
Strain rate (s1)
Band width (mm)
Distortion angle ()
Local shear strain
3:0105s1 28.8 32 0.63
4:4105s1 25.3 53 1.33
6:2105s1 22.8 75 4.01
Fig. 6 Profiles of adiabatic shear band microhardness in Al-Sc alloy specimens deformed at different strain rates.
(a) (b)
(c)
(d)
Fig. 7 Fracture morphologies of Al-Sc alloy specimens deformed at strain rates of: (a)3:0105s1; (b) 4:4105s1; and (c)
6:2105s1. (d) Fracture initiation at matrix-Al
3Sc precipitate interface in Al-Sc alloy specimen deformed at strain rate of
[image:5.595.45.291.93.158.2] [image:5.595.85.515.319.745.2]features and characteristics vary in accordance with the magnitude of the applied strain rate, it can be seen that all the specimens fail as a result of intensive localised shearing. In Fig. 7(a), corresponding to a specimen deformed at a strain rate of 3:0105s1, it is observed that the fracture
surface is flat and has multiple transgranular cleavage fractures. For an increased strain rate of 4:4105s1,
Fig. 7(b) shows that the fracture surface has a dimple-like transgranular structure, which implies that the fracture mode transits to one of ductile failure as the strain rate is increased. Figure 7(c) presents an SEM fractograph of the Al-Sc specimen deformed at a strain rate of 6:2105s1. It can
be seen that the fracture surface is characterised by the presence of many dimples along the shear direction. Comparing Figs. 7(c) and 7(b), it is evident that the dimple density increases with an increasing strain rate. Thus, it is inferred that the present Al-Sc alloy becomes increasingly ductile as the strain rate is increased.
The facture surfaces in the SEM images presented in Figs. 7(a)–7(c) contain a random distribution of fine Al3Sc
precipitates, as identified by using energy dispersive X-ray spectroscopy analysis. These precipitates have a significant effect on the fracture behaviour of the Al-Sc alloy. For example, the SEM image presented in Fig. 7(d), correspond-ing to a specimen deformed at a strain rate of4:4105s1,
shows that fracture initiation takes place as a result of a decohesion effect at the matrix-precipitate interface. The nucleation, propagation and eventual coalescence of these micro-cracks results in the formation of a continuous fracture surface and leads to the eventual catastrophic failure of the specimen along the adiabatic shear band.
4. Conclusions
This study has investigated the effects of high strain rate deformation on the adiabatic shearing behaviour and fracture characteristics of Al-Sc alloy. The results have shown that the shear stress and strain rate sensitivity both increase with an increasing strain rate. Furthermore, for all values of the considered strain rate, a severe localised shearing effect is induced within the deformed specimen which prompts the formation of an adiabatic shear band. As the strain rate is increased, the width of the adiabatic shear band reduces, but its microhardness increases. The SEM images have shown that the fracture surface is characterised by multiple trans-granular cleavage fractures at lower values of the strain rate (i.e. 3:0105s1), but has a transgranular dimple-like
appearance at higher values of the strain rate (i.e. 6:2
105s1). Thus, it is inferred that the ductility of the present Al-Sc alloy improves with an increasing strain rate.
Acknowledgement
The authors gratefully acknowledge the financial support provided to this study by the National Science Council (NSC) of Taiwan under contract no. NSC 96-2221-E-006-048. The authors also wish to express their appreciation to Taiwan Hodaka Technology Co. Ltd. for their supply of Al-Sc alloy bars.
REFERENCES
1) S. Lathabai and P. G. Lloyd: Acta Mater.50(2002) 4275–4292. 2) G. M. Novotny and A. J. Ardell: Mater. Sci. Eng. A318(2001) 144–
154.
3) D. N. Seidman, E. A. Marguis and D. C. Dunand: Acta Mater.50 (2002) 4021–4035.
4) V. Jindal, P. K. De and K. Venkateswarlu: Mater. Lett.60(2006) 3373– 3375.
5) R. A. Karnesky, M. E. van Dalen, D. C. Dunand and D. N. Seidman: Scr. Mater.55(2006) 437–440.
6) J. H. Kim, J. H. Kim, J. T. Yeom, D. G. Lee, S. G. Lim and N. K. Park: J. Mater. Process. Technol.187–188(2007) 635–639.
7) B. Irving: Weld. J.76(1997) 53–57.
8) K. Venkateswarlu, L. C. Pathak, A. K. Ray, G. Das, P. K. Verma, M. Kuwar and R. N. Ghosh: Mater. Sci. Eng. A383(2004) 374–380. 9) M. G. da Silva and K. T. Ramesh: Mater. Sci. Eng. A232(1997) 11–22. 10) S. C. Liao and J. Duffy: J. Mech. Phys. Solids46(1998) 2201–2231. 11) A. G. Odeshi, S. Al-ameeri and M. N. Bassim: J. Mater. Process.
Technol.162–163(2005) 385–397.
12) M. A. Meyers, Y. B. Xu, Q. Xue, M. T. Perey-Prado and T. R. McNelly: Acta Mater.51(2003) 1307–1325.
13) B. Forbord, H. Hallem, N. Ryum and K. Marthinsen: Mater. Sci. Eng. A 387–389(2004) 936–939.
14) M. J. Jones and F. J. Humphreys: Acta Mater.51(2003) 2149–2159. 15) V. Singh, K. S. Prasad and A. A. Gokhale: J. Mater. Sci.39(2004)
2861–2864.
16) E. A. Marguis, D. N. Seidman and D. C. Dunand: Acta Mater.51 (2003) 4751–4760.
17) M. N. Desmukh, R. K. Pandey and A. K. Mukhopadhyay: Scr. Mater. 52(2005) 645–650.
18) W. S. Lee and T. H. Chen: Scr. Mater.54(2006) 1463–1468. 19) W. S. Lee and T. H. Chen: Mater. Chem. Phys.113(2009) 734–745. 20) W. S. Lee, T. H. Chen and Q. J. Gong: Mater. Trans.48(2007) 500–
509.
21) W. S. Lee and T. H. Chen: Mater. Sci. Technol.24(2008) 1271–1282. 22) W. S. Lee, C. Y. Liu and T. H. Chen: J. Nucl. Mater.374(2008) 313–
319.
23) S. S. Ezz, Y. Q. Sun and P. B. Hirsch: Mater. Sci. Eng. A192–193 (1995) 45–52.