Munich Personal RePEc Archive
Daylight saving time and energy
consumption: The case of Argentina
Hancevic, Pedro and Margulis, Diego
Centro de Investigación y Docencia Económicas, CAMMESA
2016
Daylight saving time and energy
consumption: The case of Argentina
Pedro Hancevic
∗Diego Margulis
†April, 2017
Abstract
Daylight saving time (DST) has been actively used as a mechanism for energy conservation and reduction of greenhouse gas emissions. In the case of Argentina, the most recent experiences with DST occurred during the austral summer periods of 2007–08 and 2008–09, when the policy was finally abandoned. The benefits of DST and the size of the (potential) energy savings are still part of an ongoing discussion in a country where energy subsidies imply a heavy fiscal burden. Using a difference-in-differences framework that exploits the quasi-experimental nature of the program implementation, we use hourly data for the 2005–2010 period at the province level and estimate the impact of DST on electricity consumption and on peak demand. The main results are: DST increases total electricity consumption between 0.4% and 0.6%, but decreases peak demand between 2.4% and 2.9%.
JEL codes: Q4, Q54
Keywords: daylight saving time, electricity consumption, peak demand, energy conservation, air pollution
∗Department of Economics, Centro de Investigaci´on y Docencia Econ´omicas (CIDE), Aguascalientes,
Mexico. E-mail: pedro.hancevic@cide.edu
†Compa˜nia Administradora del Mercado Mayorista El´ectrico (CAMMESA), and Universidad de
Buenos Aires (UBA), Buenos Aires, Argentina. E-mail: diegomargulis@cammesa.com.ar
1
Introduction
Daylight saving time (DST or simply summer time) is one of the most popular measures to reduce electricity consumption, and has been adopted by several countries around the world. More than 60 countries use this policy at present, which amounts to approximately 1.8 billion people every year who turn their watches forward by one hour in Spring and set them back by one hour in the Fall.1
The main purpose of summer time is to make better use of daylight by adjusting normal daily activities in accordance with daylight hours, and therefore, save energy. Some countries which are already adopting the policy have considered extending it by moving DST forward by an additional hour (i.e., double DST), or by increasing the number of days during which DST is implemented. Other nations currently not observing DST are considering implementing it. On the other hand, some economies are (re)considering to abandon its practice. In any case, the effectiveness of DST is still part of an ongoing debate.
In particular, Argentina has alternated several episodes of (uneven) application and non-application of DST along its history. The country is located at a longitude in which the UTC-4 and UTC-5 time zones are naturally assigned. The first official time stan-dardization took place in September 25, 1894, when the UTC-4 was adopted. Argentina had its first experience with DST in December 1, 1930, and maintained certain regularity in the observance of the policy until October 1, 1946, when summer time (i.e. UTC-3) remained effective all year-round unto 1963. DST was reintroduced thereafter, but again interrupted in 1970. At that moment, the novel feature was that Argentina did not turn clocks back in the Fall, and, as a result, the country adopted the UTC-3.2
Hence,
1
The original idea of time changes is attributed to Benjamin Franklin, who in the late eighteenth century proposed it, not to save electricity but to reduce consumption of candles by utilizing solar light in an efficient manner. The idea was finally materialized by Germany during World War I with the aim to reduce energy consumption and save resources (especially coal) for armed warfare. More than thirty nations followed DST, most of which interrupted its observance after the war.
2
all subsequent events of DST utilization (i.e. 1974, 1988-1993, and 2007-2009) actually involved a “double” summer time policy (i.e., UTC-2).
The last utilization of double DST occurred during the summer of 2008–2009. How-ever, the debate about the benefits of DST utilization, especially those associated with potential energy savings, are part of the contemporary policy discussion. The issue is not trivial in a country that has been under permanent “energy stress” during the last decade. After the Argentinean Peso (ARS) devaluation in 2002, the government inten-tionally maintained repressed energy prices causing cumulative imbalances in the two main energy sectors: natural gas and electricity. Energy markets were intervened and pricing policies departed from long-run sustainable opportunity costs, most notably in the upstream segments but also in rest of the value chain. The interventionist policy led to one of the largest price-and-tariff freeze in history, particularly for the Buenos Aires Metropolitan Area which roughly represents one third of the country’s population and GDP. Inflation picked up since 2007, and despite the negative fiscal outcomes3
and the visible imbalances derived from these measures, the (weak) policy response did not hap-pen until 2008. A multi-part tariff schedule was introduced and some users (especially the residential sector) who had frozen prices started to receive delayed consumption-based adjustments (see Hancevic et al. (2016)). With the change of government in December 2015, the new president was in a tight spot and decided abrupt energy price adjustments that took place during the first quarter of 2016. Residential users, in particular, re-ceived electric bills with an increment of up to 400%. Despite the energy price and tariff changes, electricity bills still do not fully reflect long-run incremental costs and further tariff adjustments will probably occur in the future.4
However, its utilization as benchmark time has prevailed since March 6, 1969.
3
Government subsidies to the electricity sector have represented on average between 1% to 2% of GDP during the 2010-2015 period. See for exampleNavajas(2015).
4
imple-As a consequence of all the above elements, electricity demand has increased exceed-ingly faster than electricity supply during the last decade, occasioning repeated episodes of power outages and depressed demand. In light of this complex situation where energy efficiency measures and correct opportunity cost pricing rules are required, any additional effort to reduce electricity consumption would be more than welcome. In this paper, we assess the effectiveness of applying double DST (i.e., UTC-2) on hourly electricity con-sumption and on daily peak demand. The latter is important since supply must match demand at every moment in time. Hence, once the less expensive renewable sources are fully used (especially hydro), the system starts to burn fossil fuels (mainly natural gas, fuel-oil and gas-oil) which represent increasing marginal generation costs. Therefore, a reduction of peak power demand could result in substantial cost savings. Finally, from an environmental perspective, potential energy consumption reduction and peak demand reduction could bring about air pollution abatement.
The remaining of the paper is organized as follows. The next section provides a review of the existing literature on DST. Section 3describes the data used while section
4explains the empirical approach followed in this study. Section5presents the estimation results and section6evaluates the environmental impact of the policy. Finally, section 7
concludes the paper.
2
Existing Evidence
The notion of using daylight more efficiently goes back to Franklin (1784), when he proposed that people should get up (and therefore go to bed) earlier, thus decreasing candlelight usage by taking advantage of daylight. Throughout the years, this has re-mained the main motivation in favor of DST: if we move forward the clock, we can have
longer sunlight in the evening, and, as a result, decrease energy consumption in terms of artificial light. Nevertheless, an increased awareness on energy consumption has driven academia to question the reliability of the main motivation. An early work, and one of the most cited studies, is the U.S. Department of Transportation Technical Report (1975). The essence of the work is the application of difference-in-differences (DID) approach to measure DST effect on electricity consumption. The main finding is a 1% load reduction during the Spring and Fall transitions. However, that result was questioned by Filliben
(1976), which finds it to be not statistically significant.
Several methods have been used to estimate the effect of DST on electricity consump-tion. Aries and Newsham (2008) broadly reviews the related literature and finds that the results vary from study to study, and are very dependent on the local conditions. Among the most cited and celebrated papers, Kotchen and Grant(2011) take advantage of a natural experiment in Indiana and estimate the effect of DST on electric energy con-sumption by using a DID approach. The authors find that DST increased concon-sumption, with a cost increment of $9 million per year in electricity bills and increase pollution abatement costs approximately $1.7 million. Kellogg and Wolff (2008) analyzes another natural experiment in Australia, also using a DID framework. The authors compare two states using load data and use the fact that only one of them experienced DST exten-sion due to the Summer Olympic Games in 2000. They cannot find a significant effect on electricity residential consumption during the entire day. Concretely, the increase in demand in the morning practically offsets the decrease in demand in the evening. They also question the methodology used by the California Energy Commission (2001), and, by extension, the results obtained. By applying the CEC technique to Australian data,
Kellogg and Wolff (2008) finds that the simulation method fails to predict the observed outcomes in Australia, and therefore, put under doubt CEC’s own results for California.
DID estimation approach to assess the average effect for DST in Sweden and Norway. They find a 1.3% reduction in electricity consumption in both countries as well as an annual saving of 16.1 million euros for Norway, and 30.1 million euros for Sweden. Hill et al. (2010) uses a support vector regression technique and explores the possibility of maintaining DST over winter in UK, instead of reverting to standard time (GMT). They find that advancing the clock by 1 hour in the winter leads to daily energy savings of 0.3% and cost savings of 0.6%. The associated annual reduction in CO2 emissions is
approximately 450,000 tons.
Using a different approach, Rock(1997) adopts a simulation model to predict energy consumption of a representative residence in the U.S. and finds that electricity consump-tion slightly increases when DST is observed. In a similar fashion, Fong et al. (2007) simulates different saving time scenarios for several regions in Japan and conclude that a double DST (i.e., +2hrs) would be the optimal setting for household lighting consump-tion. With a similar exercise, Shimoda et al. (2007) extends the simulation idea to also account for residential cooling and finds that electricity use increases by 0.13%.
To the best of our knowledge, there is no paper investigating the effect of DST on power demand in Argentina, and just a few case studies have done so for emerging economies. For example,Awad Momani et al. (2009) analyzes DST application by using daily load curves for Jordan and finds a slight decrease in electricity use for illumination purposes, but an increase in the overall yearly electricity consumption. Karasu (2010) studies the case of Turkey before and after the transition to DST. The author proposes a scenario with a 30-minute forward shift to single DST from April to October as the best solution to save electricity. As stated before, the Argentinean case is relevant for several reasons: there are few studies for emerging countries; this nation is under a complex situation regarding the overall electricity market organization and operation (both electricity consumption and peak demand are very important); the evidence to date for other countries (both developed and emerging ones) is very inconclusive about the effect of DST on electricity consumption and its corresponding impact on air pollution. The latter is true, even for simulation-based studies. In a nutshell, there is a clear need for more empirical evidence of DST impact on electricity consumption and daily peak demand, and the Argentine case analyzed in this paper can help elucidate these issues.
3
Data Description and Research Strategy
consumption, but will refer to it simply as ‘DST’.
The federal government has the authority to implement DST in all the Argentinean territory. It can also decide when DST starts and ends. The DST practice in 2007-2008 was heavily criticized, especially by the western provinces which suffered undesired effects which were derived from late sunsets (e.g. declines in tourist activities such as restaurants, music festivals, and theaters). As a result, in the subsequent summer they were excluded from DST obligation. Figure 1 shows DST application by provinces. Finally, at the end of the summer of 2008–2009, DST was no longer applied over any part of the country.
In a complex context of energy stress, the application of DST has been debated among several policymakers and politicians belonging to different political parties and levels of the government (municipal, provincial, and federal). The main points of the discussion lie in two related areas: Does DST effectively save energy? Does it reduce peak power demand?
Our empirical strategy relies on having hourly consumption data for each province both before and after the policy changes previously mentioned. The different lengths of DST also provide an additional source of heterogeneity. We, thus, have treatment and control groups (see Figure 1). The essential identification assumption is that once we control for observables such as weather and DST observance, the evolution of electricity consumption in the control and treatment groups will be otherwise the same. Under this assumption, it is possible to identify DST’s impact on electricity consumption using a difference-in-differences approach.
Province-level hourly electricity consumption data (measured in MWh) were provided by Compa˜n´ıa Administradora del Mercado Mayorista El´ectrico (CAMMESA), i.e. the administrator of the wholesale electricity market.5
Weather data were obtained from
Ser-5
vicio Meteorol´ogico Nacional (SMN). Monthly economic activity data for each province were provided by the Instituto Nacional de Estad´ısticas y Censos (INDEC). Finally, sunrise and sunset times were procured from Servicio de Hidrograf´ıa Naval.
For expositional purposes, we construct two sets of provinces. East provinces are those “treated” in the two summer periods when DST was practiced. West provinces were treated in summer 2007-2008 only.6
Table 1 presents the summary statistics for East provinces and Table 2 does so for West provinces.
It is apparent that the East group consumes substantially more than the West group. The Metropolitan Area of Buenos Aires (AMBA hereafter) is, by far, the region with the largest electricity consumption with more than 4,500 MWh on average. The rest of the Buenos Aires province is the second largest consumer (approx. 1,500 MWh), followed by Santa Fe (approx. 1,200 MWh) and Cordoba (approx. 800 MWh). All provinces in the western set have consumption below 300 MWh, with the only exception being Mendoza (more than 500 MWh). There is a considerable amount of heterogeneity in terms of weather variables, in both groups.
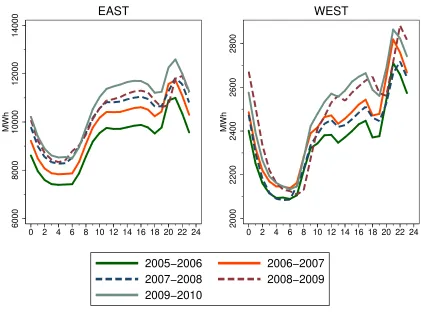
The sample period considered in all our analysis consists of observations between October 19 and March 15 for the years 2005 through 2010. Figure 2 shows hourly electricity consumption in both treated and non-treated summer periods for selected provinces. Only working days are considered (i.e., Sundays, Saturdays, and holidays are excluded). It is apparent that the load curve shapes are relatively stable during the non-treated periods (continuous lines) for both groups. During the non-treated summers (dash lines), load curves are shifted to the right during the evening and in the night. A similar, but secondary effect (in terms of its magnitude), occurs during the morning.
6
4
Empirical Strategy
The main concern, with regards to our empirical strategy, is the exogeneity of the natural experiment. It is true that the time change was implemented in the context of an emerging energy crisis, and so, the treatment is probably not fully exogenous. Nevertheless, the following two facts are relevant and need to be considered. First, during the sample period (i.e., summer seasons between 2005 and 2010), electricity demand was not constrained by distribution, transmission, or generation capacity problems.7
Second, as mentioned before, DST 2007–2008 is a natural experiment because many provinces were forced to apply the policy by the federal government. This was not the case the following year, when twelve provinces opted out and were authorized to not adopt DST by the Federal Government. In that sense, the allocation of provinces that implemented the DST 2008-2009 was not random: in the map of Figure 1, it is clear that western provinces were the ones that decided not to adhere to the policy. In order to tackle this last problem, in our empirical approach, we control for many observable variables that very likely have to do with the participation decision. There might be, however, unobservables affecting electricity consumption differentially between those provinces which apply DST and those which opt out. If that is the case, there will be a source of bias that could contaminate our results. In support of our empirical exercise, several observable variables remain invariant over time. Hence, to minimize the selection bias, we estimate a model of difference-in-differences where dummy variables by province, date, hour, day of the week, and type of day (i.e., working and non-working) are used to control for those fixed effects.
7
The resulting regression model has the following general specification:
ln(Qith) =γhDSTith+F (With) +ηt+ζh+ωi+εith (1)
where subscriptstdenotes date,hdenotes hour, andidenotes province.8
The dependent variable Qith is the electricity consumption measured in MWh. The variableDSTith is a
dummy that takes on the value 1 if the province i in date t and hour h is applying the DST policy, and equals to 0 otherwise. Additionally, ηt is a date-specific intercept, ζh is
an hour-specific intercept, ωi province-specific intercept, and εith is the error term. The
arguments of function F(.) are weather variables, With, and we allow for non-linearities
and interactions with group of provinces dummy variables.9
We are mainly interested in the estimate of γh which captures the treatment effect due to the DST policy. More
concretely, we estimate the average hourly effect and also the hour-specific effects of DST on electricity consumption.
The second issue we investigate in this study is the effect of DST on peak power demand. Since total demand is nationally integrated through the Argentine Intercon-nected System (SADI), the natural question to answer is whether DST affects aggregate national peak demand.10
Peak demand for each individual province is perhaps relevant for several other reasons, but not from the policy perspective which we are analyzing in this document where the aggregate national peak demand is what really matters for capacity constraints and marginal cost determination. The equation we estimate is as follows:
8
AMBA is the Metropolitan Area of Buenos Aires, which includes the Federal Capital and a part of the Buenos Aires province. The rest of the Buenos Aires province is named simply Buenos Aires.
9
In particular, the variable temperature enters in a non-linear fashion. See for example Henley and Peirson(1997) for a discussion of parametric versus non-parametric demand specifications.
10
ln(P EAKt) =γ1 DST-1t+γ2 DST-2t+F(Wt) +β Xt+τt+εt (2)
where P EAKt is the peak power demand in date t for the entire country (National
Interconected System, SADI). The dummy variableDST-1ttakes on the value one during
the first DST policy application and zero otherwise, whereas DST-2t do the same for
the second DST. Xt is a vector of controls that includes: the national monthly estimate
of economic activity (EMAE), dummy variables for the day of the week and type of day (working and non-working), among other control variables. We also include a linear trend, τt, and εt is the error term.
Finally, we would like to see how DST affect the time at which national peak demand is reached. In order to do so, we estimate a model which is similar to equation2 but use time (in minutes) as the dependent variable.
5
Estimation Results
In Table 3, we report the fixed-effects estimates of equation 1. All four specifications include date, hour, and province fixed effects. Standard errors are double clustered at the level of provinces and days. The first specification presented in column A, which is the standard model that accounts for a single average DST effect. Model in column B incorporates interactions between DST and each of the 24 hours of the day. The model of column C makes use of interactions between weather variables and a dummy variable for east provinces (i.e., those provinces applying DST in both summer periods). Column D includes the two types of interactions mentioned before.
consumption 0.49% in model C and 0.63% in A. For the models that allow for differential hourly impact of DST (column B and D), our estimates indicate a clear pattern during the day. The application of the DST policy increments consumption during the morning, especially between 6h and 7h, then slightly decreases consumption between 11h and 13h, and finally, decreases consumption between 18h and 22h. In particular, the average con-sumption drop between 20h and 21h is substantial. Figure3 illustrates the consumption change patterns describe before. All weather variables (and their interactions with the east dummy) have the expected signs and are statistically significant.
The above estimation results are very important, given the current situation that the government is facing. They represent an evident trade-off, in terms of a key policy decision. On the one hand, the application of DST implies a slight increase in electricity consumption. According to our estimates, it probably lies between 0.4% and 0.6%. On the other hand, peak power demand is significantly reduced (in the range of 2.4% to 2.9%). In other words, policy makers need to compare: i) the fiscal burden of the additional energy subsidies due to a higher electricity consumption, versus ii) lower generation costs at peak times if marginal costs are increasing in the relevant segment affected by the policy, and iii) the reduction of the necessary installed capacity. Points i) and ii) are relevant to short-run decisions, while iii) has a bigger influence in medium- to long-run choices.
It is also interesting to calculate the additional monetary cost associated with the application of the DST policy, which, as seen before, has a positive impact on electricity consumption. The computation of the cost is not a simple task in Argentina, due to the uneven subsidies that prevail in the electricity sector. Distortions were, and still are, present in the generation, transmission and distribution of electricity. Based on the estimates of Hancevic et al. (2016), we only compute the effect of DST on generation costs. Hence, the additional generation costs caused by the policy were $10.9 and $18.0 millions of U.S. Dollars in the austral summer periods between 2007-2008 and 2008-2009, respectively.11
6
Environmental Impact of DST
In this section we calculate the environmental impact of the policy. The administrator of the wholesale electricity market (CAMMESA) provided us with detailed data of the
11
fuel mix used for electricity generation for each hour during the sample period. Emission rates measured in tons of emissions per MWh of electricity generation from natural gas, distillate fuel-oil, and gas-oil are taken from Secretariat of Energy (SENER). Table 6
presents four different sets of estimates for the impact of DST application in each treated period for the following air pollutants: Carbon Dioxide (CO2), Methane (CH4), Nitrous
Oxide (N2O), Sulfur Dioxide (SO2), Particulate Matter (PM), Nitrogen Oxides (NOX),
and Mercury (Hg).
The first column of the table constitutes the ‘factual’ estimation in the sense that it makes use of the marginal dispatch method. Specifically, for each hour in our sample, we consider the fuel mix used to generate electricity at 10% margin, considering all the relevant characteristics of the fuels used. Those figures are then used to compute the hourly-specific emission factor, which, in turn, is multiplied by the hourly electricity consumption and the corresponding regression coefficient. The equation used in our calculations is as follows:
X
f
EFf ×Zthf
!
×γh
whereEFf is the emission factor of fuelf=natural gas, gas-oil, and fuel-oil. The variable Zthf is the quantity of fuel burned in date t at time h, and γh is the hour h associated
regression coefficient taken from specification (D) in Table 3.
The other three columns in Table 6 suppose that only one fuel type is used: natural gas, fuel-oil, or gas-oil. Although Argentina is not among the group of highest polluting nations, the additional pollution generated due to DST observance represents another powerful argument against its application. GHG emissions (in particular, CO2 and CH4)
regu-larly associated to local damages (as opposed to the ‘global effects’ of GHG), are more predominant when alternative fuels are used (e.g., coal and petroleum).12
7
Conclusion
In several countries, the practice of DST started during World War I, but many of them discontinued its practice after World War II. The policy recovered support and was re-established during the oil crisis in the 1970s, and have steadily gained popularity until today. Moreover, some countries have recently applied (or at least consider) extensions to DST. The main purpose of this policy has always been energy conservation. However, the empirical evidence of energy savings caused by DST policy is rather scarce.
In this study, we make use of a natural experiment that occurred in Argentina to provide empirical estimates of DST’s effect on hourly electricity consumption at the province level and on the aggregate national peak demand. DST was differentially applied across the country: some provinces opted out, and there was significant variation in the length of the application of the policy during the consecutive summer periods of 2007– 2008 and 2008–2009. Our main empirical outcome is twofold. First, contrary to the policy’s goal, DST increases the overall electricity consumption in the order of 0.4% to 0.6%. The pattern of changes in daily electricity consumption due to the policy is as follows: DST increments consumption during the morning, especially between 6h and 7h, then, it slightly decreases consumption between 11h and 13h, and finally, decreases consumption between 18h and 22h. Second, DST results in a decrease in the aggregate national peak demand that ranges between 2.4% and 2.9%. Those two group of figures represent an important trade-off, given the critical situation of the energy markets in Argentina. Policy-makers are called to compare the fiscal burden of the additional energy
12
subsidies, due to a higher electricity consumption with the lower generation costs at peak times (assuming marginal costs are increasing in the relevant segment affected by the policy), and the reduction of the necessary installed capacity.
In monetary terms, the implementation of DST represents extra generation costs that are estimated at $10.9 and $18.0 million USD for 2007–2008 and 2008–2009, respectively. Finally, the environmental impact of the policy is an increment of air pollutants. The size of the increment clearly depends on the mix of fuels being burned. We use detailed hourly fuel data and present reliable estimates of the main pollutants involved in electricity generation during the sample period.
In sum, the rationale for DST is, at the very least, questionable. The policy outcomes appear to be contrary to its planned effects. Although a case-by-case basis is surely the safest way of proceeding, this paper provides one more piece of evidence contributing to the general debate.
In terms of the areas for further research of the Argentine case, it would be interesting to explore the different possibilities of how to set the time across the country, in order to find the optimum. However, as mentioned in the literature review (section 2), a comprehensive study should not only include energy conservation goals, but also the reduction of undesired side effects, such as fatalities reduction, crime deterrence, among other objectives.
References
The Daylight Saving Time Study: A Report to Congress from the Secretary of Trans-portation. Technical report, U. S. Department of Transportation, 1975.
M. Awad Momani, B. Yatim, and M. A. M. Ali. The impact of the daylight saving time on electricity consumption-A case study from Jordan. Energy Policy, 37(5):2042–2051, 2009.
D. Coate and S. Markowitz. The effects of daylight and daylight saving time on US pedestrian fatalities and motor vehicle occupant fatalities. Accident Analysis and Pre-vention, 36(3):351–357, 2004.
C. E. Commission. The Effects of Daylight Saving Time on California Electricity Use. Technical report, California Energy Commission, 2001.
J. L. Doleac and N. J. Sanders. Under the cover of darkness: How ambient light influences criminal activity. Review of Economics and Statistics, 97(5):1093–1103, 2015.
S. A. Ferguson, D. F. Preusser, A. K. Lund, P. L. Zador, and R. G. Ulmer. Daylight saving time and motor vehicle crashes: The reduction in pedestrian and vehicle occupant fatalities. American Journal of Public Health, 85(1):92–96, 1995.
J. J. Filliben. Review and Technical Evaluation of the DOT Daylight Saving Time Study. Technical report, U.S. National Bureau of Standards, NBS Internal Report Prepared for the Chairman Subcommittee on Transportation and Commerce, Committee on Interstate and Foreign Commerce, U.S. House of Representatives, KF27.I5589, Wash-ington., 1976.
W.-K. Fong, H. Matsumoto, Y.-F. Lun, and R. Kimura. Energy Savings Potential of the Summer Time Concept in Different Regions of Japan from the Perspective of Household Lighting. Journal of Asian Architecture, 6(November):371–378, 2007.
P. Hancevic, W. Cont, and F. Navajas. Energy Populism and Household Welfare. Energy Economics, 56:464–474, 2016.
A. Henley and J. Peirson. Non-linearities in Electricity Demand and Temperature: Para-metric versus Non-paraPara-metric Methods. Oxford Bulletin of Economics and Statistics, 59(1):149–62, 1997.
S. I. Hill, F. Desobry, E. W. Garnsey, and Y. F. Chong. The impact on energy consump-tion of daylight saving clock changes. Energy Policy, 38(9):4955–4965, 2010.
S. Karasu. The effect of daylight saving time options on electricity consumption of Turkey. Energy, 35(9):3773–3782, 2010.
R. Kellogg and H. Wolff. Daylight time and energy: Evidence from an Australian exper-iment. Journal of Environmental Economics and Management, 56(3):207–220, 2008.
M. J. Kotchen and L. E. Grant. Does Daylight Saving Time Save Energy? Evidence from a Natural Experiment in Indiana. Review of Economics and Statistics, 93(November): 1172–1185, 2011.
T. A. Lahti, S. Leppamaki, J. Lonnqvist, and T. Partonen. Transition to daylight saving time reduces sleep duration plus sleep efficiency of the deprived sleep. Neuroscience Letters, 406(3):174–177, 2006.
F. M. Mirza and O. Bergland. The impact of daylight saving time on electricity consump-tion: Evidence from southern Norway and Sweden. Energy Policy, 39(6):3558–3571, 2011.
B. Rock. Impact of daylight saving time on residential energy consumption and cost.
Energy and Buildings, 25(1):63–68, 1997.
Y. Shimoda, T. Asahi, A. Taniguchi, and M. Mizuno. Evaluation of city-scale impact of residential energy conservation measures using the detailed end-use simulation model.
Tables
Table 1:
Summary Statistics - Eastern Provinces
Oct 19, 2006 Consumption Temperature Humidity Pressure Wind Speed Sunshine
to (MWh) (Celsius) (%) (hPa) (km/h) (h/day)
Mar 15, 2007 mean sd mean sd mean sd mean sd mean sd mean sd
AMBA 4519.26 (901.16) 22.79 (3.81) 70.01 (13.49) 1011.96 (4.82) 17.13 (9.15) 13.78 (0.61)
Buenos Aires 1486.67 (177.45) 18.32 (5.24) 73.85 (18.45) 1011.06 (5.45) 14.73 (8.76) 14.06 (0.71)
Chaco 196.47 (43.32) 26.11 (4.85) 72.67 (17.66) 1003.38 (3.74) 11.34 (6.06) 13.36 (0.46)
Cordoba 828.12 (148.13) 21.97 (4.86) 67.55 (20.06) 956.91 (4.23) 13.89 (8.83) 13.59 (0.54)
Corrientes 227.06 (41.56) 26.04 (4.60) 70.20 (16.66) 1002.86 (3.67) 12.38 (6.78) 13.36 (0.45)
Entre Rios 289.36 (50.87) 23.10 (4.80) 70.00 (18.73) 1002.46 (4.35) 12.53 (9.86) 13.61 (0.54)
Misiones 148.98 (15.00) 26.52 (4.42) 68.16 (17.28) 995.79 (3.19) 9.05 (4.92) 13.36 (0.45)
Santa Fe 1171.05 (163.44) 22.88 (4.89) 70.38 (19.01) 1008.23 (4.50) 11.48 (7.99) 13.68 (0.57)
Sgo. Estero 101.43 (22.47) 25.80 (5.34) 67.22 (20.68) 984.74 (40.76) 9.17 (6.63) 13.38 (0.46)
Tucuman 245.46 (46.16) 24.22 (4.58) 74.15 (16.62) 958.11 (4.52) 11.25 (6.80) 13.33 (0.44)
Oct 19, 2007 Consumption Temperature Humidity Pressure Wind Speed Sunshine
to (MWh) (Celsius) (%) (hPa) (km/h) (h/day)
Mar 15, 2008 mean sd mean sd mean sd mean sd mean sd mean sd
AMBA 4623.31 (899.65) 22.38 (4.08) 68.15 (14.52) 1011.91 (4.88) 16.75 (9.22) 13.78 (0.61)
Buenos Aires 1547.22 (170.58) 18.02 (5.60) 72.78 (19.87) 1011.06 (5.62) 15.78 (9.04) 14.06 (0.71)
Chaco 201.79 (43.30) 25.16 (5.33) 69.59 (20.33) 1003.79 (3.80) 10.29 (5.89) 13.36 (0.46)
Cordoba 891.87 (151.80) 22.45 (5.21) 59.78 (21.13) 957.17 (4.06) 13.68 (8.83) 13.58 (0.54)
Corrientes 235.80 (41.79) 25.30 (5.05) 65.83 (18.56) 1003.20 (3.74) 12.41 (6.88) 13.36 (0.46)
Entre Rios 308.44 (55.91) 23.04 (5.32) 65.64 (19.01) 1002.68 (4.22) 11.36 (8.24) 13.60 (0.55)
Misiones 157.38 (18.90) 25.64 (4.59) 65.40 (17.75) 995.84 (3.39) 10.06 (5.75) 13.35 (0.46)
Santa Fe 1253.88 (176.40) 22.60 (5.43) 66.40 (19.44) 1008.51 (4.42) 12.38 (9.85) 13.67 (0.57)
Sgo. Estero 108.96 (23.06) 25.70 (5.71) 62.77 (21.64) 983.17 (61.79) 9.30 (6.47) 13.37 (0.46)
Table 2:
Summary Statistics - Western Provinces
Oct 19, 2006 Consumption Temperature Humidity Pressure Wind Speed Sunshine
to (MWh) (Celsius) (%) (hPa) (km/h) (h/day)
Mar 15, 2007 mean sd mean sd mean sd mean sd mean sd mean sd
Catamarca 194.84 (15.83) 26.90 (5.18) 54.61 (19.17) 954.93 (4.52) 19.78 (13.04) 13.42 (0.48)
Jujuy 81.29 (15.23) 22.98 (4.22) 75.14 (17.61) 908.45 (3.76) 8.03 (6.83) 13.19 (0.39)
La Pampa 72.69 (15.80) 21.87 (6.18) 55.53 (23.66) 988.95 (4.67) 14.21 (10.81) 13.92 (0.66)
La Rioja 117.64 (16.66) 26.75 (5.58) 55.69 (20.47) 959.09 (4.67) 11.12 (6.74) 13.47 (0.49)
Mendoza 532.61 (65.29) 23.86 (5.22) 48.41 (17.39) 930.42 (4.08) 8.49 (6.58) 13.67 (0.57)
Neuquen 224.78 (24.21) 21.04 (6.12) 41.33 (19.63) 980.19 (4.50) 11.97 (8.98) 14.08 (0.73)
Salta 140.72 (27.11) 21.21 (4.26) 75.90 (18.11) 877.32 (3.42) 7.85 (6.82) 13.22 (0.40)
San Juan 196.80 (26.70) 25.48 (5.98) 41.25 (17.30) 941.66 (4.45) 15.87 (9.53) 13.59 (0.54)
San Luis 137.17 (24.15) 22.94 (5.13) 54.95 (19.18) 929.75 (3.75) 19.71 (11.26) 13.70 (0.58)
Santa Cruz 48.09 (5.62) 11.49 (4.49) 54.85 (21.00) 998.46 (9.14) 26.71 (16.03) 15.29 (1.18)
Oct 19, 2007 Consumption Temperature Humidity Pressure Wind Speed Sunshine
to (MWh) (Celsius) (%) (hPa) (km/h) (h/day)
Mar 15, 2008 mean sd mean sd mean sd mean sd mean sd mean sd
Catamarca 194.55 (16.22) 26.41 (5.37) 53.42 (20.39) 955.76 (4.52) 18.52 (13.22) 13.41 (0.48)
Jujuy 89.77 (15.12) 22.57 (4.63) 71.54 (18.88) 909.06 (3.80) 9.03 (7.26) 13.19 (0.40)
La Pampa 77.56 (17.79) 21.37 (6.20) 55.86 (22.76) 989.26 (4.55) 15.18 (8.97) 13.91 (0.66)
La Rioja 124.97 (18.93) 27.10 (5.78) 49.41 (20.89) 959.54 (4.71) 11.67 (7.07) 13.50 (0.48)
Mendoza 541.48 (69.49) 23.77 (5.36) 49.70 (18.95) 931.17 (4.17) 8.02 (6.48) 13.67 (0.57)
Neuquen 262.73 (27.12) 22.08 (6.38) 38.89 (18.61) 980.43 (4.52) 12.91 (9.57) 14.07 (0.73)
Salta 151.82 (28.40) 20.49 (4.56) 74.94 (19.14) 877.91 (3.46) 7.62 (6.42) 13.22 (0.40)
San Juan 183.62 (29.73) 25.18 (6.13) 40.16 (19.57) 942.49 (4.49) 16.27 (10.58) 13.59 (0.54)
San Luis 146.78 (24.72) 22.89 (5.47) 53.27 (19.34) 930.48 (3.83) 17.65 (10.14) 13.70 (0.58)
Table 3:
Fixed Effects Models for DST Natural Experiment
Variable (A) (B) (C) (D)
DST 0.00634*** (0.00101) 0.00490*** (0.00102)
temp -0.02387*** (0.00083) -0.02499*** (0.00083) -0.01896*** (0.00098) -0.01939*** (0.00098) temp2
0.00148*** (0.00004) 0.00152*** (0.00004) 0.00117*** (0.00004) 0.00116*** (0.00004) temp3
-0.00002*** (0.00000) -0.00002*** (0.00000) -0.00002*** (0.00000) -0.00002*** (0.00000) humidity 0.00019*** (0.00002) 0.00017*** (0.00002) -0.00019*** (0.00003) -0.00019*** (0.00003) pressure 0.00004* (0.00002) 0.00005* (0.00002) -0.00125*** (0.00009) -0.00126*** (0.00009) wind -0.00040*** (0.00003) -0.00038*** (0.00003) -0.00018*** (0.00003) -0.00018*** (0.00003) sunshine -0.00845*** (0.00126) -0.00823*** (0.00125) -0.01024*** (0.00125) -0.00998*** (0.00125)
DST 00:00 0.01755*** (0.00270) 0.01940*** (0.00268)
DST 01:00 0.02042*** (0.00303) 0.02373*** (0.00301)
DST 02:00 0.02305*** (0.00327) 0.02769*** (0.00326)
DST 03:00 0.02029*** (0.00324) 0.02614*** (0.00325)
DST 04:00 0.01794*** (0.00314) 0.02471*** (0.00316)
DST 05:00 0.02134*** (0.00299) 0.02877*** (0.00302)
DST 06:00 0.06123*** (0.00267) 0.06989*** (0.00269)
DST 07:00 0.06021*** (0.00247) 0.06909*** (0.00245)
DST 08:00 0.02218*** (0.00251) 0.03034*** (0.00250)
DST 09:00 0.00970*** (0.00247) 0.01495*** (0.00245)
DST 10:00 0.00340 (0.00245) 0.00539* (0.00243)
DST 11:00 0.00006 (0.00237) -0.00188 (0.00237)
DST 12:00 -0.00535* (0.00231) -0.01094*** (0.00231)
DST 13:00 -0.00008 (0.00232) -0.00861*** (0.00229)
DST 14:00 0.01325*** (0.00251) 0.00241 (0.00241)
DST 15:00 0.01925*** (0.00261) 0.00656** (0.00249)
DST 16:00 0.01763*** (0.00249) 0.00403 (0.00238)
DST 17:00 0.01371*** (0.00238) 0.00024 (0.00233)
DST 18:00 0.00880*** (0.00219) -0.00372 (0.00219)
DST 19:00 -0.02950*** (0.00218) -0.04053*** (0.00221)
DST 20:00 -0.11558*** (0.00245) -0.12394*** (0.00247)
DST 21:00 -0.05644*** (0.00259) -0.06050*** (0.00259)
DST 22:00 -0.00087 (0.00229) -0.00205 (0.00228)
DST 23:00 0.01597*** (0.00230) 0.01646*** (0.00229)
temp ×east -0.01096*** (0.00144) -0.01377*** (0.00144)
temp2
×east 0.00067*** (0.00007) 0.00082*** (0.00007)
temp3
×east -0.00001*** (0.00000) -0.00001*** (0.00000)
hum ×east 0.00104*** (0.00003) 0.00097*** (0.00003)
press ×east 0.00129*** (0.00009) 0.00131*** (0.00009)
wind ×east -0.00075*** (0.00006) -0.00065*** (0.00006)
sun×east -0.00528*** (0.00073) -0.00629*** (0.00073)
intercept 7.33928*** (0.02915) 7.34180*** (0.02888) 7.40393*** (0.02999) 7.43276*** (0.02964)
Observations 346,890 346,890 346,890 346,890
Adj. R2
0.987 0.987 0.987 0.987
Table 4:
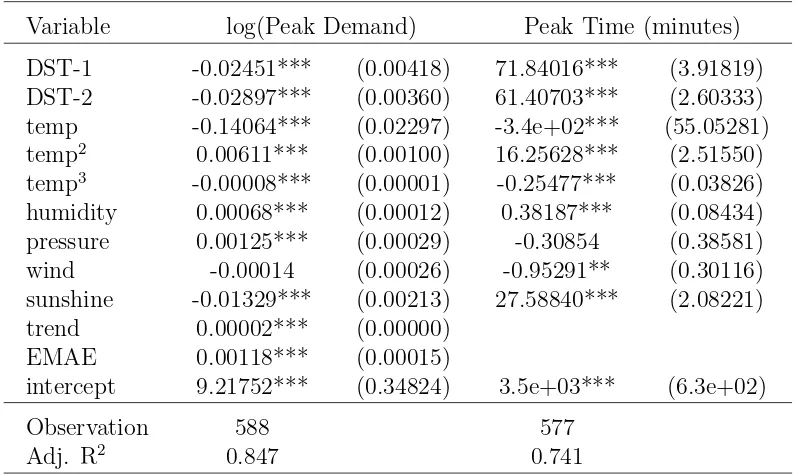
Estimates of DST effect on peak power demand
Variable log(Peak Demand) Peak Time (minutes) DST-1 -0.02451*** (0.00418) 71.84016*** (3.91819) DST-2 -0.02897*** (0.00360) 61.40703*** (2.60333) temp -0.14064*** (0.02297) -3.4e+02*** (55.05281) temp2
0.00611*** (0.00100) 16.25628*** (2.51550) temp3
-0.00008*** (0.00001) -0.25477*** (0.03826) humidity 0.00068*** (0.00012) 0.38187*** (0.08434) pressure 0.00125*** (0.00029) -0.30854 (0.38581) wind -0.00014 (0.00026) -0.95291** (0.30116) sunshine -0.01329*** (0.00213) 27.58840*** (2.08221) trend 0.00002*** (0.00000)
EMAE 0.00118*** (0.00015)
intercept 9.21752*** (0.34824) 3.5e+03*** (6.3e+02) Observation 588 577
Adj. R2
0.847 0.741
All models include day type fixed effects. Standard errors in parentheses Significance levels: *p<0.05, **p<0.01, ***p<0.001.
DST-1: Dec 30, 2007 - Mar 15, 2008 DST-2: Oct 19, 2008 - Mar 14, 2009
Table 5:
Peak Power Demand Times
No DST DST-1 DST-2 mean std. dev. mean std. dev. mean std. dev. October 20:36 (00:15) 21:38 (00:15) November 20:53 (00:15) 21:51 (00:17) December 21:18 (00:15) 22:38 (00:28) 22:17 (00:17) January 21:02 (01:39) 22:23 (00:16) 22:19 (00:11) February 21:00 (00:50) 22:00 (00:20) 21:59 (00:14) March 20:43 (00:13) 21:33 (00:13) 21:35 (00:14) DST-1: Dec 30, 2007 - Mar 15, 2008
[image:25.612.128.507.519.649.2]Table 6:
Impact of DST on Air Emissions (in metric tons)
(Change in emissions during treated periods)
DST Marginal
2007-2008 Dispatch (10%) Natural Gas Fuel Oil Gas Oil CO2 5.992E+04 7.600E+04 1.357E+05 1.301E+05
CH4 3.965E-01 1.438E+00 5.450E+00 5.163E+00
N2O 1.956E+00 1.396E-01 1.115E+00 1.056E+00
SO2 2.802E+02 3.795E-01 7.948E+02 7.937E+02
PM 2.296E+01 4.807E+00 6.368E+01 6.368E+01 NOx 4.167E+03 1.773E+05 2.501E+02 2.501E+02
Hg 5.926E-02 1.648E-01 5.996E-03 5.996E-03
DST Marginal
2008-2009 Dispatch (10%) Natural Gas Fuel Oil Gas Oil CO2 6.884E+04 1.435E+05 2.563E+05 2.457E+05
N2O 2.185E-01 2.715E+00 1.029E+01 9.749E+00
CH4 1.412E+00 2.636E-01 2.105E+00 1.994E+00
SO2 1.096E+02 7.166E-01 1.501E+03 1.499E+03
PM 1.262E+01 9.077E+00 1.202E+02 1.202E+02 NOx 8.077E+04 3.349E+05 4.722E+02 4.722E+02
Figures
Figure 1:
DST observance by province
Figure 2:
Electricity load curves: consumption in MWh
(Treated and non-treated periods for East and West groups)
6000
8000
10000
12000
14000
MWh
0 2 4 6 8 10 12 14 16 18 20 22 24 EAST
2000
2200
2400
2600
2800
MWh
0 2 4 6 8 10 12 14 16 18 20 22 24 WEST
2005−2006 2006−2007
2007−2008 2008−2009
Figure 3:
DST: Estimated hourly effects on electricity consumption
-15% -10% -5% 0% 5% 10%
00:00 02:00 04:00 06:00 08:00 10:00 12:00 14:00 16:00 18:00 20:00 22:00
Pe
rc
en
ta
ge
ch
an
ge
in
co
ns
um
pt
io
n
Clock Time